The Other Side Of The Bitcoin: Analyst Highlights What Happens If Bulls Fail

Bitcoin has currently entered a stage where the bulls and the bears are vying for absolute control over the price, meaning that it could swing either way. While sentiment is still mostly bullish from here, there is still the possibility that the bears could win out and this side of the coin has prompted crypto analyst FieryTrading to map out what could happen if this ends up being the case.

Identifying The Bearish Side Of Bitcoin

In the analysis, FieryTrading identified an indicator that might point toward a bearish reversal for Bitcoin and this was the Wyckoff distribution pattern. The analyst observes that the Bitcoin price might actually be current trading within this Wyckoff distribution pattern which would not be positive for the price.

“As seen on the chart, the BC/UT/UTAD are nearly identical as on the schematic. Three higher-highs, of which the first two are sold off quickly, and the last (UTAD) took a while before it turned bearish,” Fiery Trading explains.

Furthermore, the analyst explains that the AR and SOW phases identified in the chart above are almost identical. However, there is a significant difference, which is that the Bitcoin price has already retested the AR-low between the UT and UTAD identified twice already.

Bitcoin price chart from Tradingview.com

In a scenario where this bearish setup plays out, the crypto analyst explains that there will end up being another retest around the SOW region in the future. If this happens and support fails to hold, allowing the price to fall through this SOW area, then I would be very bearish for the price.

The target in such a scenario would be $30,000, effectively marking the $38,400 level as the local top. “This would also mean that 38.4k is the 2023 top, with a move towards 30.000$ being fairly likely,” FieryTrading posits.

The analyst reiterates their own bullishness toward the price of Bitcoin. However, they also express that it is important to see bearish signs when they appear. “The fact that we had three higher highs which were all sold off is alarming at the very least.”

BTC Begins To Slowdown

The Bitcoin price has already seen a slowdown after an impressive run-up above $38,000, which explains why some indicators have begun to turn bearish. One example of this is the decline in the trading volume which suggests that investors are not as active in the coin now as they used to.

The decline in trading volume has coincided with a drop in the market sentiment. However, the negative sentiment is still drowned out predominantly by the positive as the Crypto Fear & Greed Index still points to greed. This suggests that despite the decline in price and trading volume, investors are not selling off much of their holdings.

Bitcoin price chart from Tradingview.com

Whale’s Move: $19.5 Million XRP Shifted To Exchange, Massive Sell Off On The Horizon?

Whale Alert, a renowned blockchain tracker, reported a substantial transfer of XRP tokens to the Bithumb crypto exchange. This transfer, involving over 32 million XRP tokens valued at roughly $19.5 million, originated from an unidentified wallet and was executed today at 05:15:10 UTC.

The substantial nature of this transaction places it firmly in the category of ‘whale transactions,’ which are often scrutinized due to their potential influence on market dynamics.

In the crypto space, such significant transfers are typically indicative of strategic moves by influential players within the market.

While the specific intention behind this transaction remains undisclosed, and the whale’s identity is unknown, its occurrence has not led to any notable immediate price fluctuations in XRP, with only a marginal decrease of 0.1% observed so far.

Massive Sell-Off On The Horizon?

Historically, the transfer of substantial amounts of crypto to exchanges by whales has been linked with either an intent to liquidate or to swap for other digital assets. This makes such movements anticipated to result in a price drop following a significant sell-off.

However, a technical analysis of the current situation suggests a different narrative for XRP. Looking at the asset’s chart on the 4-hour time frame, XRP has recently tapped into an order block on the sell side, which could signal an impending price reversal to the upside in trading parlance.

XRP price chart on Tradingview

Mainly, an order block in financial markets is essentially a zone where the initiation or absorption of a large volume of orders occurs. It is considered a crucial area on price charts, as traders often expect a reversal when the price taps into these zones.

In essence, an order block represents a consolidation area where significant trading activities previously took place, and revisiting these zones can often lead to a shift in market momentum.

So far, XRP has shown signs of reversal after tapping this orderblock. Particularly, the asset has moved from the price zone of $0.59, where the order block is located, and surged past $0.61 before showing a current retracement that brings its price to trade at $0.60.

Bullish Forecasts for XRP

Meanwhile, the XRP community has been witnessing a series of optimistic analyses from prominent crypto market analysts. Notably, Egrag, a renowned figure in the crypto analysis sphere, recently shared his insights on XRP, indicating a potential bullish reversal for the digital asset.

His analysis identified an inverse head and shoulders (H&S) pattern on XRP’s chart, a technical indicator often suggesting a trend change from bearish to bullish.

This positive sentiment is echoed by another market analyst, Ali Chart, who has projected a promising future for XRP. Ali’s analysis shows that the altcoin seems to be making a decisive break from a descending parallel channel.

According to his assessment, such a breakout could propel XRP’s price to the $0.65 to $0.66 range. These analyses collectively paint an encouraging picture for XRP, hinting at a potential shift in momentum and opening the possibility for significant price movements in the near term.

Featured image from Unsplash, Chart from TradingView

Chainlink Signal Resurfaces: Is Another 31% Rally Coming?

On-chain data shows that a Chainlink signal that last preceded a 31% rally for the asset’s price has just reversed.

Chainlink Age Consumed Metric Has Observed A Sharp Spike Recently

According to data from the on-chain analytics firm Santiment, LINK has recently seen a significant movement from old coins. The relevant indicator here is the “Age Consumed,” which tells us whether the dormant Chainlink tokens are on the move or not right now.

When the indicator’s value registers a large spike, it’s a sign that the blockchain is currently observing the transfer of a significant number of old coins. Such dormant tokens belong to a cohort called the “long-term holders” (LTHs), made up of the relentless hands of the sector.

As such, this metric surging can be something to watch out for, as it means that these LTHs, who usually remain quiet no matter what’s going on in the wider market, have decided to break their dormancy.

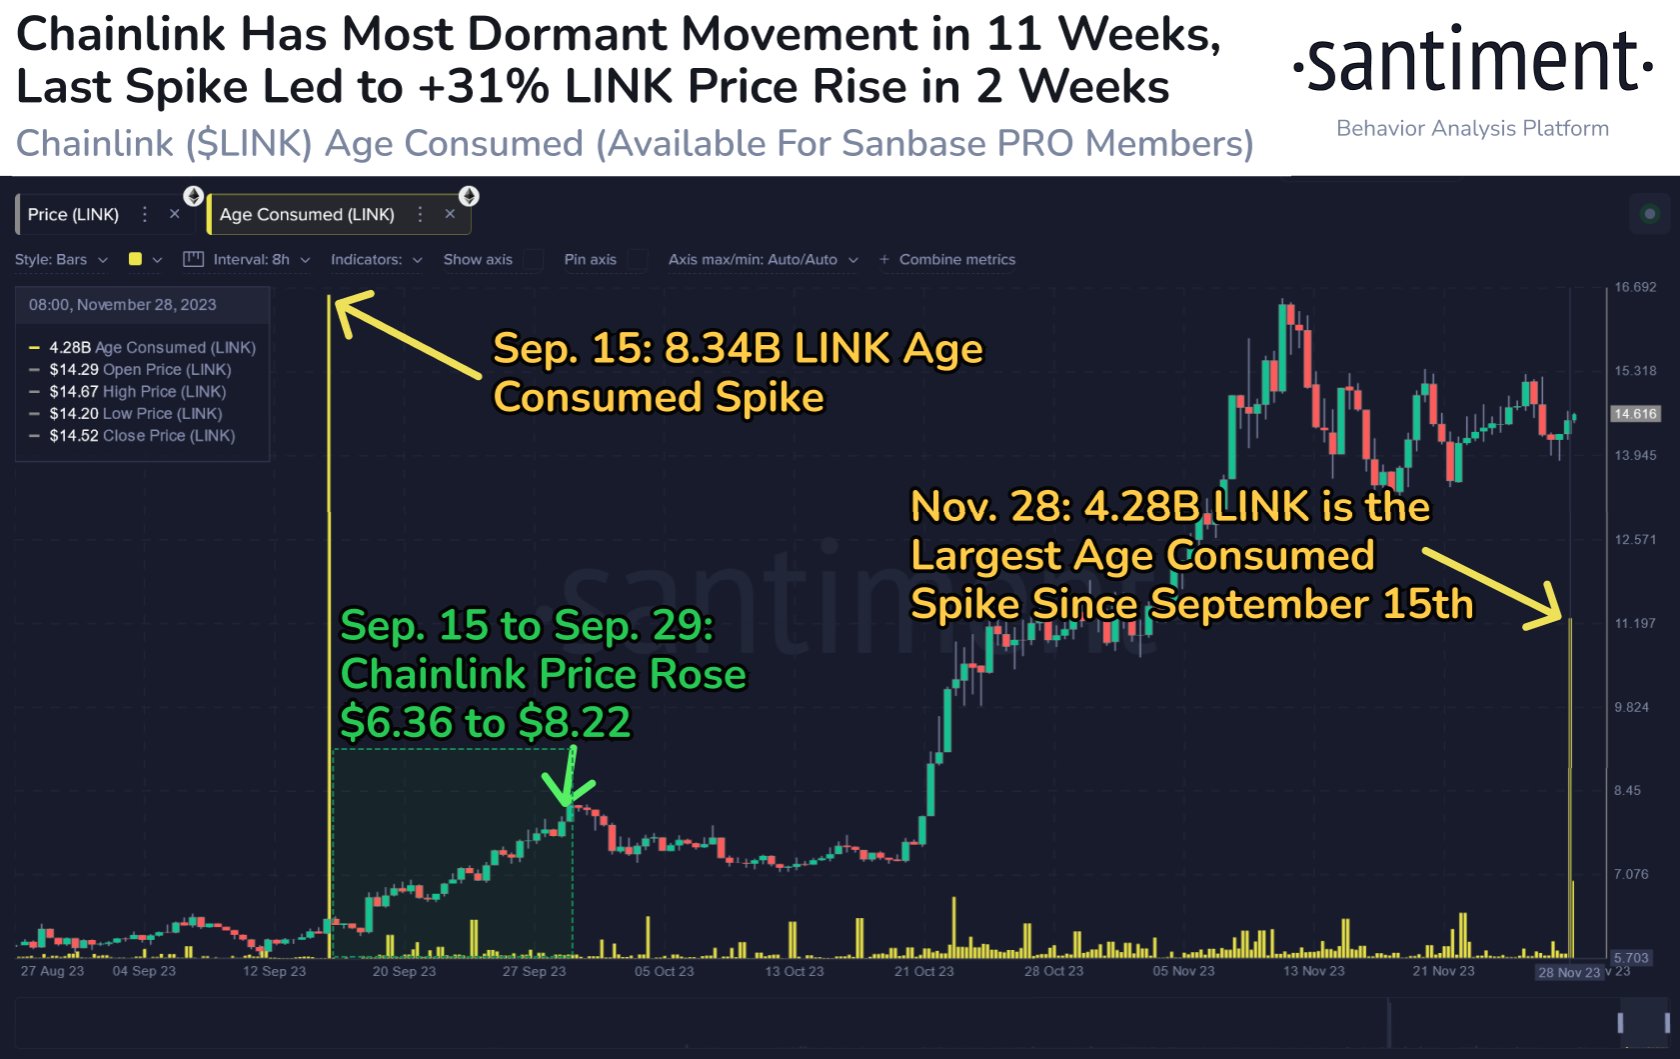
Now, here is a chart that shows the trend in the Chainlink Age Consumed over the last few months:

Chainlink Age Consumed

As displayed in the above graph, the Chainlink Age Consumed indicator has observed a sharp rise recently, implying that the LTHs have been making transactions.

At the peak of this latest spike, the metric’s value touched 4.28 billion, which is the highest level seen since the middle of September. Back then, the indicator registered a spike almost double in scale, and interestingly, what followed in the next couple of weeks was a 31% rally as LINK went from $6.36 to $8.22.

It’s hard to say if a similar pattern would repeat for Chainlink this time since the LTHs could have broken their silence for several reasons, including for selling.

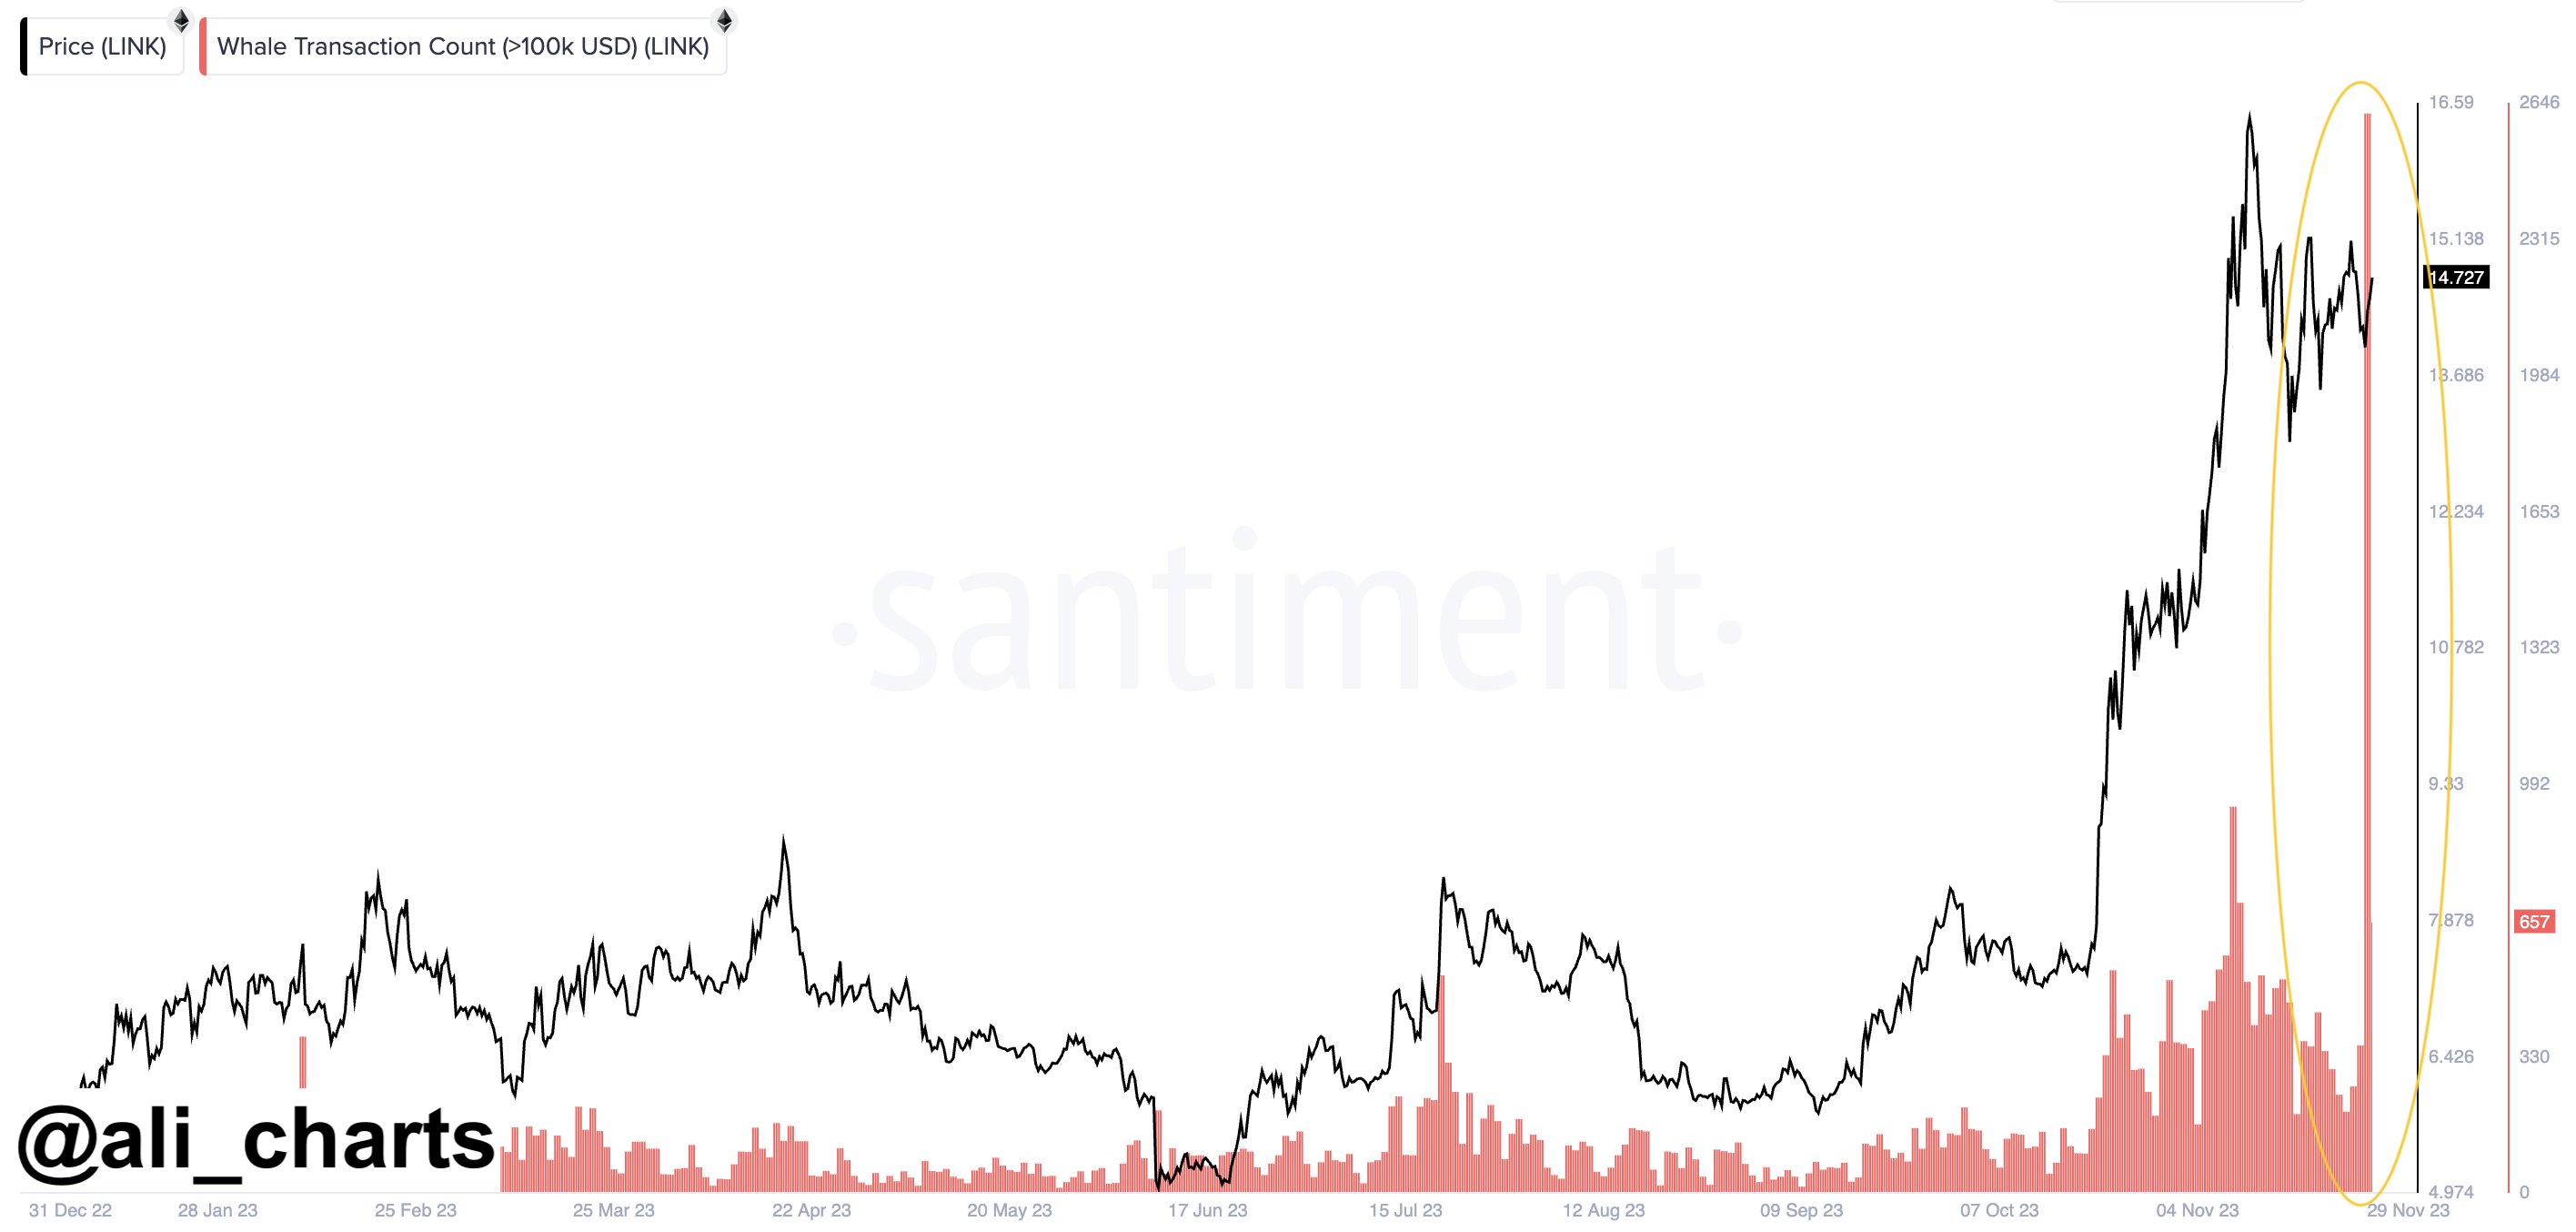
An analyst has pointed out that yesterday (which was about the same time as this spike in the Age Consumed), the whales made many transactions, as the chart below shows.

Chainlink Whale Transactions

In total, the Chainlink network observed 2,600 transactions valued over $100,000 yesterday. The spike would confirm that the LTHs who broke their dormancy weren’t just ordinary investors but the whales.

In isolation, it’s hard to say why these two indicators recently observed a spike. Still, when looking at the latest LINK news, perhaps the most likely explanation becomes apparent.

Yesterday, Chainlink staking v0.2 went live on the Ethereum blockchain, allowing the v0.1 stakers to migrate toward the new network. Thus, given the close timing of the spikes in the Age Consumed and Whale Transaction Count, it would appear quite probable that these LTHs were making transfers toward the new staking pools.

LINK Price

Chainlink had observed some drawdown towards the $13.7 mark just recently, but it would seem like the asset has already recovered as it’s now trading around $14.7.

Chainlink Price Chart