
The C1 Secondaries Fund, which invests in companies in the digital assets space, is reportedly seeking to invest in crypto firms at discounts of up to nearly 80%.
Cryptocurrency Financial News
The C1 Secondaries Fund, which invests in companies in the digital assets space, is reportedly seeking to invest in crypto firms at discounts of up to nearly 80%.
The Fed’s benchmark interest-rate range is currently 5.25% to 5.5%.

Nvidia CEO said the company has plans to expand its partnership in Vietnam and potentially set up a base to attract local talent in the AI industry.

BTC price action obliterates latecomers betting on continued upside as Bitcoin analysts and miners alike breathe a sigh of relief.

Users who deposit digital assets to exchanges in South Korea will be eligible to receive interest on their deposits.
Conio is also deeply involved in the institutional uptake of digital assets, specifically the Euro Token project overseen by the innovation center of the Bank of Italy.
Over the past 24 hours, the cryptocurrency market has witnessed Bitcoin consolidating its position in the digital financial space.
Amidst a wider cryptocurrency selloff, Bitcoin offered yet another example of its infamous volatility, plunging sharply toward the $40,000 region.
The leading cryptocurrency saw an 8% decline to $41,900 before reversing part of the losses and opening Monday’s trading 5% down at $42,090.
CoinGecko’s price updates show that Bitcoin has only shown slight variations over this period, indicating that it is in an equilibrium phase after its recent price spikes.
The subtle fluctuations in the price of Bitcoin indicate not just a break but also a chance for market players to evaluate the situation as it stands.
The well-known cryptocurrency trader Josh Olszewicz, who goes by the handle CarpeNoctom on X, completed an empirical study that suggests there is a considerable chance that Bitcoin (BTC) could collapse and possibly drop below the $38,000 mark.
bear case = 35.7k (daily Kijun)
SL on longs prob prudent around 42.8k pic.twitter.com/NqyLsJS9Nq
— Josh Olszewicz (@CarpeNoctom) December 10, 2023
Based on his analysis of the daily Kijun line—a pivotal technical signal in the world of cryptocurrency trading—Olszewicz maintains a gloomy outlook.
A crucial medium-term trend indication in cryptocurrency trading is the Kijun Line, which is a component of the Ichimoku Cloud indicator.
Averaging the highest high and lowest low across 26 periods, it helps traders determine levels of support and resistance as well as the general direction of the trend.
Prices may suggest a bullish or bearish trend depending on whether they are above or below the Kijun Line.
When Goichi Hosoda created the Ichimoku Cloud in the late 1930s, the Kijun Line was one of the main components.
Share this chart with your financial advisors (and the disclosures below).
Based on your risk tolerance and investment objectives, the addition of #Bitcoin, even in small increments like 0.5%, 1.5%, 2.5%, and 3%, has the potential to alter the dynamics of the traditional 60/40… pic.twitter.com/mfLFsmD4LK
— VanEck (@vaneck_us) December 10, 2023
Meanwhile, prominent asset management company VanEck has emphasized that Bitcoin’s (BTC) historical performance does not guarantee future outcomes.
This word of caution is important because VanEck is investigating the possible effects of adding Bitcoin to conventional portfolios, which puts the typical 60/40 investment approach to the test.
Justin Bennett, another cryptocurrency trader and analyst, is issuing an alert that Bitcoin (BTC) might revers its upward trajectory following another surge.
Share this chart with your financial advisors (and the disclosures below).
Based on your risk tolerance and investment objectives, the addition of #Bitcoin, even in small increments like 0.5%, 1.5%, 2.5%, and 3%, has the potential to alter the dynamics of the traditional 60/40… pic.twitter.com/mfLFsmD4LK
— VanEck (@vaneck_us) December 10, 2023
Bennett informs his 110,600 X social media followers that Bitcoin may rise one more time before making a correction.
The analyst provides a chart demonstrating how, on the daily chart, Bitcoin is presently trading inside a sizable ascending channel, with the pattern’s horizontal resistance located at roughly $48,000.
Based on the trader’s chart, it appears that he believes that after reaching his upside target, Bitcoin will drop below $38,000.
(This site’s content should not be construed as investment advice. Investing involves risk. When you invest, your capital is subject to risk).
Featured image from Pixabay
Crypto venture capital firm C1, which is led by former Coinbase executives, has met with several cryptocurrency groups and Australian venture firms offering to buy private holdings from investors using its $500 million ($AUD 760 million) fund, according to the Australian Financial Review.
Funding rates for major tokens, including BTC, have normalized to below 0.1%, indicating an exit of over leveraged bulls.
Solana surged toward $80 before the bears appeared. SOL price is now correcting gains but the bulls might remain active near the $65 support.
In the past few days, Solana saw a major rally above the $60 level. SOL gained bullish momentum after it settled above $65, like Bitcoin and Ethereum.
The bulls even pumped the price above the $72 level. A high was formed near $77.72 and the price recently saw a downside correction. It traded below $72 and tested $70. The bears were able to push the price below the 23.6% Fib retracement level of the upward move from the $53.50 swing low to the $77.72 high.
SOL is still trading above $66 and the 100 simple moving average (4 hours). There is also a key bullish trend line forming with support near $65.00 on the 4-hour chart of the SOL/USD pair.
The trend line is near the 50% Fib retracement level of the upward move from the $53.50 swing low to the $77.72 high. On the upside, immediate resistance is near the $72.00 level. The first major resistance is near the $75.00 level.
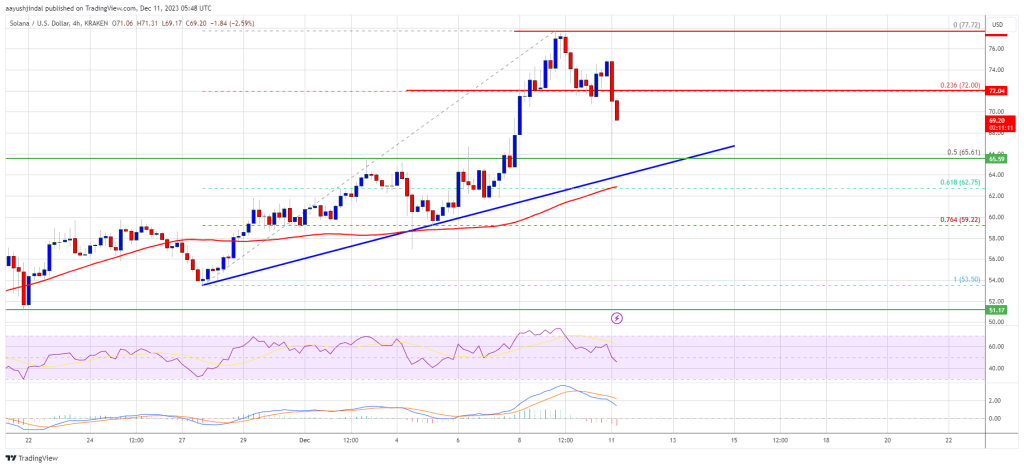
Source: SOLUSD on TradingView.com
The main resistance is now near $78. A successful close above the $78 resistance could set the pace for a larger increase. The next key resistance is near $82.50. Any more gains might send the price toward the $86.52 level.
If SOL fails to recover above the $72.00 resistance, it could continue to move down. Initial support on the downside is near the $68.00 level.
The first major support is near the $65.00 level or the trend line, below which the price could test $62. If there is a close below the $62 support, the price could decline toward the $55 support in the near term.
Technical Indicators
4-Hours MACD – The MACD for SOL/USD is gaining pace in the bearish zone.
4-Hours RSI (Relative Strength Index) – The RSI for SOL/USD is below the 50 level.
Major Support Levels – $65.00, and $62.00.
Major Resistance Levels – $72.00, $75.00, and $78.00.

The Justin Sun-linked crypto exchange HTX has witnessed $258 million in outflows in the wake of a $30 million exploit in November.

Google will allow ads for U.S. based-crypto trusts from January, with the change seemingly coming in the same month that spot Bitcoin ETFs are predicted to be approved.

The DeFi lending and borrowing protocol has confirmed it was affected by a malfunctioning Binance price oracle but confirmed user funds were safe.
Ethereum price took a major hit like Bitcoin and dropped over $350. ETH tested the $2,000 support and is currently attempting a fresh increase.
Ethereum price climbed further higher above the $2,300 level. ETH even cleared the $2,350 level but the bears remained active near the $2,400 zone. A high was formed near $2,401 and there was a sharp decline like Bitcoin.
The price declined over 8% and there was a move below the $2,200 level. Besides, there was a break below a key bullish trend line with support near $2,340 on the hourly chart of ETH/USD. The pair even spiked below the $2,000 support before the bulls appeared.
A low was formed near $1,980 and the price is now attempting a recovery wave. There was a move above the $2,150 and $2,180 levels. The price climbed above the 50% Fib retracement level of the downward move from the $2,401 swing high to the $1,980 low.
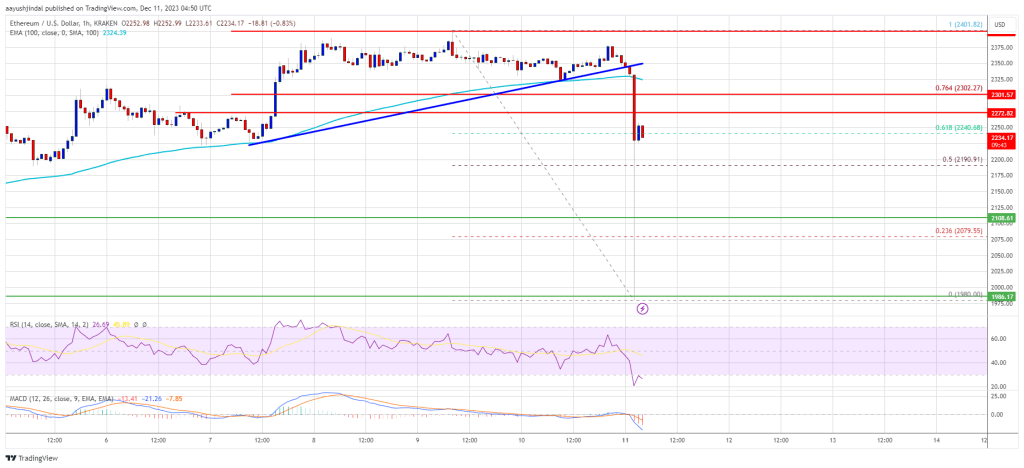
Source: ETHUSD on TradingView.com
On the upside, the price is facing resistance near the $2,275 zone. The next key resistance is near the $2,300 level or the 76.4% Fib retracement level of the downward move from the $2,401 swing high to the $1,980 low. A clear move above the $2,300 zone could send the price toward the $2,400 level. The next resistance sits at $2,450. Any more gains could start a wave toward the $2,500 level.
If Ethereum fails to clear the $2,300 resistance, it could start another decline. Initial support on the downside is near the $2,180 level.
The next key support is $2,120. The main support is now near $2,100. A downside break below $2,200 might start an extended decline. The key support is now at $2,000, below which there is a risk of a move toward the $1,880 level in the near term.
Technical Indicators
Hourly MACD – The MACD for ETH/USD is gaining momentum in the bearish zone.
Hourly RSI – The RSI for ETH/USD is now below the 30 level.
Major Support Level – $2,100
Major Resistance Level – $2,300

Onlookers praised the Gemini tech demo from Google upon its release last week but the tech firm admits some of it was jazzed up for “brevity.”
Bitcoin price started a sharp decline after trading close to $45,000. BTC is down over 8% but the bulls seem to be active above $40,000.
Bitcoin price remained in a bullish zone after it broke the $40,000 resistance. BTC climbed higher steadily above the $42,000 and $43,000 levels. The price even rallied above $44,000.
However, it failed to test the $45,000 resistance. A high was formed near $44,699 and the price started a sharp downside correction. There was a move below the $44,000 level. Besides, there was a break below a key bullish trend line with support near $43,500 on the hourly chart of the BTC/USD pair.
The pair declined below the 50% Fib retracement level of the upward move from the $39,398 swing low to the $44,699 high. Bitcoin is now trading below $43,500 and the 100 hourly Simple moving average.
However, the bulls are protecting the $40,000 support and the 76.4% Fib retracement level of the upward move from the $39,398 swing low to the $44,699 high. The price is attempting a recovery wave and facing resistance near the $42,400 level.
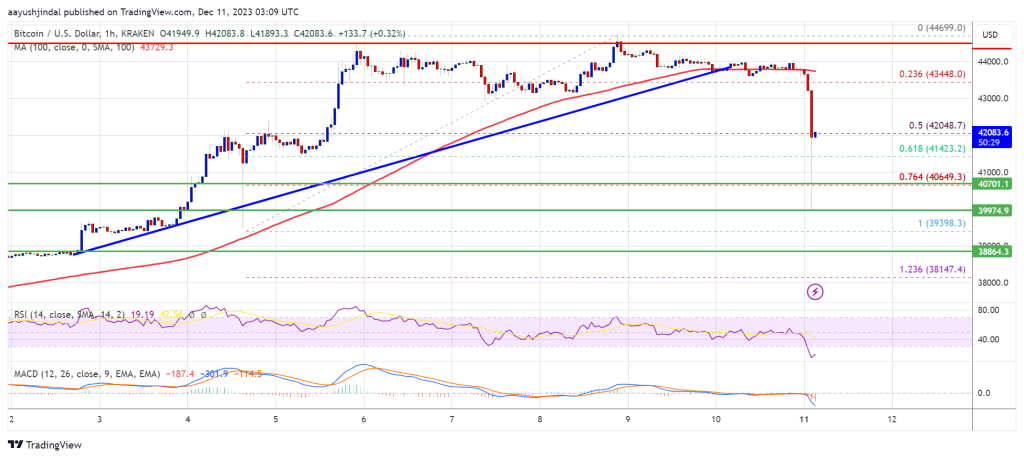
Source: BTCUSD on TradingView.com
The first major resistance is forming near $43,2000, above which the price might gain bullish momentum and rise toward $44,000. A close above the $44,000 resistance might start a strong upward move. The next key resistance could be near $44,200, above which BTC could rise toward the $45,000 level.
If Bitcoin fails to rise above the $43,200 resistance zone, it could start another decline. Immediate support on the downside is near the $41,200 level.
The next major support is near $40,500, below which the price might test the $40,000 zone. If there is a move below $40,000, there is a risk of more downsides. In the stated case, the price could drop toward the $38,500 support in the near term.
Technical indicators:
Hourly MACD – The MACD is now gaining pace in the bearish zone.
Hourly RSI (Relative Strength Index) – The RSI for BTC/USD is now below the 30 level.
Major Support Levels – $41,200, followed by $40,000.
Major Resistance Levels – $42,400, $43,200, and $44,200.

The price of Bitcoin suddenly dropped 6.5% to fall below $41,000 on Dec. 11, wiping out around five days of gains.
Bitcoin and Ether lead in liquidation heatmap with over $335 million in rekt positions in the last 12 hours.

The dog-themed token has surged to become the third-largest memecoin overall.

With a major rally expected sometime in 2024, industry watchers have shared the top signals they look for to indicate when crypto has reached peak euphoria.


