“Proposal 13” asked Microsoft to consider the potential for shareholder harm if its AI products created legal issues for the company over the long term.
Cryptocurrency Financial News
“Proposal 13” asked Microsoft to consider the potential for shareholder harm if its AI products created legal issues for the company over the long term.
The firm says it has already seen $6 billion in volume in the Latin American region since its debut in April.
Bitcoin has encountered a critical resistance level going into the weekend and could move sideways following a massive rally. According to an expert, the cryptocurrency has been breaching every major obstacle, making it one of the best-performing assets.
As of this writing, Bitcoin (BTC) trades at $43,600 with sideways movement in the last 24 hours. Over the previous seven days, BTC recorded a 14% increase, with Ethereum following its footsteps, recording a 13% rally.
Jurrien Timmer, Director of Macro for Fidelity, offers insightful analysis of Bitcoin’s trajectory, likening it to “exponential gold.”
His thesis suggests that Bitcoin, much like its elder counterpart, gold, holds value in times of structural inflation, yet it boasts an added venture twist. In that sense, Timmer believes both assets are prime to capture attention from investors looking to protect themselves from “reckless monetary inflation.”
As seen in the chart below, if Bitcoin follows a similar trajectory to the previous, its price could target $100,000 and $1,000,000 by early 2025.
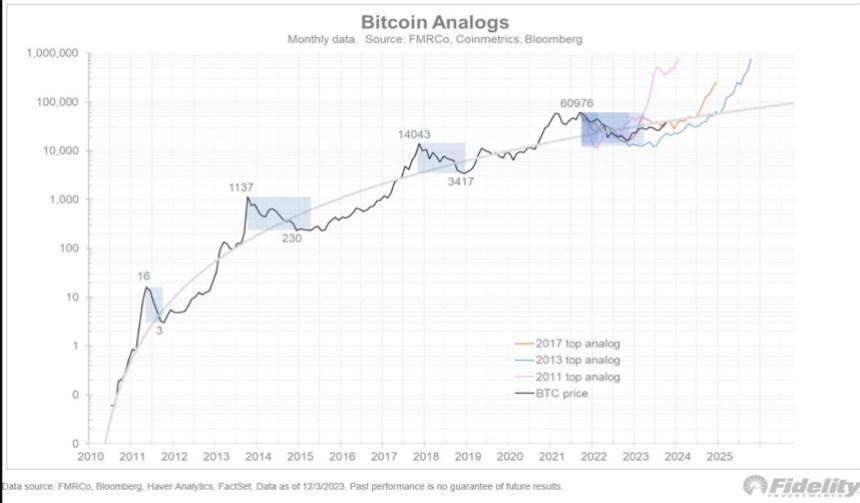
2020 was pivotal for Bitcoin and gold, with fiscal and monetary stimulus bolstering their appeal. However, Bitcoin differentiates itself with its capped supply of 21 million coins, contrasting gold’s continual but modest annual supply growth.
This limited supply has propelled Bitcoin’s “stock-to-flow” (S2F) ratio significantly higher than gold’s. Moreover, Bitcoin’s journey reflects the classic S-curve path of technological innovations. Its exponential growth trajectory mirrors historical trends in technology from railroads to cell phones.
However, predicting Bitcoin’s future based on these S-curves is complex, as slight deviations in these growth phases can “dramatically” alter outcomes, the expert claims.
Timmer’s observations include a potential impact of the SEC’s anticipated decisions on the Bitcoin spot Exchange Traded Fund (ETF). He theorizes that pending product applications could attract new investors, yet he remains cautious about whether this will trigger a “sell-the-news” event and a large drawdown.
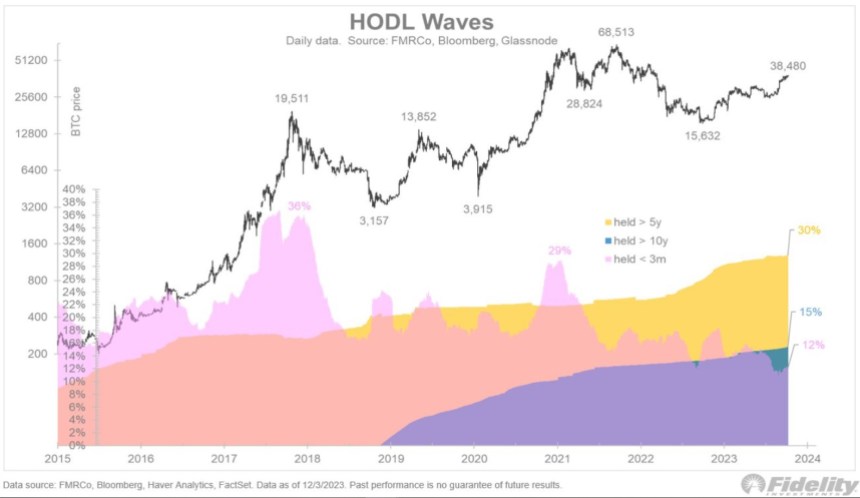
Interestingly, a small percentage of Bitcoin is held for under three months, suggesting that the recent price surge is not merely “speculative,” offering support for a longer bullish trend.
The true believers in Bitcoin, as indicated by the growing percentage held for over five or ten years, are unlikely to be swayed by short-term news. However, there is notable activity in the Bitcoin futures market, particularly among asset managers, which could suggest anticipation of the SEC movement.
Any updates from the SEC would arrive in a transformed macroeconomic environment. Unlike the liquidity-rich period of 2020-21, the US Federal Reserve’s (Fed) recent policy shifts have reversed the surge in monetary inflation.
This shift aligns the current situation more with the post-World War II era than the inflationary 1970s, impacting the urgency of the value proposition for gold and Bitcoin.
As BTC matures, its relationship with traditional financial markets and global economic trends becomes increasingly intricate. With the SEC’s decision and a shift in the macro-arena, the coming months are poised to exercise influence over the premier cryptocurrency and the nascent sector.
Cover image from Unsplash, chart from Tradingview
Bitcoin has encountered a critical resistance level going into the weekend and could move sideways following a massive rally. According to an expert, the cryptocurrency has been breaching every major obstacle, making it one of the best-performing assets.
As of this writing, Bitcoin (BTC) trades at $43,600 with sideways movement in the last 24 hours. Over the previous seven days, BTC recorded a 14% increase, with Ethereum following its footsteps, recording a 13% rally.
Jurrien Timmer, Director of Macro for Fidelity, offers insightful analysis of Bitcoin’s trajectory, likening it to “exponential gold.”
His thesis suggests that Bitcoin, much like its elder counterpart, gold, holds value in times of structural inflation, yet it boasts an added venture twist. In that sense, Timmer believes both assets are prime to capture attention from investors looking to protect themselves from “reckless monetary inflation.”
As seen in the chart below, if Bitcoin follows a similar trajectory to the previous, its price could target $100,000 and $1,000,000 by early 2025.
2020 was pivotal for Bitcoin and gold, with fiscal and monetary stimulus bolstering their appeal. However, Bitcoin differentiates itself with its capped supply of 21 million coins, contrasting gold’s continual but modest annual supply growth.
This limited supply has propelled Bitcoin’s “stock-to-flow” (S2F) ratio significantly higher than gold’s. Moreover, Bitcoin’s journey reflects the classic S-curve path of technological innovations. Its exponential growth trajectory mirrors historical trends in technology from railroads to cell phones.
However, predicting Bitcoin’s future based on these S-curves is complex, as slight deviations in these growth phases can “dramatically” alter outcomes, the expert claims.
Timmer’s observations include a potential impact of the SEC’s anticipated decisions on the Bitcoin spot Exchange Traded Fund (ETF). He theorizes that pending product applications could attract new investors, yet he remains cautious about whether this will trigger a “sell-the-news” event and a large drawdown.
Interestingly, a small percentage of Bitcoin is held for under three months, suggesting that the recent price surge is not merely “speculative,” offering support for a longer bullish trend.
The true believers in Bitcoin, as indicated by the growing percentage held for over five or ten years, are unlikely to be swayed by short-term news. However, there is notable activity in the Bitcoin futures market, particularly among asset managers, which could suggest anticipation of the SEC movement.
Any updates from the SEC would arrive in a transformed macroeconomic environment. Unlike the liquidity-rich period of 2020-21, the US Federal Reserve’s (Fed) recent policy shifts have reversed the surge in monetary inflation.
This shift aligns the current situation more with the post-World War II era than the inflationary 1970s, impacting the urgency of the value proposition for gold and Bitcoin.
As BTC matures, its relationship with traditional financial markets and global economic trends becomes increasingly intricate. With the SEC’s decision and a shift in the macro-arena, the coming months are poised to exercise influence over the premier cryptocurrency and the nascent sector.
Cover image from Unsplash, chart from Tradingview

Senator Elizabeth Warren isn’t leading the charge on this bill linking crypto transactions to terrorism — it comes from Senators Mitt Romney, Mark Warner, Mike Rounds and Jack Reed.
Senator Elizabeth Warren isn’t leading the charge on this bill linking crypto transactions to terrorism — it comes from Senators Mitt Romney, Mark Warner, Mike Rounds and Jack Reed.
Binance Co-founder and former Chief Executive Officer (CEO) Changpeng CZ Zhao, has been confined to remain in the United States in advance of his sentencing expected to take place next year.
The Binance co-founder has been ordered by US District Judge Richard Jones to remain in the country in a ruling on Thursday. Zhao was instructed to stay in the US due to the significance of his recent guilty plea.
The ruling read:
As relief, the government requests that Mr. Zhao be required to remain in the continental United States in the period between his plea and sentencing.
The Thursday ruling reversed an earlier decision that would have allowed Zhao to return to the United Arab Emirates (UAE). Jones acknowledged in his decision the arguments provided by Zhao, which ordinarily would result in the government’s motion being denied.
However, Jones highlighted the distinctive features of Zhao’s case. These include his riches, the absence of an extradition treaty with the UAE, and Zhao’s family living in the UAE.
Furthermore, the judge also highlighted that Zhao poses a flight risk if he were allowed to return to the UAE. This is due to the former CEO’s substantial assets and the meager connections he has to the United States.
Additionally, knowing that the Binance ex-CEO faces a potential 18-month sentence in prison also sparks a possible flight risk. Jones asserted that Zhao is asking for a lesser sentence, which might lead to 18 months of incarceration as indicated by the government.
The judge stated that despite promises that CZ wouldn’t flee if permitted to travel to the UAE, the court wasn’t convinced. This led to the order that he should remain in the US until his sentencing on February 23, 2024.
So far, the court stated in the ruling that its decision is not based on Zhao’s citizenship and alienage. “The risk of the defendant not showing up is posed by the circumstances surrounding their combined facts,” the court said.
Last Month, the former Binance CEO pleaded guilty and stepped down from the cryptocurrency exchange he founded about 6 years ago. Zhao’s plea to one count of violating the Bank Secrecy Act was formally accepted by Judge Jones.
Jones accepted the plea after a thorough consideration report and recommendation of the United States Magistrate Judge which found him guilty.
Jones wrote:
This Court, having considered the Report and Recommendation of the United States Magistrate Judge, to which there has been no timely objection, hereby accepts the plea of guilty of the defendant.
His plea was accepted just over two weeks after both he and Binance acknowledged a number of criminal and civil charges. These include failure to maintain an appropriate anti-money laundering program, running an unlicensed money transfer business, and violation of sanctions law.
The blockchain-oracle project’s “v0.2” staking program expanded the capacity to 45M LINK tokens from 25M, and the portion reserved for the community quickly filled up. The LINK token surged in price.
The XRP price is still underperforming the general crypto market raising concerns among holders. However, it is not all bad for the cryptocurrency which boasts of one of the strongest communities in the sector. As for its price, the optimism toward a recovery remains high as crypto analyst JD has given a rather bullish prediction for the altcoin’s price.
In his latest analysis of the XRP price, crypto analyst JD has pointed out a bullish formation that could bode very good news for the altcoin. According to him, the cryptocurrency has confirmed a rare Golden Cross on its 4-day chart, and historical performance points to an at least 700% increase following this.
JD’s chart shows what happened the last two times that the XRP price confirmed such a Golden Cross. The first was back in 2017 when the asset’s price completed the Golden Cross after a four-year trendline breakout. Following this, the XRP price would go on to rise 700% in short succession.
The next time that the Golden Cross appeared on the chart was back in 2020 just as the bull market was starting. This time around, there was a 1000% surge in the XRP price after this pattern was confirmed, mounting an even bigger rally than the previous occurrence.
If the XRP price sticks to this historical performance, then there could be an 800% increase, on average, for the price of the coin. However, if it also follows the trend of the most recent surge being higher than the last, the token could be looking at a more than 1000% increase, which would put its price above $6.
While JD’s analysis paints an incredibly bullish picture for the XRP price, the analyst also warns of a pullback in the price before the rally. Both times that the Golden Cross has appeared, the token’s price has seen a pullback before confirming the breakout.
In 2017, there was a 64% price correction before the 700% surge. Then again in 2020 when the Golden Cross appeared, there was a 40% price correction before the price rallied 1000%. So it stands to reason that there will be a pullback this time around before a rally begins.
Currently, XRP bulls seem to be waking up once again after a brief period of consolidation. The price broke out above $0.64 on Thursday, and the bullish trend is expected to continue as Bitcoin and the crypto market recovers.

Bitcoin traders are increasingly focusing on altcoins as BTC price action cools following the week’s vertical upside.
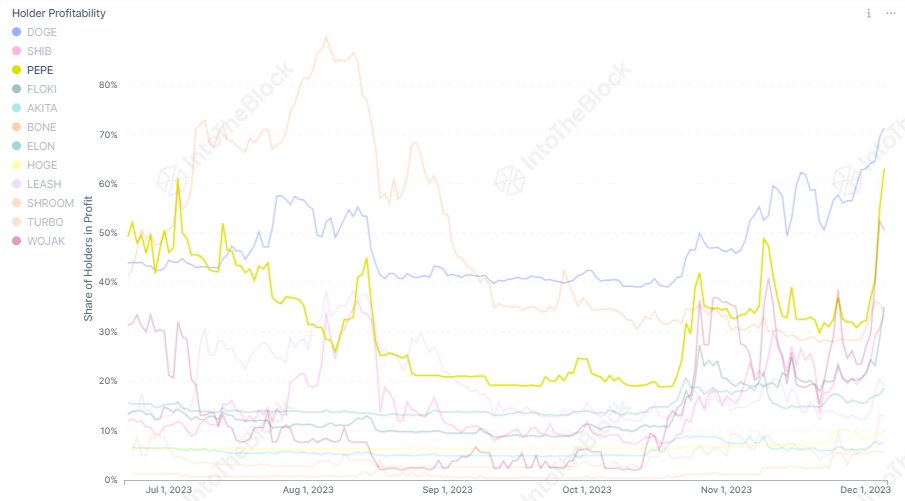
On-chain data shows 63.2% of all PEPE holders are now holding some profit. Here’s how this compares against DOGE, SHIB, and other memecoins.
According to data from the market intelligence platform IntoTheBlock, PEPE’s latest price surge of over 37% during the past week has meant that its holder profitability ratio has observed a significant jump.
The below chart shows how the percentage of the holders carrying some unrealized profit has changed for PEPE during the last few months and also how the same metric compares for the other meme coins in the sector like DOGE and SHIB.
Following this surge, around 63.2% of PEPE’s user base is holding their coins with positive returns. As is visible from the chart, the frog-based memecoin’s profitability ratio is now the second highest among these assets, above the likes of Shiba Inu and Floki.
Dogecoin still remains the top meme coin based on this metric, however, as more than 70% of its investors are in the green. The indicator’s recent surge has been slower for DOGE, though, so if PEPE can keep up its rise, it might overtake the original meme-based token.
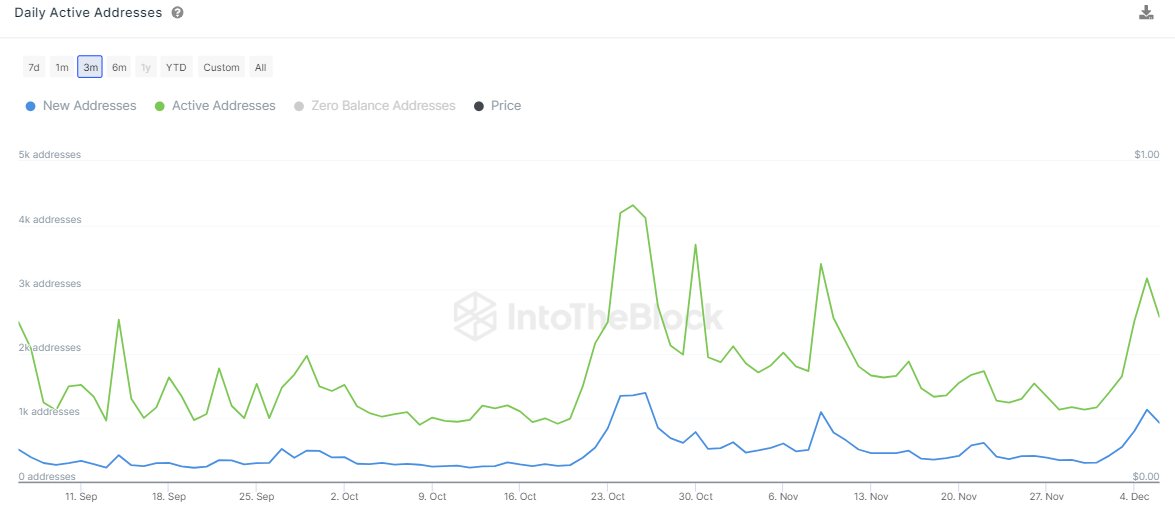
The profitability ratio isn’t the only indicator that has improved for the cryptocurrency recently, as IntoTheBlock notes, its active addresses have also registered a rapid increase.
The “active addresses” refer to those addresses that are taking part in some sort of transaction activity on the blockchain, whether as a receiver or sender. From the above graph, it’s apparent that the total number of active addresses has shot up for PEPE recently, a sign that investors have become quite active.
A high amount of users participating on the network is usually a positive sign for a rally’s sustainability, as it means that it might be able to keep itself fueled for longer. It’s usually a worrying sign when rallies take place, but activity drops instead.
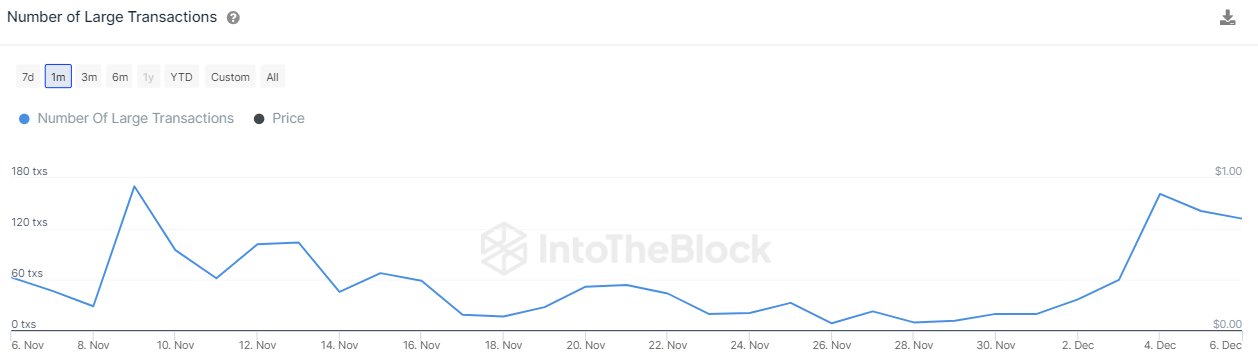
It’s not the case for this surge of the meme coin, of course, as user interest in the cryptocurrency has appeared to be high. It’s not just the regular investors that are showing interest in the asset, either, as the large transactions on the network have also observed significant growth recently.
The large transactions refer to those transfers that are carrying at least $100,000 in value. Not too long ago, there were just 10 such large daily transactions happening for the memecoin, but now the count has grown to more than 160.
Typically, such transactions are a sign of movement from the whales, so the indicator going up for PEPE suggests that these humongous entities also have an active interest in trading the coin currently.
After its recent rally, PEPE is now trading around the $0.00000151529 mark.

The possibilities for development on the Bitcoin network are expanding — and the BRC-20 ecosystem’s rapidly growing market cap reflects the new opportunities.

Bitcoin has been declared dead more times than you’d think amid downswings in the market, but it’s always managed to bounce back.
The market performance of Ethereum has been steadily rising since October, marking a positive and long-lasting trend. Increased buying activity has been the main driver of this positive momentum that has persisted over time, pushing the cryptocurrency beyond the vaunted $2,000 resistance mark and igniting a continuing rally.
The value of Ethereum has sharply grown as a direct result of this increased demand and market optimism, with its sights set on breaking through the crucial resistance region at $2,300. This upward trend serves as another evidence of the increasing investor trust and general bullishness surrounding Ethereum, thereby solidifying its place in the changing cryptocurrency market.
Ethereum, the second-largest cryptocurrency in the world, is rising quickly and has reached levels not seen in the previous 18 months. With a market valuation of $285 billion, ETH is now trading 5.7% higher at $2,375 as of the time of publication. Some speculators have even shared $3,000 price predictions for ETH amid the latest market breakout.
Ethereum’s approaching resistance level poses a huge challenge to buyers of the altcoin, including the fixed barrier at $2.5K, which has frequently shown to be a significant roadblock. But if the market is able to recapture this critical area, Ethereum may go on to reach the $2.5K – or even $3.000 — in the future.
As Ethereum breaks down further obstacles, investors and market watchers are keeping a close eye on the situation. A notable indication of the increased interest from institutional investors is the eagerness with which major players like VanEck, BlackRock, and Grayscale are awaiting clearance for Spot Ethereum ETFs.
According to Santiment, an on-chain data service, Ethereum has reached $2,349, its highest price since June 2022. The amalgamation of the positive long-term trend indicating a rise in wealth for the leading non-exchange whale wallets and a decrease in sell-off power for the leading exchange whale wallets presents a propitious situation for a steady upward trend.
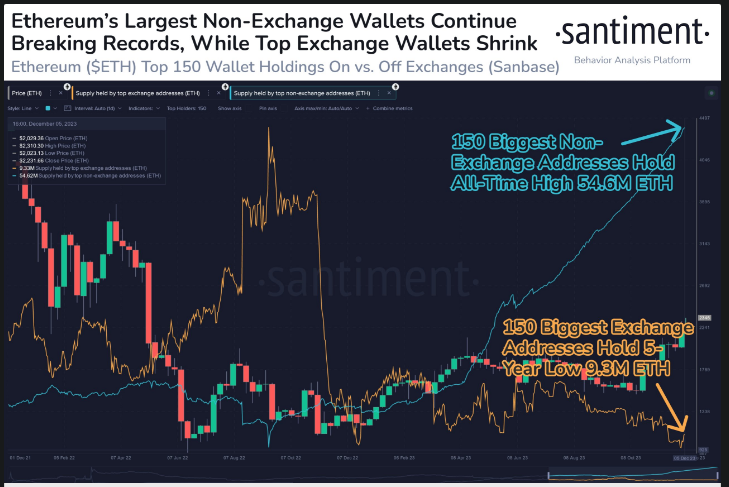
A recent tweet from Santinment highlights some intriguing variations in Ethereum’s wallet mechanics. Exchange wallets saw a five-year low of 9.3 million ETH, while top non-exchange wallets are building up to a record 54.6 million ETH. This move points to upward trends, with wealth building through non-exchange transactions and decreased selling pressure.
Over the course of two months, a bearish divergence between the price and the RSI indicator grew, pointing to a possible overvaluation of Ethereum at this point. Given the current characteristics of the market, even if buyers seem to be in charge and overall sentiment is bullish, there is a significant likelihood of a brief corrective phase that involves consolidation and higher volatility in the near future.
Meanwhile, a recent ACDE meeting provided information about the impending Dencun fork of Ethereum, which is set to occur in January 2024. The Goerli network testnet fork was well-prepared for by development teams, opening the door for a larger Goerli shadow network fork in the coming weeks.
ACDE#176 happened earlier today: we discussed the state of Dencun, timelines for testnets, and how to approach planning the following network upgrade
Agenda: https://t.co/ATVLQ7f9Xp
Stream: https://t.co/tDM0tDKxC5Recap below
https://t.co/PhGBkYxhYN
— timbeiko.eth
(@TimBeiko) December 7, 2023
By using proto-danksharding, Dencun is expected to greatly increase data availability for layer-2 rollups. This improvement should result in lower rollup transaction costs, which will eventually help end customers.
Dencun’s overall effects include rollups that increase Ethereum’s scalability, gas fee optimization, improved network security, and the deployment of several housekeeping upgrades.
As Ethereum’s price surges to surpass the $2,300 milestone, speculation intensifies about the cryptocurrency’s potential to reach the next significant threshold of $3,000. The recent upward trajectory reflects the market’s confidence in Ethereum’s underlying technology and its role in the evolving digital landscape.
(This site’s content should not be construed as investment advice. Investing involves risk. When you invest, your capital is subject to risk).
Featured image from Shutterstock

The regulator’s examination will assess whether the collaboration constitutes an “acquisition of control,” implying substantial influence of one party over another.
Bitcoin price corrected lower and tested the $42,800 support zone. BTC is now showing positive signs and might attempt a fresh surge above $44,000.
Bitcoin price started a downside correction below the $44,000 level. BTC declined below the $43,500 level, but the bulls remained active. The price found bids near the 50% Fib retracement level of the upward move from the $41,427 swing low to the $44,465 high.
Bitcoin is still trading above $42,800 and the 100 hourly Simple moving average. There is also a key bullish trend line forming with support near $42,900 on the hourly chart of the BTC/USD pair.
The price is now rising and showing positive signs above the $43,000 level. On the upside, immediate resistance is near the $44,200 level. The first major resistance is forming near $44,450, above which the price might gain bullish momentum and rise toward $45,000.
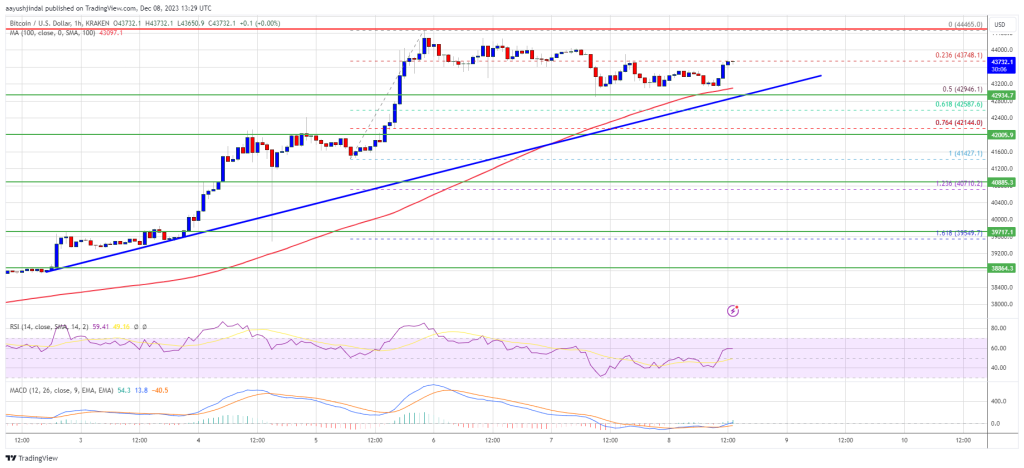
Source: BTCUSD on TradingView.com
A close above the $45,000 resistance might start a strong upward move. The next key resistance could be near $46,000, above which BTC could rise toward the $47,200 level.
If Bitcoin fails to rise above the $44,450 resistance zone, it could start another decline. Immediate support on the downside is near the $42,900 level and the trend line.
The next major support is near $42,580 or the 61.8% Fib retracement level of the upward move from the $41,427 swing low to the $44,465 high, below which the price might test the $42,150 zone. If there is a move below $42,150, there is a risk of more downsides. In the stated case, the price could drop toward the $41,500 support in the near term.
Technical indicators:
Hourly MACD – The MACD is now gaining pace in the bullish zone.
Hourly RSI (Relative Strength Index) – The RSI for BTC/USD is now above the 50 level.
Major Support Levels – $42,900, followed by $42,150.
Major Resistance Levels – $44,250, $44,450, and $45,000.
Anticipating a slowdown in the economy and easier Fed monetary policy, investors have sharply bid down interest rates in the weeks leading up to this morning’s numbers.

Comparisons of Google’s Gemini and OpenAI’s ChatGPT continue to flood internet social spaces, so we decided to put them to the test with questions of our own.