Newly-launched modular blockchain Celestia has experienced a slow start in terms of on-chain activity, but that hasn’t reduced the appetite of traders who have spurred a speculative rally to $6.30, 200% higher than when it debuted at around $2.10 two weeks ago.
Hong Kong Gaming Company Boyaa Interactive Seeks Approval to Buy $100M in Crypto to Boost Web3 Strategy
Boyaa Interactive unveiled plans this week to potentially buy up to $100 million worth of cryptocurrencies, mostly bitcoin [BTC] and ether [ETH] within a year.
‘Vitalik Slept On My Couch & Copied My Inventions’ Ethereum Insider Says
An Ethereum insider has made startling allegations against Ethereum Founder, Vitalik Buterin, stating that the Russian inventor had copied his creations.
Nerayoff Accuses Buterin Of Invention Replication
Former Ethereum Advisor, Steven Nerayoff has taken to X (formerly Twitter) to accuse Ethereum Founder, Vitalik Buterin of copying his inventions. Nerayoff criticized the intelligence of the current Ethereum leadership, making contentious remarks about Buterin and co-founder of Ethereum, Joseph Lubin.
“Vitalik slept on my couch & copied my inventions. He and SBF are images. They’re not smart because something seems off, something is off. The recording shows his and Joe’s stupidity and ignorance. Hear who understood Ethereum, me or them,” Nerayoff stated.
The former ETH Advisor continued on his tirade of allegations, casting doubts on Buterin’s contributions to the network. He stated that Buterin had never invented anything substantial and that the ETH founder was the sole reason behind the network never scaling.
The accusations also suggested that the only significant achievement in the Ethereum ecosystem was the issuance of utility tokens on ICOs, which Nerayoff claimed he had invented.
Nerayoff also made startling revelations, accusing Buterin and Lubin of deliberately damaging the cryptocurrency by focusing on issuing fraudulent ICOs to unsuspecting investors and potentially harming them.
“Did Vitalik invent anything? No, he did not. Ethereum never scaled bc of him. The only killer app was issuing Utility Tokens on ICOs, both of which I invented. Vitalik & Lubin sabotaged crypto. Their focus was merely to issue hundreds or thousands of fraudulent ICOs fleecing people,” Nerayoff stated.
Ethereum Founder’s Scalability Competence Questioned
In an X post on Tuesday, Stephen Nerayoff presented thought-provoking questions to the crypto community about Vitalik Buterin’s Ethereum scalability capabilities.
Nerayoff released a video on X by a community member, Mr. Huber which featured Vitalik Buterin describing plans for the ETH Network. He told the crypto community to remember the video when he eventually released evidential recordings of his conversation with Buterin about his ideas for ETH 2.0.
“Remember this video when I drop the recording and what I tell Vitalik about 2.0 and to fix misaligned incentive structures. Is Vitalik the savior they bill him as to make Ethereum scale or is he the reason it never scaled? Decide for yourselves,” Nerayoff stated.
The question raised by the former ETH Advisor has sparked debates and differing opinions about the Ethereum Founders. Although no proper evidence has been presented regarding the accusations laid against Buterin, the crypto community continues to watch and analyze the situation as it unfolds.
Layer 2 networks hit $13B TVL, but challenges still remain

Data from L2Beat shows that layer 2s are seeing greater adoption than ever before as users continue to desire lower gas fees.
Navigating the Next Wave of Crypto Institutionalization: A Due Diligence Primer
As FTX showed, operators in digital asset markets need to improve corporate governance standards. Here are the key components as the industry readies for another possible bull run.
What an SEC Proposal Means for RIAs in Crypto
The SEC’s Custody Rule requiring advisors to safeguard digital assets has big implications for advisors working in the crypto industry, says Nathan McCauley, CEO and Co-Founder of Anchorage Digital.
CBDCs Good for Payments, Even With Competition: IMF
The International Monetary Fund’s planned CBDC handbook offers guidance for policymakers on how to explore digital versions of sovereign currencies.
CFTC Chief: Nothing Changed After FTX Meltdown to Empower Agency to Prevent Repeat
U.S. regulators don’t have any more authority now to head off another major crypto collapse than they did when FTX imploded and took much of the industry with it, said Commodity Futures Trading Commission (CFTC) Chairman Rostin Behnam.
XRP Turn Around: Price Bounces Back Signaling Upward Trend
XRP experienced a significant decline over the past week due to unprecedented market whirlwinds. However, the crypto asset has regained bullish momentum from this dip, signaling an upward trajectory.
XRP Experiences Rebound After Plunge
XRP daily chart has shown resiliency recently, pulling off a noteworthy rebound following a drop that unnerved traders and investors. The chart shows that the cryptocurrency is speedily recovering from its fall.
The recent price movement indicates that XRP might be approaching the $0.70 mark. The token’s capacity to stay above the 50-day and 100-day moving averages indicates a bullish outlook for the asset.
According to the chart, XRP may be ready for a run at the next resistance level, around $0.65, if it can sustain above the $0.60 mark. If the token manages to go past $0.65, the $0.70 mark seems plausible.
These averages are significant pointers frequently pointing to the market’s long-term prospects. The fact that the price of XRP is rising above these lines indicates that the market is very confident.
In addition, the digital asset’s RSI has leveled off following a brief excursion into the overbought area. This suggests that the recent price rebound was sustained market interest rather than a fluke. The RSI returns to neutral levels without a notable price decline, sparking possible future growth.
XRP’s market is on an uptrend; the token seems to have benefited from these positive market emotions by raising its price. The price of XRP is growing and might keep rising, per a crypto analysis by ProSignalsfx on TradingView.
Nonetheless, the crypto asset is still relatively down from the $0.75 price mark it experienced on November 13. This was due to a false report shared by an X user about an exchange-traded fund (ETF) filing by BlackRock. However, the crypto experienced a price correction immediately after the report was debunked.
The Crypto Asset Is Set To Do Well In The Next Bull Run
According to crypto influencer BoringSleuth, since XRP has no ties to the Chinese Communist Party (CCP), its price could gain impressively from the bull market. The influencer believes cryptocurrencies not connected with the CCP will benefit from the next bull run.
“The protocols that weren’t in bed with the CCP will be the benefactors of future bull cycles. A protocol like DAG, which works with the DOD is one example of a well-positioned protocol. XRP is another,” he stated.
The crypto asset trades at approximately $0.639, indicating a 1.17% decline in the past 24 hours. Its market capitalization is currently at $34,288,273,612, indicating the same percentage decline in the past 24 hours, according to CoinMarketCap.
The Global Movement to Promote Crypto Tax Transparency — What You Need to Know
In Europe and the U.S., there are a host of initiatives placing new requirements on participants in digital asset markets to report on transactions and meet other new provisions.
Ethereum Could Decline To $1,700 Based On This Pattern, Analyst Explains
An analyst has explained how a pattern forming in the 3-day Ethereum chart could signal that a decline toward $1,700 may be coming.
Ethereum Has Recently Formed A TD Sequential Sell Setup
In a new post on X, analyst Ali talked about a sell signal that has taken shape in the ETH 3-day chart. The relevant technical indicator here is the “Tom Demark (TD) Sequential,” which is used to spot reversals in the price of any asset.
The metric is made up of two phases; a setup phase and a countdown phase. In the former, candles of the same polarity are counted up to nine following a reversal in the price. Once the ninth candle is hit, the indicator signals a probable top or bottom for the asset (depending on whether the trend until now was towards up or down).
Once the setup is completed, the 13-candle-long countdown phase begins. At the end of these 13 candles, a potential reversal once again takes place for the asset.
Ethereum has registered a sharp rally recently, but according to the analyst, the cryptocurrency has now finished with the setup phase of the indicator, implying that the asset could be heading towards a period of downtrend.
The below chart shows this pattern in the 3-day price of the coin:
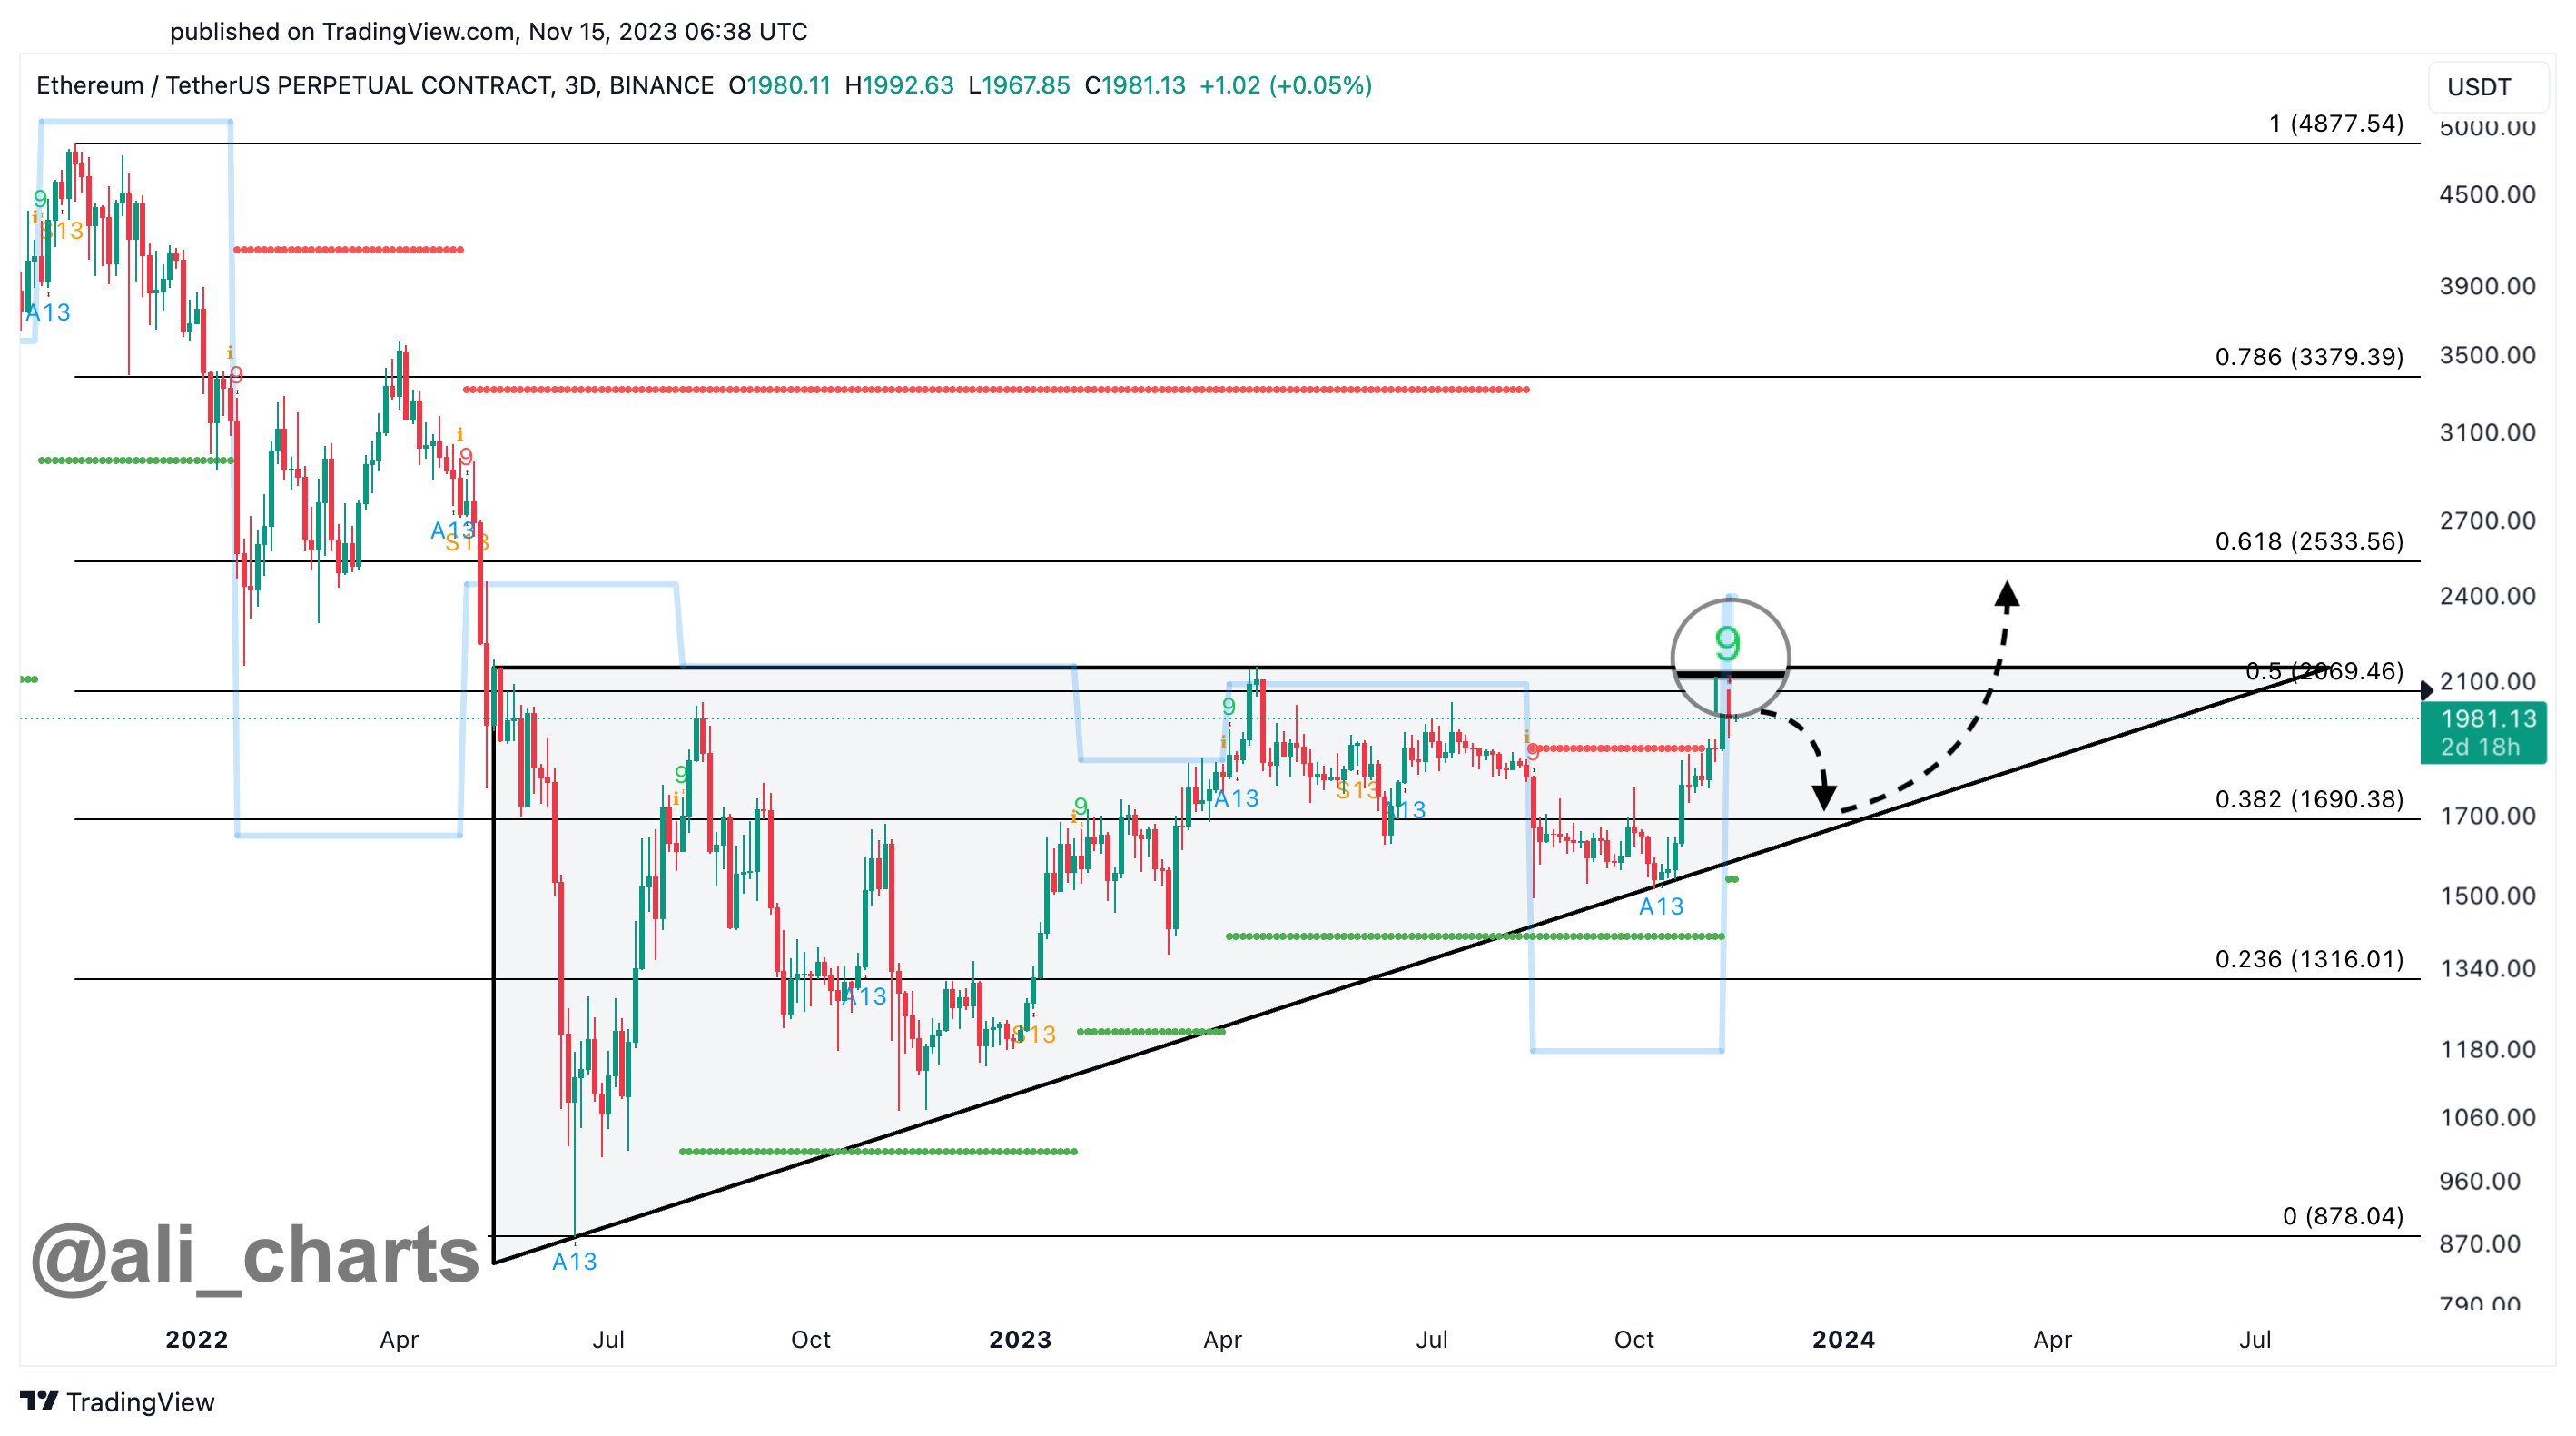
In the same chart, the analyst has drawn an ascending triangle pattern for Ethereum. “Ascending triangles” are made up of two lines: one parallel to the x-axis drawn through the highs in the price, while the other is made by connecting higher lows.
Generally, the price feels resistance at the upper line and support at the lower one. A break out of either of these lines suggests a continuation of the trend: bullish in the case of a surge above the former, while bearish in the case of the latter.
From the graph, it’s visible that Ethereum has recently been retesting the $2,000 to $2,150 zone, which happens to align with the resistance level of this ascending triangle.
Thus, it’s interesting that the ETH TD Sequential setup phase has finished just as the coin has encountered this line that it has been rejected from in the past.
“A pullback from this resistance level could lead to a dip toward the triangle’s hypotenuse at $1,700, setting the stage for a potential uptrend continuation,” explains Ali.
The analyst also notes, however, that the $2,150 level could be one to keep an eye on as if the asset can see a 3-day candlestick close above this level in the coming days, the bearish outlook could be nullified.
ETH Price
Ethereum had risen above $2,100 recently, but the coin has seen some pullback in the past day, a potential sign that the sell signal may already be in effect.
‘Intents’ Are Blockchain’s Big New Buzzword. What are They, And What Are the Risks?
Intent-centric programs are quietly transforming how we operate on blockchains, but they bring risks as well as benefits.
Tokenization Firm Superstate Gets $14M Investment to Bring Traditional Funds On-Chain
The company has earmarked the funds for expansion, creating private funds for institutional investors and crafting a framework for tokenized public funds that U.S. clients can access.
El Salvador Remains in the Red on Bitcoin Holdings, But Losses Are Narrowing
It’s been a bit more than two years since the country made bitcoin legal tender there.
Solana-Based Stablecoin Remittances Get a Boost with CFX Labs’ Fresh $9.5M Fundraise to Expand Globally
Remittances are one of the most compelling use cases for stablecoins, offering fast, non-stop settlements and cheap transactions using blockchains as payment rail.
Breaking into Liberland: Dodging guards with inner-tubes, decoys and diplomats

Visiting Liberland — a crypto micronation between Croatia and Serbia — required decoys and diplomatic immunity to dodge the border guards.
New York MoMA now has tokenized artworks in its permanent collection

The museum’s acquisition of two NFTs marked its first on-chain and AI holdings.
Lido DAO (LDO) New All-Time High? One Analyst’s Perfect Setup To $37
Lido DAO has grown over the years to become the leading liquid staking protocol on the Ethereum network and its native LDO token has enjoyed tremendous success on the back of this. The protocol’s continuous growth has been purported to be what will push LDO to new all-time highs and one crypto analyst has revealed how high the token’s price could go.
Lido DAO To Beat Previous $7.22 All-Time High
Back in the bull run of 2020-2021, the price of Lido DAO’s native LDO token soared with the rest of the market and eventually touched its all-time high price of $7.22. Naturally, this has been the level that bulls have been trying to get back to that would put all holders back in profit. However, crypto analyst Weslad expects the altcoin to completely clear this all-time high price by at least a 4x.
In an analysis posted on the TradingView website, Weslad reveals the roadmap for LDO’s price to rise another 1,400% from here. According to the analyst, the LDO/USDT has been showing a “robust ascending triangle pattern.” This pattern, the analyst says, suggests that LDO could move to test the Neckline which is a critical supply zone for the asset.
The analyst who is obviously very bullish on LDO expects that this level will be breached and that the altcoin will eventually turn this resistance mark into support. “The Buy back area on the chart should give all the bull an opportunity to accumulate the coin before major move begins and at same time the chart indicates the outlined target,” Weslad says.
The first target in this setup is already above its ATH price at $9.,176. From here, the analyst expects another bounce up to take the Lido DAO price above $15.9, double its previous all-time high. But it still doesn’t end here.
A final setup outlined by the crypto analyst brings the next target to $29.3. After that comes the coveted $37 level, which is at the very peak of this expected rally.
Just below the buy back zone at around $1.9, the analyst outlines a stop loss zone below $1.473. “The stop loss range is an important area that need to be watched closely should incase price turn around,” the analyst warns.
LDO Enters Top Gainers
The bullishness surrounding Lido DAO and the native token LDO is not without metric, especially given the token’s performance in the last week. LDO has seen its price rise approximately 27% in one week to breach the $2.47 mark.
Even more impressive is its 24-hour positive moves that have come out to 10.5%. This rise puts it in the list of the top 10 gainers in the last day behind the likes of Kaspa (KAS) and PancakeSwap (CAKE).
LDO’s large transaction volume has also fallen in the last week which suggests that whales are winding down their activities. While this could mean there is not a lot of buying going on by these large whales, it also suggests there is not a lot of selling happening either. This could point toward a tendency to hold and wait for better prices rather than selling tokens now.
Microsoft, Tencent and other tech giants join Decentralized Infura Network

Infura said the partnerships mark a major milestone in decentralizing and making its network more censorship-resistant.
Ethereum Platform Infura’s Step Toward Decentralization Includes Microsoft, Tencent
Infura, from the Ethereum developer ConsenSys, is so dominant that it’s been cast as a potential single point of failure. Now it’s creating a “decentralized infrastructure network” to help protect against outages – enlisting a “federated” group of partners.


