Shiba Inu Sees A Whopping 48,000% Increase In The SHIB Burn Rate, What’s Next?

The Shiba Inu community has again ramped up its SHIB burning efforts, causing a massive burn rate spike. Despite SHIB’s tumbling price in the past seven days, Shiba Inu’s burn rate has recorded a nearly 48,000% increase.

The SHIB community is determined to cut down the Shiba Inu circulating supply, a feat that many believe will positively impact the token’s price. 

SHIB Community Intensify Token Burn Efforts Following  Slight Decline

According to data from the Shiba Inu burn tracker, Shibburn, the SHIB burn rate has spiked 47,908% in the last 24 hours. The SHIB ecosystem swept 28.129 million SHIB tokens off circulation into the dead wallet on November 21. Over the past seven days, the SHIB burn rate has increased by 26.29%, with over 290 million tokens wiped off circulation.

According to Shibburn’s data, the most notable burn transaction was a whopping 28.15 million SHIB tokens transferred by an unknown address. The large number of SHIB tokens burned by the anonymous wallet attracted the attention of SHIB enthusiasts. Information on the SHIB burn tracking website shows that the burn transaction occurred 15 hours ago. 

In all these, the SHIB community has removed 410.66 trillion tokens from the initial SHIB token supply. As of writing, approximately 589.34 trillion coins remain as the total Shiba Inu token supply. Also, Shiba Inu’s circulating supply stands at ~580.4 million tokens.

The Shiba Inu community has long been working to reduce the meme coin’s enormous supply and introduce scarcity. Shiba Inu token burns are often sporadic, and some days may witness more token burns than others. Today’s massive increase comes after a 98.79% decline in the SHIB burn rate observed on November 20. 

According to Shibburn’s November 20 report, only 983,884 Shiba Inu tokens were burnt in three transactions. The highest burn transaction was one involving 42,850 SHIB tokens. This figure represented a significant decline from what was observed in the previous days.

Shiba Inu Price Outlook 

While members of the Shiba Inu community believe the token burn spree will positively impact SHIB’s price, the meme coin has followed an opposite trajectory. Its price has been in a downturn in the past week, with a seven-day decline of over 1%. As of the time of writing, Shiba Inu trades at $0.000008345, with a 4% 24-hour decline. 

SHIBUSD price chart

SHIB candles in the past week are below the median band of the Donchian Channel (DC), suggesting a possible decline ahead for the asset. If it drops to the lower band, then the bears may take full control of its price action and could facilitate more downturns. 

But the good news is that SHIB still holds nearly 20% of its past month’s gains. This could mean there is hope for a rebound since the market shows some bullish activity.

XRP Price: Cup And Handle Pattern Hints At Short-Term 208% Surge

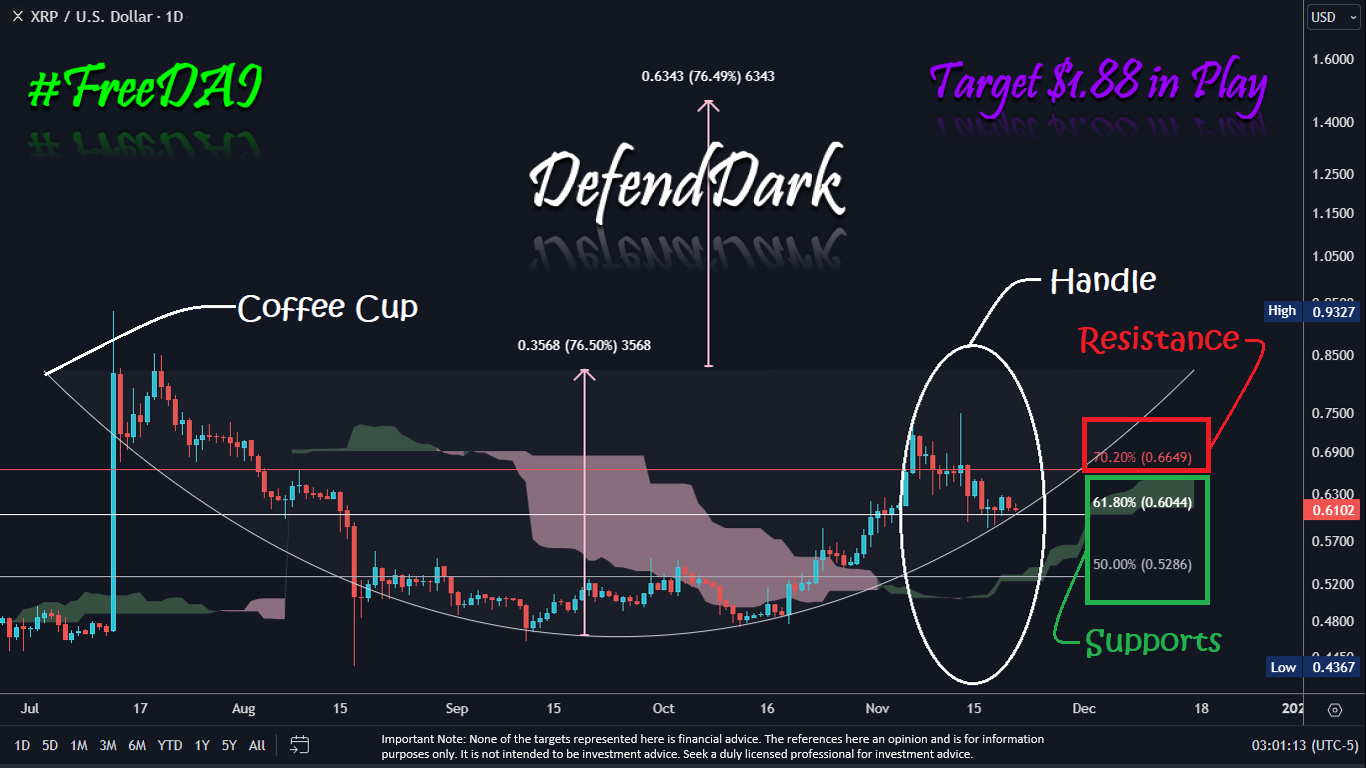
In a new technical analysis, crypto analyst Dark Defender has identified a bullish ‘Cup and Handle’ pattern on the XRP daily chart, signaling the potential for substantial gains. The pattern, which is characterized by a ‘cup’ resembling a rounding bottom and a ‘handle’ indicating a slight downward drift, suggests a continuation of an upward trend.

Dark Defender notes, “XRP formed a cup & handle pattern in the daily time frame. We set targets for $1.05 & $1.88 with the Elliott Waves, and now the Cup-Handle pattern is also blinking XRP to reach the targets.”

Cup & Handle Pattern Hints At 208% Rally In The Short-Term

The cup formation, which began in July and extended through October, saw its peak around $1.05, a critical resistance level. The XRP price then dropped by approximately 52%, perfectly aligning with the classical setup. The correction from the top of the cup to the bottom should ideally be a maximum of 50%.

The subsequent handle has formed a resistance zone between $0.75 and $0.6649, which is approximately a 20% retracement from the cup’s peak. Notably, the pattern suggests a bullish continuation, where the ‘cup’ represents a period of consolidation followed by a breakout, while the ‘handle’ forms a smaller pullback before the price continues to ascend.

XRP price analysis

Within the chart, Dark Defender showcases key support and resistance levels crucial for this pattern to remain valid. The handle part of the pattern has potential support at $0.5286, which Dark Defender has indicated should not be broken by a close under the primary support of $0.6044 for two consecutive days to maintain the bullish outlook.

Currently, the chart indicates that XRP is trading above these support levels, with resistance looming overhead. The next significant resistance is noted within the handle formation, marked at $0.6649. A decisive break above this level could confirm the pattern’s predicted outcome and set XRP on its upward trajectory toward the mentioned price targets.

The analyst elaborates on the handle’s potential movements, stating, “Can the handle be extended towards $0.5286 Support? We still need to close under the primary support of $0.6044 for 2 days in a row. So the answer at the moment is No.” However, he also added, “The main structure is still in place, and XRP is expected to hit $1.05 & $1.88 in the short term.”

XRP Price Faces Stiff Resistance

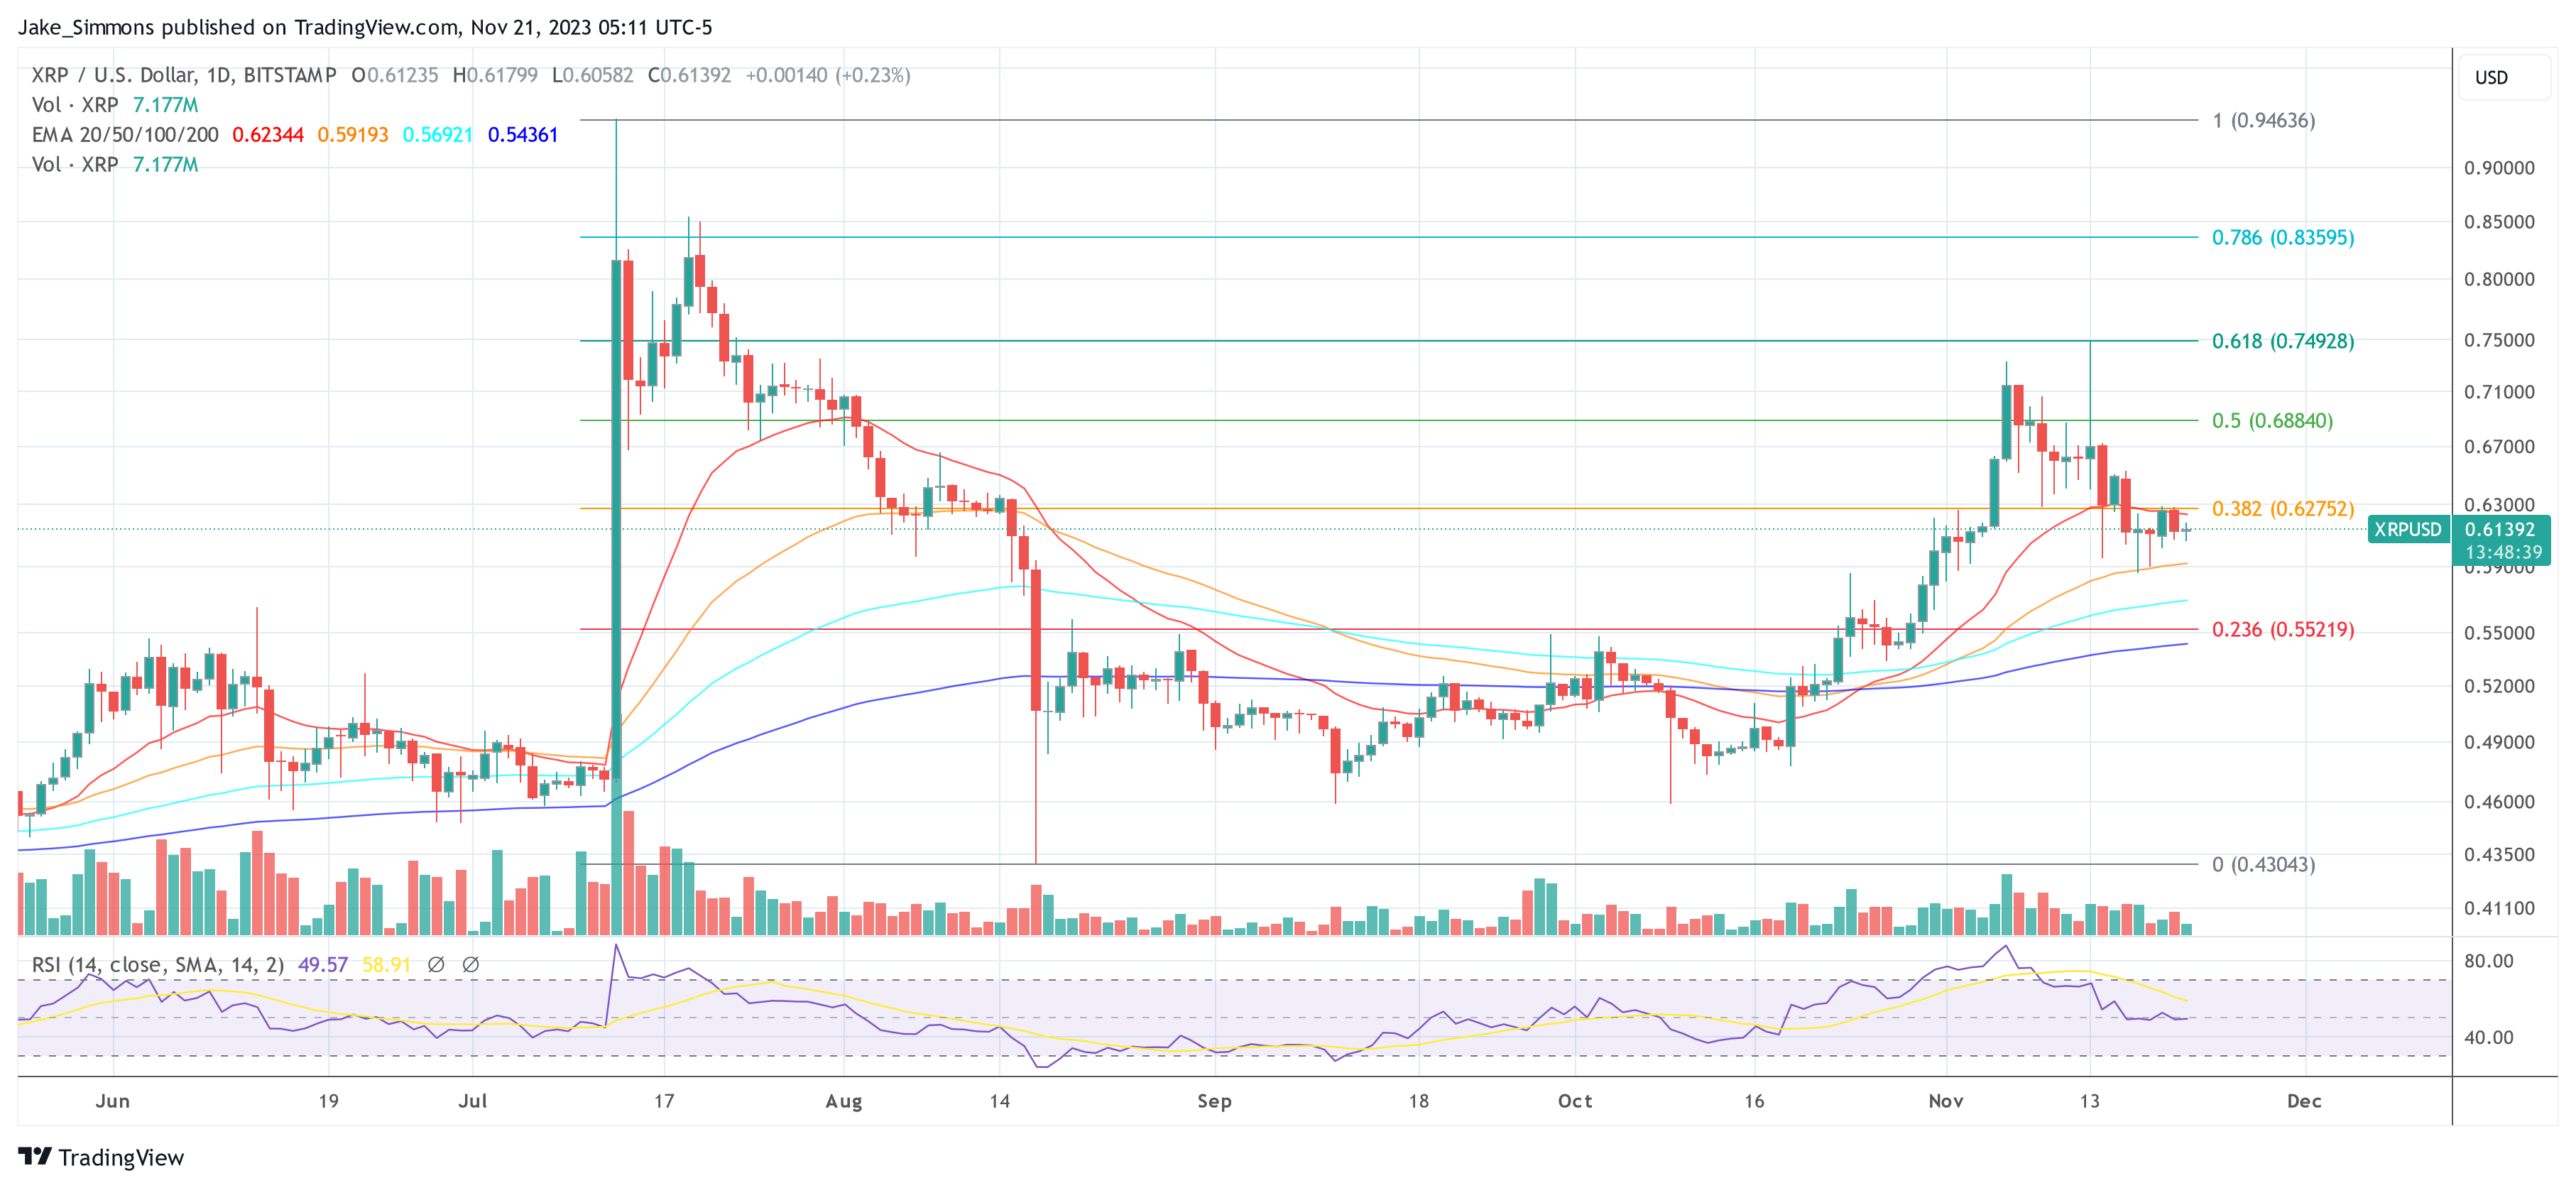
The XRP price is currently facing another crucial resistance when performing a Fibonacci retracement level analysis on the 1-day chart. Last Thursday, the XRP price fell below the 0.382 Fibonacci level at $0.6275 and has not been able to close above this key resistance since then on a daily basis.

Moreover, the XRP price is sandwiched between the 20-day and 50-day Exponential Moving Average (EMA), between $0.6234 and $0.5919. For the bullish scenario to play out, the price needs to overcome the 20-day EMA as well as the 0.382 Fibonacci level. If this happens, Dark Defender’s bullish prediction could come a little closer.

XRP price

Solana Captures Institutional Investors’ Attention, Inflows Rise To $135 Million

Solana has held its stance among altcoins, registering inflows more than any other cryptocurrency besides Bitcoin last week.  Institutional investment products have witnessed consecutive eight weeks of inflows, with some cryptocurrencies receiving a greater amount of inflows than others.

According to the new CoinShares report on digital asset funds, the majority of this money went into Bitcoin products as the crypto continues to attract investor interest in light of recent developments in the crypto industry. 

Solana Gains Momentum Among Institutional Investors

Solana has been on an incredible run this year, with its native SOL token up over 465% since the beginning of the year. At the same time, investment products tied to Solana have attracted major interest from institutional investors, with inflows now topping $135 million this year.

According to CoinShares, digital asset investment funds registered a total inflow of $176 million last week. Out of this total inflow, $155 million went into Bitcoin, with the last eight weeks of inflows now representing 3.4% of the total assets under management. As a result, the total inflow has now reached $1.32 billion this year, although well behind 2021 and 2020, which saw $10.7 billion and $6.6 billion respectively.

CoinShares’ latest report reveals that weekly inflow into Ethereum products dropped by an astounding 93.27% from $49.1 million to $3.3 million. Solana on the other hand, increased by almost 10% from $12.4 million to $13.6 million. 

Other altcoins also struggled to receive major inflows, with Litecoin and XRP only registering inflows of $0.4 million and $0.5 million respectively. Uniswap and Polygon saw minor outflows of $0.55 million and $0.86 million respectively. 

Factors Influencing The Inflow

Most cryptocurrencies went through a brief period of consolidation last week, but this didn’t roll over into investment products. The report from Coinshares attributes the inflows into Bitcoin in particular to a strong bullish sentiment related to the impending approval of a spot-based Bitcoin ETF in the US. This is particularly evident, as Short-Bitcoin outflows saw another outflow of $8.5 million last week.

Amid these influences and a 101% price surge last month, Solana has seen growth in other aspects of its ecosystem that may have attracted institutional investors. For one, Solana has delivered one of the most impressive performances on TVL in the most recent months. 

Data from DeFiLlama puts the total TVL on the network at $576.44 million, a 77.62% increase in the past month. The platform also revealed a spike in SOL trading volume on decentralized exchanges in the past week.

According to the on-chain intelligence platform Messari, Solana is now the hub for Decentralized Physical Infrastructure Network (DePIN) projects.

Solana (SOL) is currently trading at $56.27 with investors still anticipating a strong break above $60. 

Solana price chart from Tradingview.com (Institutional investors)

Bitcoin About To Smash The $38,000 Barrier – Decoding the Next Moves

Bitcoin (BTC) price reclaimed $37,000 on Monday as the crypto market started the week strongly and with investors regaining confidence in the market. On-chain analysis identifies the key reasons that could propel BTC prices higher this week.

Bitcoin was up 1.77% and was halfway to the vaunted $38,000 level at the time of writing, with its trading volume soaring 21% to a little over $14 billion. The recent gains in the crypto’s price have also helped it to erase some of its recent losses, as evidenced by a surge of around 0.55% in its price over the last seven days.

Anticipation Of Bitcoin ETF Nod

This increase is a reflection of the market’s rising hope for the US government to approve a spot Bitcoin exchange-traded fund. But the SEC is still on the fence, putting off judgments on many Bitcoin ETF proposals until 2024.

Bitcoin (BTC) continues to generate significant discussion on social media, despite the SEC failing to meet the designated eight-day timeframe for approving spot Bitcoin ETFs.

However, a recent explanation for the delays has emerged, suggesting that the financial regulator has shown a preference for cash-based creations of ETFs rather than cryptocurrency-based ones. It is also believed that the agency is actively communicating with exchanges over this matter.

Bitcoin Gets Price Lift From Milei Win

Bitcoin’s latest price ascent was in part driven by the election of Javier Milei, a politician who supports the adoption of bitcoin, as the President of Argentina.

Nevertheless, several traders caution about a potential market response subsequent to the disclosure of Federal Reserve meeting minutes on Tuesday, anticipating a period of reduced market liquidity towards the conclusion of the current business week.

Anticipations are high for a forthcoming week of notable activity within the cryptocurrency sphere, as discerned by market participants who foresee a series of events and announcements capable of influencing market trajectories.

Eminent eToro markets analyst, Simon Peters, underscored the imminent release of the Fed’s latest meeting notes, slated for tomorrow. Peters articulated the consequential nature of these minutes, portraying them as a conduit for acquiring profound insights into the prevailing perspectives of the central bank.

Against the backdrop of a decelerating inflationary trajectory, investors are particularly attuned to discerning further substantiation affirming the prospect that the present juncture may signify the culmination of peak interest rates.

What Lies Ahead For Bitcoin

This forthcoming week beckons vigilant attention as participants await the nuanced signals that may resonate throughout the broader landscape of the market.

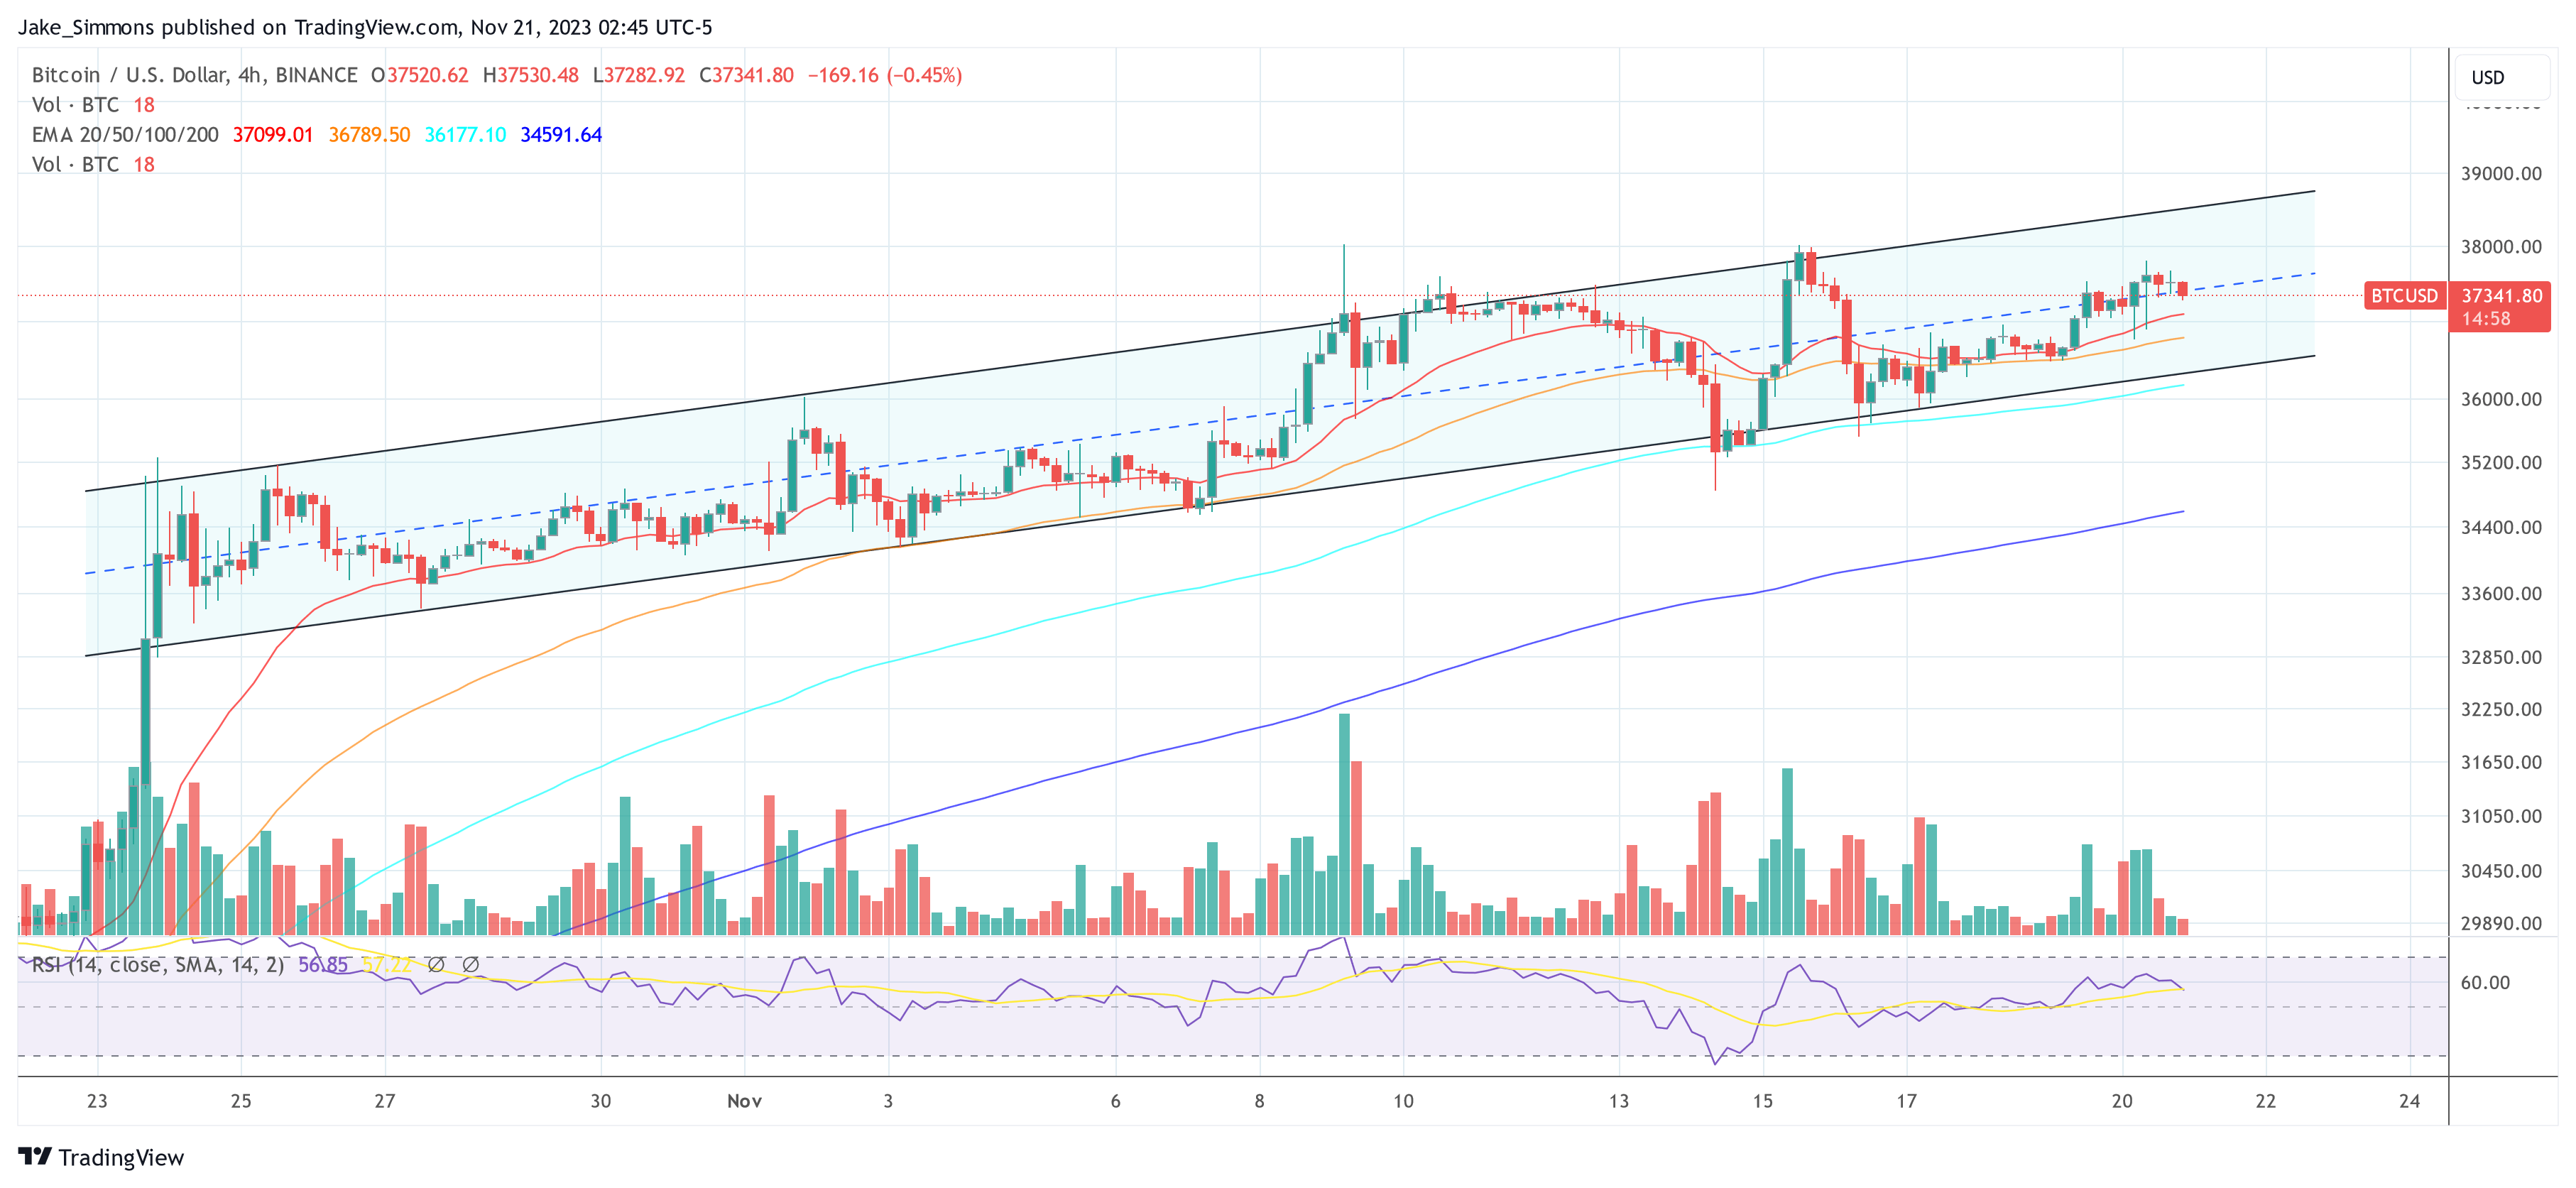
Meanwhile, based on a deeper look at the daily chart, it is evident that there is currently a bullish sentiment surrounding the price of Bitcoin as it approaches a critical resistance level. If the closing bar lines up close to that threshold, the impending test of this resistance level points to a possible breakout situation.

The excitement that is building up in this situation might be the impetus for a significant spike that takes the top altcoin’s price up to $39,000.

There has been a lot of excitement among market watchers due to this suggestive bullish momentum, which is the approaching challenge to the resistance level.

(This site’s content should not be construed as investment advice. Investing involves risk. When you invest, your capital is subject to risk).

Featured image from Freepik

Spot Bitcoin ETF Is ‘A Buy The News’ Event: Pantera Capital CEO

The potential approval of a spot Bitcoin ETF in the United States has stirred considerable attention in recent weeks. Dan Morehead, CEO and founder of Pantera Capital, has now shared valuable insights on this matter in his latest “Blockchain Letter”, emphasizing the unique circumstances surrounding this event.

Morehead challenges the traditional Wall Street mantra, “Buy the rumor, sell the news,” questioning its relevance in the current spot ETF context. He reflects on how this adage played out historically, specifically citing the CME Futures launch and Coinbase’s public listing. Both instances exhibited significant price surges in the BTC market before their respective events, followed by steep downturns, aligning with the adage’s prediction.

Spot Bitcoin ETF Is A “Buy The Rumor, Buy The News” Event

In his detailed analysis, Morehead recounts how the Bitcoin market rallied dramatically, up to 2,448%, leading up to the CME futures launch. However, this bullish trend abruptly reversed on the very day the futures were listed, marking the start of an 84% decline into a bear market. He parallels this with the Coinbase public listing scenario, where the market again surged, this time by 848%, reaching its peak on the day of Coinbase’s listing, only to be succeeded by a 76% drop.

Morehead, with a touch of humor, notes in his letter, “Will someone please remind me the day before the Bitcoin ETF officially launches? I might want to take some chips off the table.”

However, “this time is different,” states Morehead. Further delving into the potential impact of a spot ETF, he posits that such an ETF would represent a significant step in the adoption. Unlike futures, which he argues were a “step backwards,” the spot ETF could fundamentally change access to BTC, opening up new investor pools and potentially altering the demand function for Bitcoin permanently.

Unlike the previous events of the CME futures and Coinbase listing, which had little real-world impact on Bitcoin accessibility, Morehead believes the spot ETF scenario is fundamentally different. He asserts, “A BlackRock ETF fundamentally changes access to Bitcoin. It will have a huge (positive) impact.” His view is that the ETF will introduce BTC to broader investor classes, significantly altering the investment landscape.

Drawing a parallel with the history of gold ETFs, Morehead suggests that Bitcoin ETFs could similarly revolutionize Bitcoin investment, expanding its appeal and legitimacy. He predicts a substantial shift in the demand dynamics for Bitcoin, akin to how gold ETFs altered the gold market.

In his concluding remarks, Morehead revisits the initial question about the ETF launch being a “sell the news” event. He argues, “Buy the rumor, buy the news.” This phrase encapsulates his belief that, unlike past events, the introduction of a Bitcoin ETF will not lead to a sell-off but will mark the beginning of a new era in Bitcoin investment.

At press time, BTC traded at $37,341.

Bitcoin price