Binance Founder Ordered To Stay Put In The US In Ongoing Probe

Binance Co-founder and former Chief Executive Officer (CEO) Changpeng CZ Zhao, has been confined to remain in the United States in advance of his sentencing expected to take place next year.

Former Binance CEO No Longer Leaving The US

The Binance co-founder has been ordered by US District Judge Richard Jones to remain in the country in a ruling on Thursday. Zhao was instructed to stay in the US due to the significance of his recent guilty plea.

The ruling read:

As relief, the government requests that Mr. Zhao be required to remain in the continental United States in the period between his plea and sentencing.

The Thursday ruling reversed an earlier decision that would have allowed Zhao to return to the United Arab Emirates (UAE). Jones acknowledged in his decision the arguments provided by Zhao, which ordinarily would result in the government’s motion being denied. 

However, Jones highlighted the distinctive features of Zhao’s case. These include his riches, the absence of an extradition treaty with the UAE, and Zhao’s family living in the UAE.

Furthermore, the judge also highlighted that Zhao poses a flight risk if he were allowed to return to the UAE. This is due to the former CEO’s substantial assets and the meager connections he has to the United States.

Additionally, knowing that the Binance ex-CEO faces a potential 18-month sentence in prison also sparks a possible flight risk. Jones asserted that Zhao is asking for a lesser sentence, which might lead to 18 months of incarceration as indicated by the government.

The judge stated that despite promises that CZ wouldn’t flee if permitted to travel to the UAE, the court wasn’t convinced. This led to the order that he should remain in the US until his sentencing on February 23, 2024.

So far, the court stated in the ruling that its decision is not based on Zhao’s citizenship and alienage. “The risk of the defendant not showing up is posed by the circumstances surrounding their combined facts,” the court said.

Changpeng “CZ” Zhao’s Guilty Plea

Last Month, the former Binance CEO pleaded guilty and stepped down from the cryptocurrency exchange he founded about 6 years ago. Zhao’s plea to one count of violating the Bank Secrecy Act was formally accepted by Judge Jones.

Jones accepted the plea after a thorough consideration report and recommendation of the United States Magistrate Judge which found him guilty.

Jones wrote:

This Court, having considered the Report and Recommendation of the United States Magistrate Judge, to which there has been no timely objection, hereby accepts the plea of guilty of the defendant.

His plea was accepted just over two weeks after both he and Binance acknowledged a number of criminal and civil charges. These include failure to maintain an appropriate anti-money laundering program, running an unlicensed money transfer business, and violation of sanctions law.

Binance

XRP Price To Go Parabolic? Crypto Analyst Confirms 1000% Golden Cross Has Returned

The XRP price is still underperforming the general crypto market raising concerns among holders. However, it is not all bad for the cryptocurrency which boasts of one of the strongest communities in the sector. As for its price, the optimism toward a recovery remains high as crypto analyst JD has given a rather bullish prediction for the altcoin’s price.

XRP Price Confirms Golden Cross Fo 1000% Rally

In his latest analysis of the XRP price, crypto analyst JD has pointed out a bullish formation that could bode very good news for the altcoin. According to him, the cryptocurrency has confirmed a rare Golden Cross on its 4-day chart, and historical performance points to an at least 700% increase following this.

JD’s chart shows what happened the last two times that the XRP price confirmed such a Golden Cross. The first was back in 2017 when the asset’s price completed the Golden Cross after a four-year trendline breakout. Following this, the XRP price would go on to rise 700% in short succession.

The next time that the Golden Cross appeared on the chart was back in 2020 just as the bull market was starting. This time around, there was a 1000% surge in the XRP price after this pattern was confirmed, mounting an even bigger rally than the previous occurrence.

If the XRP price sticks to this historical performance, then there could be an 800% increase, on average, for the price of the coin. However, if it also follows the trend of the most recent surge being higher than the last, the token could be looking at a more than 1000% increase, which would put its price above $6.

XRP price chart from Tradingview.com

Beware The Pullback Before The Rally

While JD’s analysis paints an incredibly bullish picture for the XRP price, the analyst also warns of a pullback in the price before the rally. Both times that the Golden Cross has appeared, the token’s price has seen a pullback before confirming the breakout.

In 2017, there was a 64% price correction before the 700% surge. Then again in 2020 when the Golden Cross appeared, there was a 40% price correction before the price rallied 1000%. So it stands to reason that there will be a pullback this time around before a rally begins.

Currently, XRP bulls seem to be waking up once again after a brief period of consolidation. The price broke out above $0.64 on Thursday, and the bullish trend is expected to continue as Bitcoin and the crypto market recovers.

63.2% Of PEPE Holders Now In Profit: How This Compares With DOGE, SHIB

On-chain data shows 63.2% of all PEPE holders are now holding some profit. Here’s how this compares against DOGE, SHIB, and other memecoins.

PEPE Has Recently Woken Up With Fresh Rally And On-Chain Activity

According to data from the market intelligence platform IntoTheBlock, PEPE’s latest price surge of over 37% during the past week has meant that its holder profitability ratio has observed a significant jump.

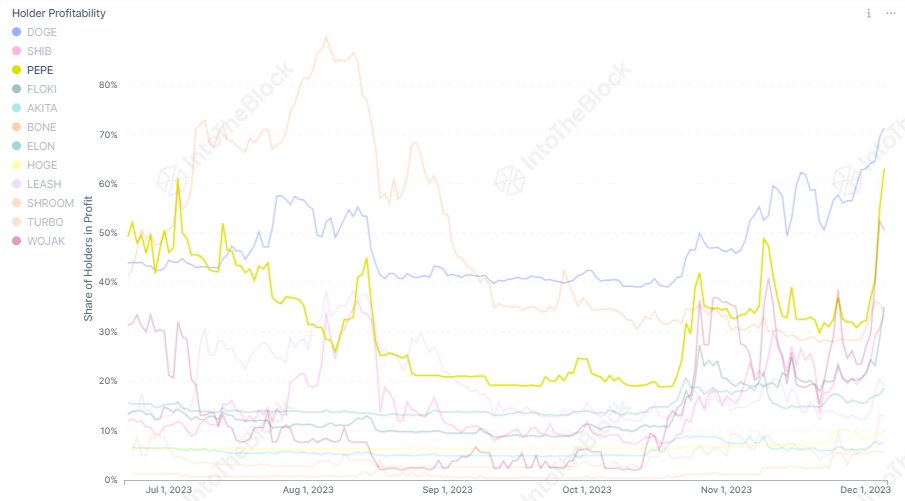
The below chart shows how the percentage of the holders carrying some unrealized profit has changed for PEPE during the last few months and also how the same metric compares for the other meme coins in the sector like DOGE and SHIB.

PEPE vs DOGE vs SHIB

Following this surge, around 63.2% of PEPE’s user base is holding their coins with positive returns. As is visible from the chart, the frog-based memecoin’s profitability ratio is now the second highest among these assets, above the likes of Shiba Inu and Floki.

Dogecoin still remains the top meme coin based on this metric, however, as more than 70% of its investors are in the green. The indicator’s recent surge has been slower for DOGE, though, so if PEPE can keep up its rise, it might overtake the original meme-based token.

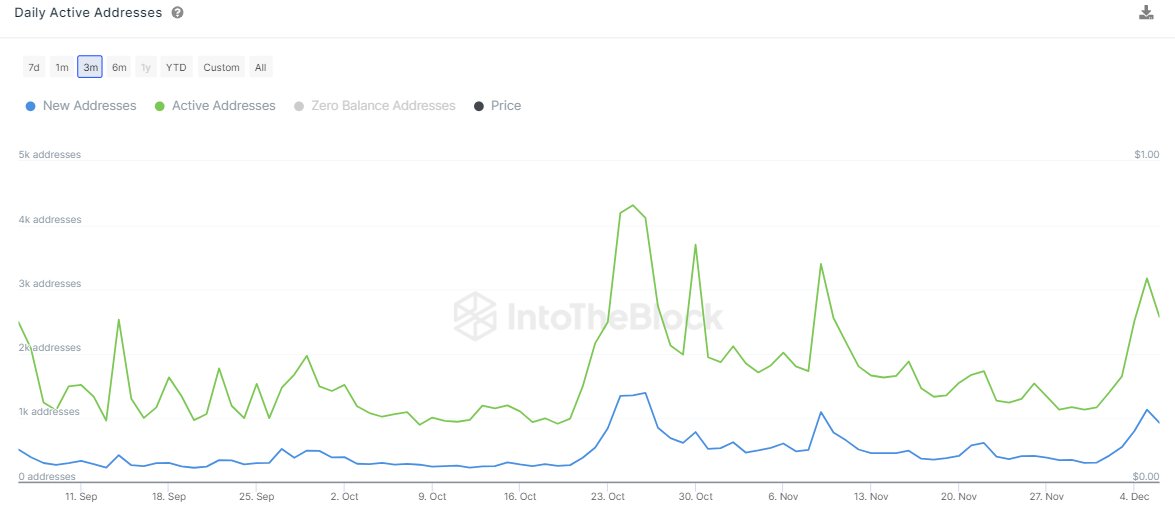
The profitability ratio isn’t the only indicator that has improved for the cryptocurrency recently, as IntoTheBlock notes, its active addresses have also registered a rapid increase.

PEPE Active Addresses

The “active addresses” refer to those addresses that are taking part in some sort of transaction activity on the blockchain, whether as a receiver or sender. From the above graph, it’s apparent that the total number of active addresses has shot up for PEPE recently, a sign that investors have become quite active.

A high amount of users participating on the network is usually a positive sign for a rally’s sustainability, as it means that it might be able to keep itself fueled for longer. It’s usually a worrying sign when rallies take place, but activity drops instead.

It’s not the case for this surge of the meme coin, of course, as user interest in the cryptocurrency has appeared to be high. It’s not just the regular investors that are showing interest in the asset, either, as the large transactions on the network have also observed significant growth recently.

PEPE Whale Transactions

The large transactions refer to those transfers that are carrying at least $100,000 in value. Not too long ago, there were just 10 such large daily transactions happening for the memecoin, but now the count has grown to more than 160.

Typically, such transactions are a sign of movement from the whales, so the indicator going up for PEPE suggests that these humongous entities also have an active interest in trading the coin currently.

Memecoin Price

After its recent rally, PEPE is now trading around the $0.00000151529 mark.

PEPE Price Chart

Ethereum Price Soars To Over $2,300 – Is $3,000 Next?

The market performance of Ethereum has been steadily rising since October, marking a positive and long-lasting trend. Increased buying activity has been the main driver of this positive momentum that has persisted over time, pushing the cryptocurrency beyond the vaunted $2,000 resistance mark and igniting a continuing rally.

The value of Ethereum has sharply grown as a direct result of this increased demand and market optimism, with its sights set on breaking through the crucial resistance region at $2,300. This upward trend serves as another evidence of the increasing investor trust and general bullishness surrounding Ethereum, thereby solidifying its place in the changing cryptocurrency market.

Ethereum Hits 18-Month Highs, Targets $3,000

Ethereum, the second-largest cryptocurrency in the world, is rising quickly and has reached levels not seen in the previous 18 months. With a market valuation of $285 billion, ETH is now trading 5.7% higher at $2,375 as of the time of publication. Some speculators have even shared $3,000 price predictions for ETH amid the latest market breakout.

Ethereum’s approaching resistance level poses a huge challenge to buyers of the altcoin, including the fixed barrier at $2.5K, which has frequently shown to be a significant roadblock. But if the market is able to recapture this critical area, Ethereum may go on to reach the $2.5K – or even $3.000 — in the future.

As Ethereum breaks down further obstacles, investors and market watchers are keeping a close eye on the situation. A notable indication of the increased interest from institutional investors is the eagerness with which major players like VanEck, BlackRock, and Grayscale are awaiting clearance for Spot Ethereum ETFs.

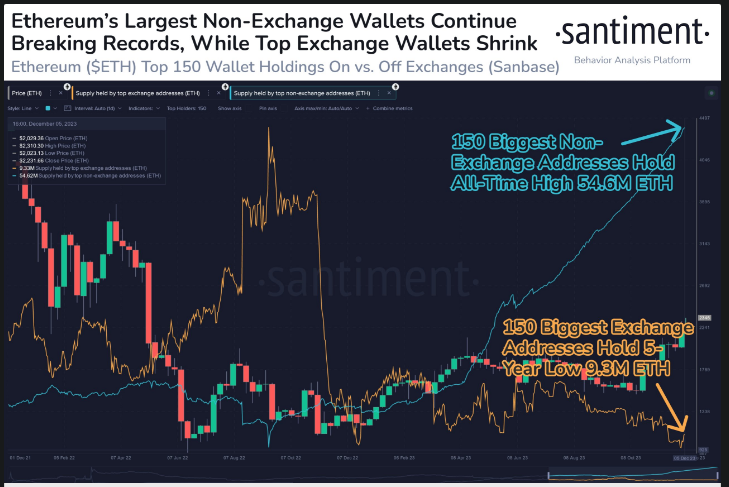
According to Santiment, an on-chain data service, Ethereum has reached $2,349, its highest price since June 2022. The amalgamation of the positive long-term trend indicating a rise in wealth for the leading non-exchange whale wallets and a decrease in sell-off power for the leading exchange whale wallets presents a propitious situation for a steady upward trend.

Ethereum’s Non-Exchange Holdings Surge To 55M ETH

A recent tweet from Santinment highlights some intriguing variations in Ethereum’s wallet mechanics. Exchange wallets saw a five-year low of 9.3 million ETH, while top non-exchange wallets are building up to a record 54.6 million ETH. This move points to upward trends, with wealth building through non-exchange transactions and decreased selling pressure.

Over the course of two months, a bearish divergence between the price and the RSI indicator grew, pointing to a possible overvaluation of Ethereum at this point. Given the current characteristics of the market, even if buyers seem to be in charge and overall sentiment is bullish, there is a significant likelihood of a brief corrective phase that involves consolidation and higher volatility in the near future.

Meanwhile, a recent ACDE meeting provided information about the impending Dencun fork of Ethereum, which is set to occur in January 2024. The Goerli network testnet fork was well-prepared for by development teams, opening the door for a larger Goerli shadow network fork in the coming weeks.

By using proto-danksharding, Dencun is expected to greatly increase data availability for layer-2 rollups. This improvement should result in lower rollup transaction costs, which will eventually help end customers.

Dencun’s overall effects include rollups that increase Ethereum’s scalability, gas fee optimization, improved network security, and the deployment of several housekeeping upgrades.

As Ethereum’s price surges to surpass the $2,300 milestone, speculation intensifies about the cryptocurrency’s potential to reach the next significant threshold of $3,000. The recent upward trajectory reflects the market’s confidence in Ethereum’s underlying technology and its role in the evolving digital landscape.

(This site’s content should not be construed as investment advice. Investing involves risk. When you invest, your capital is subject to risk).

Featured image from Shutterstock

Bitcoin Price Remains Strong and Eyes Fresh Surge Above $44K

Bitcoin price corrected lower and tested the $42,800 support zone. BTC is now showing positive signs and might attempt a fresh surge above $44,000.

  • Bitcoin is holding gains above the $42,500 pivot level.
  • The price is trading above $42,800 and the 100 hourly Simple moving average.
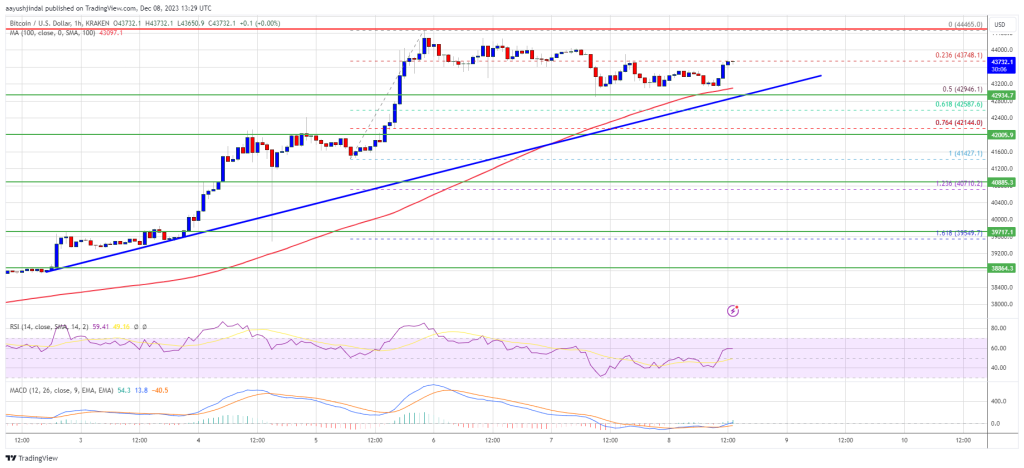
  • There is a key bullish trend line forming with support near $42,900 on the hourly chart of the BTC/USD pair (data feed from Kraken).
  • The pair is likely setting up for a fresh increase above the $44,000 level.

Bitcoin Price Eyes Fresh Increase

Bitcoin price started a downside correction below the $44,000 level. BTC declined below the $43,500 level, but the bulls remained active. The price found bids near the 50% Fib retracement level of the upward move from the $41,427 swing low to the $44,465 high.

Bitcoin is still trading above $42,800 and the 100 hourly Simple moving average. There is also a key bullish trend line forming with support near $42,900 on the hourly chart of the BTC/USD pair.

The price is now rising and showing positive signs above the $43,000 level. On the upside, immediate resistance is near the $44,200 level. The first major resistance is forming near $44,450, above which the price might gain bullish momentum and rise toward $45,000.

Bitcoin Price

Source: BTCUSD on TradingView.com

A close above the $45,000 resistance might start a strong upward move. The next key resistance could be near $46,000, above which BTC could rise toward the $47,200 level.

Are Dips Limited In BTC?

If Bitcoin fails to rise above the $44,450 resistance zone, it could start another decline. Immediate support on the downside is near the $42,900 level and the trend line.

The next major support is near $42,580 or the 61.8% Fib retracement level of the upward move from the $41,427 swing low to the $44,465 high, below which the price might test the $42,150 zone. If there is a move below $42,150, there is a risk of more downsides. In the stated case, the price could drop toward the $41,500 support in the near term.

Technical indicators:

Hourly MACD – The MACD is now gaining pace in the bullish zone.

Hourly RSI (Relative Strength Index) – The RSI for BTC/USD is now above the 50 level.

Major Support Levels – $42,900, followed by $42,150.

Major Resistance Levels – $44,250, $44,450, and $45,000.

Analyst Says Bitcoin Just Broke A Bullish Megaphone Pattern, What Are The Implications?

Bitcoin continues to maintain its bullish momentum even after some corrections following the breach above $44,000. Despite rising almost $15,000 in 30 days, the bullish sentiment has still not waned, especially among crypto analysts, who continue to expect more bullish strides from the cryptocurrency.

Bitcoin Breaks Bullish Megaphone Pattern

In a new analysis, crypto analyst TradingShot has referred to a peculiar pattern that the Bitcoin price has broken. According to the analyst, the crypto broke above a very bullish megaphone pattern, something that has been keeping the price muted for a while now.

As TradingShot explains, this megaphone pattern is important because it has been the pattern that has held Bitcoin back since it first made a local high on October 24. So a break out of this pattern is understandably very bullish for the price.

Bitcoin price chart from Tradingview.com

“The previous Bullish Megaphone of September – October technically served as a consolidation belt before the price broke upwards to deliver a +31.86% peak from the Megaphone’s last Higher Low and +40.50% from its first Low,” TradingShot said.

Breaking out of the megaphone pattern suggests that there is more upside to come. If it goes as expected, then the crypto analyst believes that the BTC price could still make another move toward the $48,000 price target.

A Likely Path For BTC Price

The next stop for Bitcoin now would be to clear the $45,000 resistance which has remained elusive. However, this may soon be a problem of the past going by TradingShot’s analysis which suggests a breakout is on the horizon.

“The ROC shows a similar behavioral structure between the two patterns. If it continues this way, then a new +31.50% leg will make a perfect contact on 48220, which is the March 28 2022 High,” the crypto analyst explained.

They further add that this is “essentially the Bear Cycle’s first Lower High and a key Resistance level of the current Bull Cycle.” Given this, “Technically, as long as the 1D MA50 (blue trend-line) holds (has been doing so since Sep 28), that is a realistic end target for this bullish wave.” TradingShot stated.

Another crypto analyst known as Tony The Bull seems to be on the same bullish trend. In a Wednesday analysis, Tony reveals that “the green stair-stepping TDST support in Bitcoin hasn’t been broken since 2018.” As the analyst explains, the same primary bullish trend continues to apply even now.

“IMO, we are dealing with the same active primary trend, much more advanced and mature than anyone is expecting – hence why we are already lifting off while others wait for the halving,” Tony explained.

Bitcoin price chart from Tradingview.com

Bitcoin Price Dips To $43,200: Buy Or Sell Now? Analyst Predicts Trend

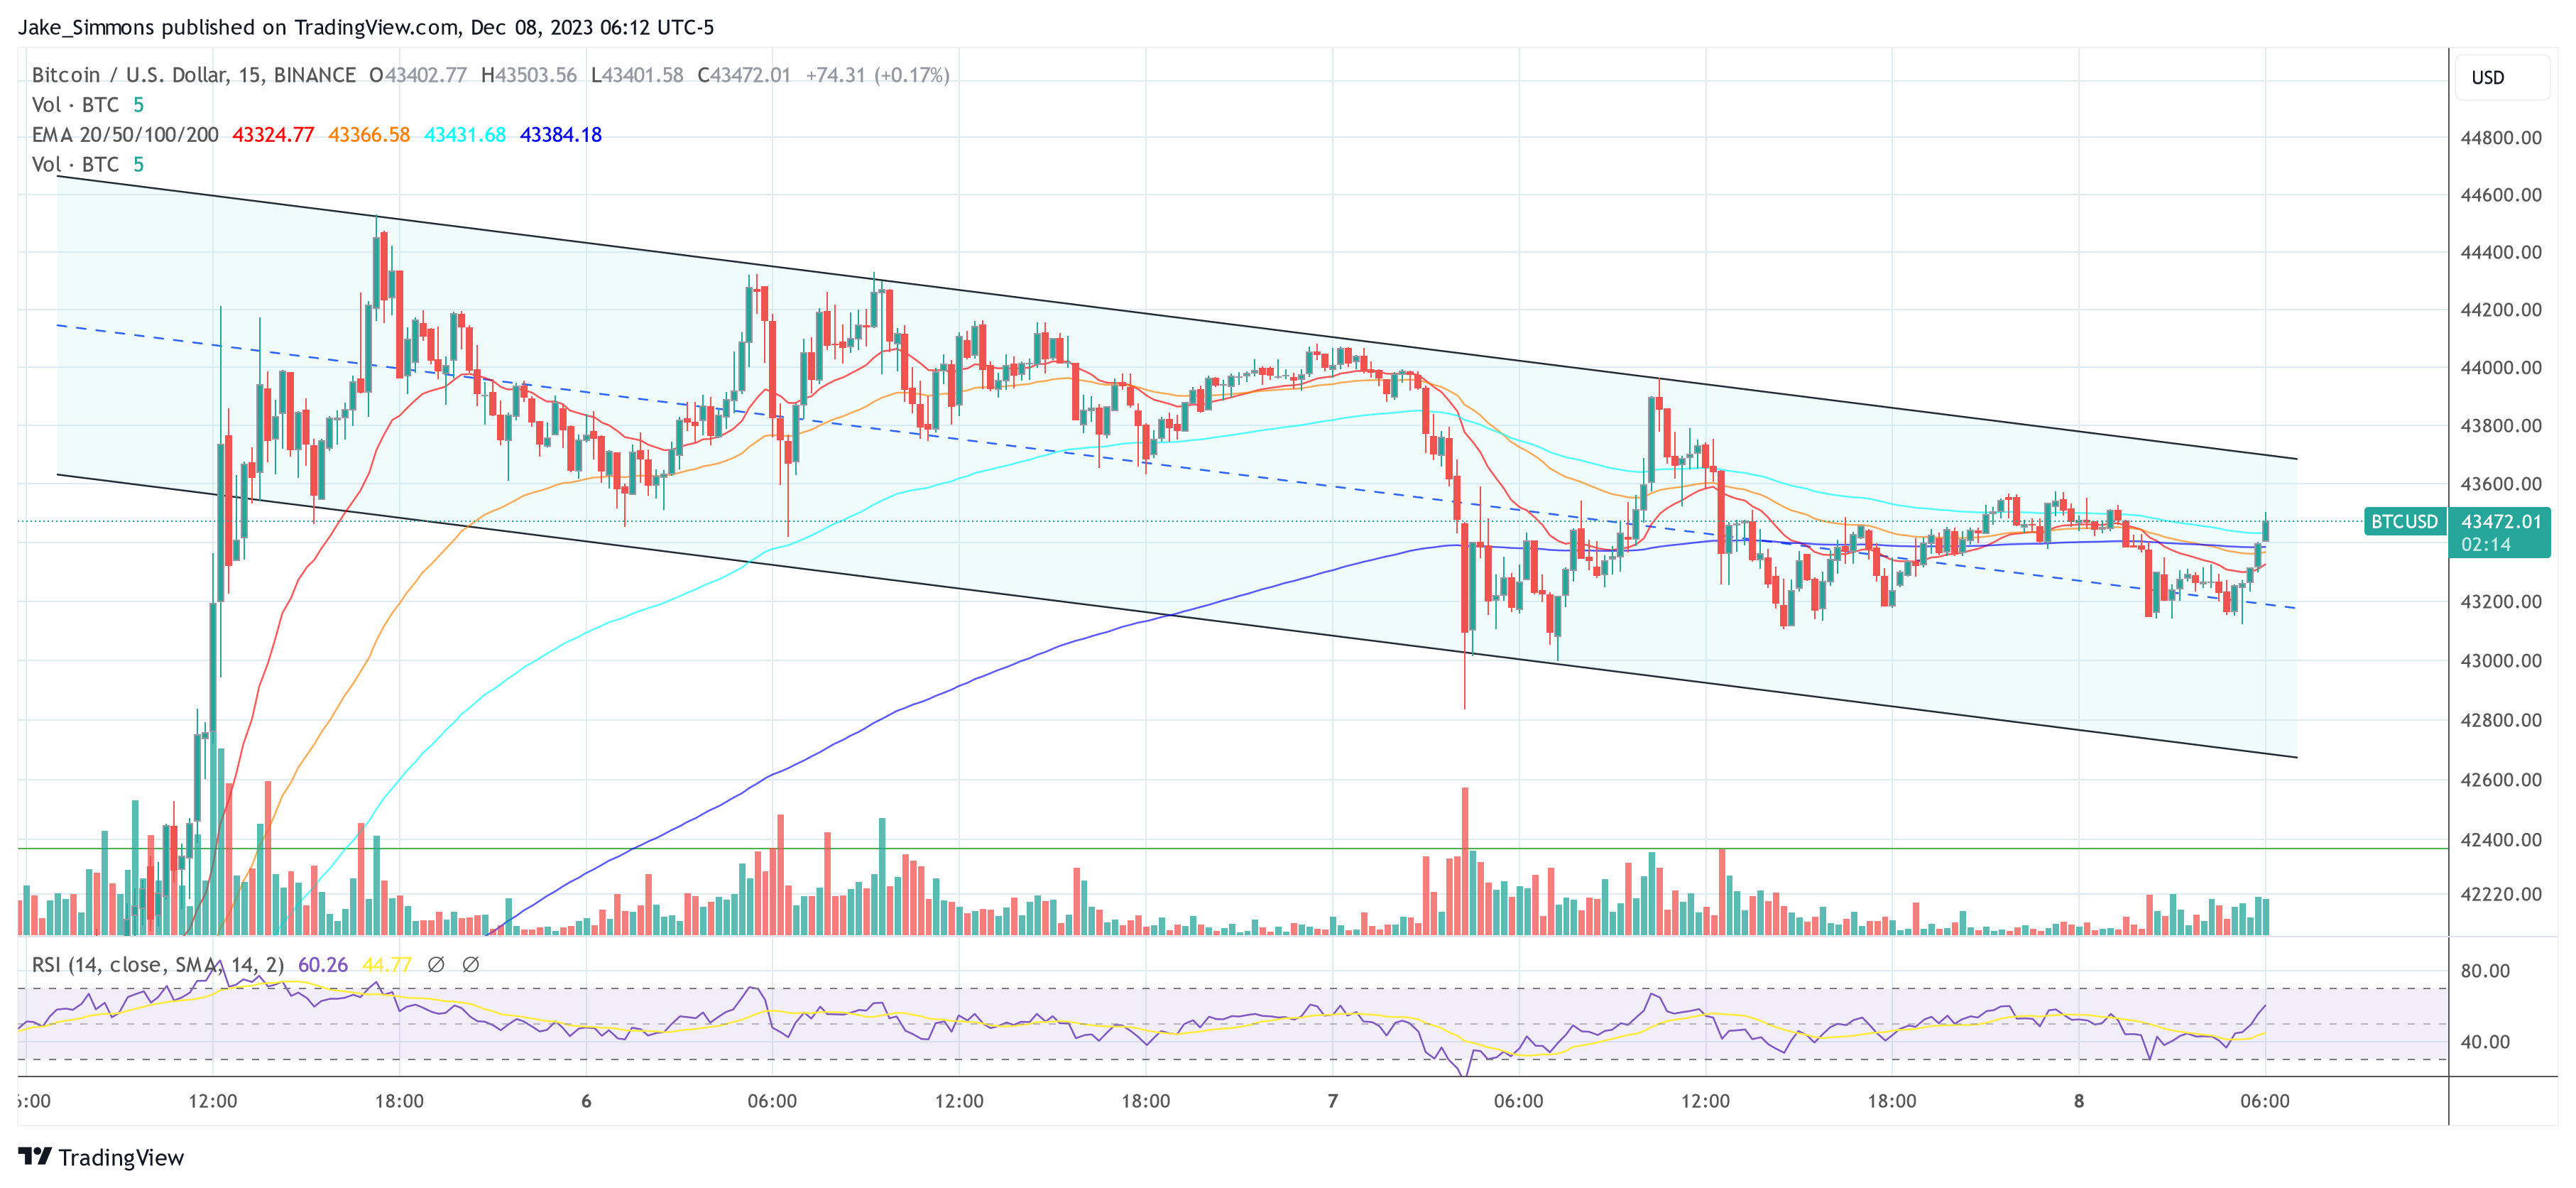
Amidst a week of significant volatility in the cryptocurrency sphere, the Bitcoin price has been a focal point, especially following a dip below $43,200 today. After climbing to $44,533 on Tuesday, the price has since entered an ascending channel, touching a local low of $42,835 on Thursday.

This trend has sparked a critical debate: is this a sign of an impending major correction following Bitcoin’s 65% rise in the past seven weeks, or is it a temporary bear trap in a continuing bullish market? Adam Cochran, partner at CEHV, has offered an in-depth analysis of the current Bitcoin market situation.

Bitcoin Price Poised For Further Downside?

Via X, Cochran began by assessing the market’s reaction to the recent price dip, “I was trying to decide if we were at ‘euphoria’ yet and due a major correction versus a mild pullback. But on this pullback, too many people went from ‘wgmi’ to ‘take money off the table’. In real euphoria, people just yolo every dip. This looks healthy + bullish.”

This observation indicates that the market’s response to the price dip is not indicative of the ‘euphoria’ typically seen before a major market correction, suggesting a more stable and bullish sentiment. Further, Cochran delved into the intricacies of the futures market, noting the increase in Open Interest (OI) on the Bitcoin side and the decreased basis, signifying a move towards market equilibrium.

He elaborated “On the BTC side, OI has increased while the basis has decreased, meaning the market has come a bit more towards equilibrium on futures.” This is a significant indicator of the market’s health.

Cochran also examined the relationship between perpetual futures prices and spot prices. He remarked, “We’ve also got the perpetual futures price trading a bit above spot, which we’d expect, and it’s not overly optimistic – which is healthy.” This indicates a cautiously optimistic market, avoiding the extremes of pessimism or irrational exuberance.

In his analysis, the crypto analyst also emphasized the potential impact of Spot Exchange-Traded Funds (ETFs) on the market. He asserted, “Bitcoin is limited. Bitcoin futures are not. At the end of the day, 1 BTC > 1 BTC Perp.” This highlights the significance of the finite nature of Bitcoin compared to the more flexible futures market. The introduction of ETFs, which are required to buy spot Bitcoin, could significantly affect market liquidity and dynamics.

The Most Important Bit Is What’s Missing

Cochran claims that the pre-rally started with healthy buying between $16,000 to $18,000 support, then the rally got fueled by “bears being destroyed” and extended by refreshed spot buying, while earlier buyers did not distribute their coins.

“But the most important part is actually what’s missing,” according to Cochran, who added “ETF buyers haven’t started buying yet. Retail buyers haven’t started buying yet. BTC didn’t break below the $42k support. BTC, a nearly $1T asset, is up 157% on the year, and retail inflow hasn’t even started yet.”

These observations indicate that the Bitcoin rally has potentially much more fuel in the tank left. Cochran concluded:

Imagine this: Next year Boomers sit down with their financial planner. They look at their 60/40 portfolio with a 5 year performance of 5%. They’ve just read about Bitcoin up 157% on the year nearing ATHs. Why wouldn’t they diversify 1% into this new BTC ETF? […] My hunch is even at these levels, any spot buying will be deeply in the money this time next year.

In the short term, however, one thing is crucial: the BTC price must break out of the ascending trend channel in the lower time frames in order to trigger new upward momentum.

Bitcoin price