The total value of all assets locked on decentralized finance (DeFi) protocols has surged to a three-month high of $42 billion after being at its lowest point since February 2021 just two weeks ago.
XRP Price Breakout Soon? Analyst Points To Bullish Structural Signs
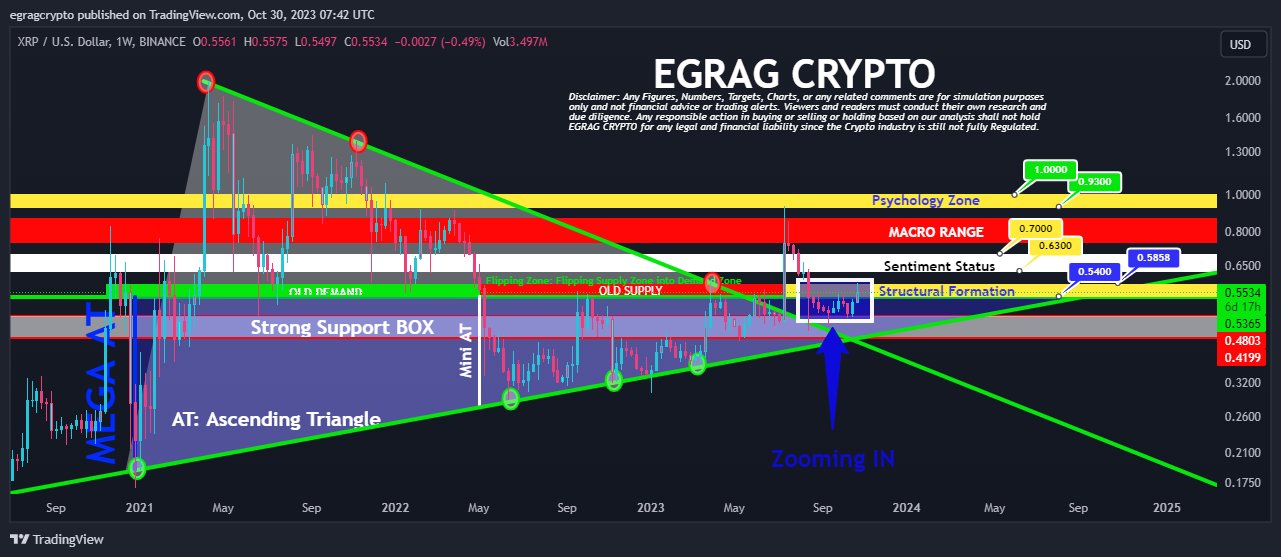
In a detailed analysis shared on social media today, renowned crypto analyst Egrag points to several bullish indicators in the XRP price structure, suggesting the potential for an imminent breakout. Egrag evaluated various timeframes, identifying a series of technical patterns and formations that bolster the bullish outlook.
XRP Shows Strong Bullish Structural Signs
“Last week’s candle closed within the confines of the Yellow structural formation,” Egrag tweeted with regard to the weekly XRP/USD chart, emphasizing the significance of recent movements within the timeframe. This observation is instrumental in understanding the underlying market structures influencing the upcoming price action.
The implication? If another weekly candle were to affirm its position within this formation, the odds of a bullish trend continuation could significantly increase. “To confirm a bullish trend continuation, we need to see another weekly candle close with a full body inside this structure,” Egrag added.
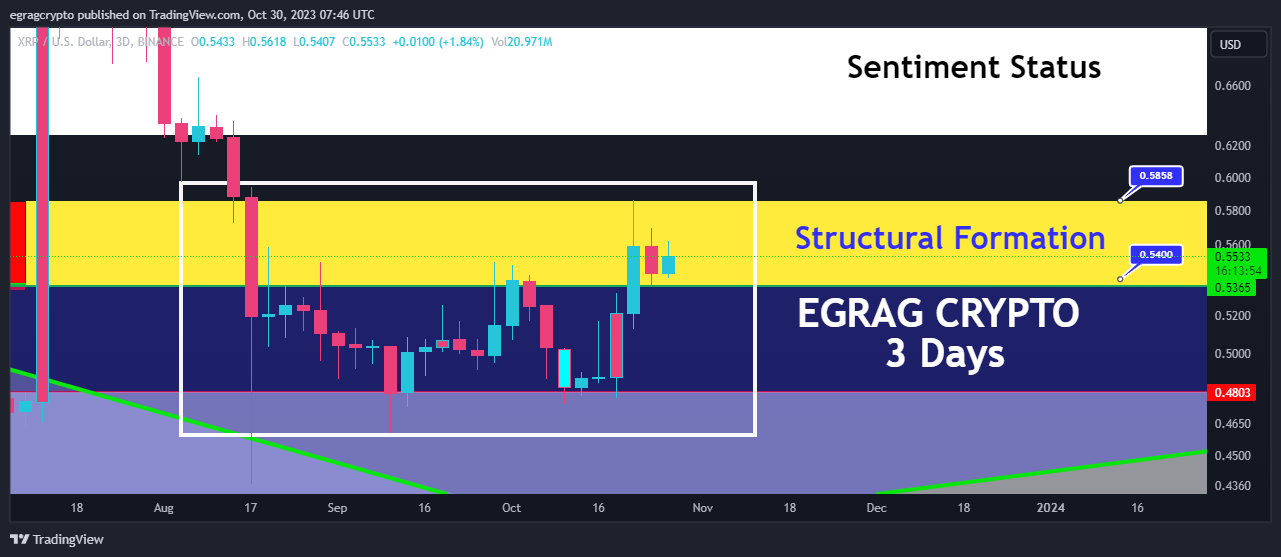
Next, his insights extend further to the three-day chart, where he keenly observes, “In just 16 hours, XRP is poised to complete the second full body candle within the structural formation, signaling a strong bullish sentiment.” This near-term projection underscores a sense of momentum that appears to be building within the XRP market.
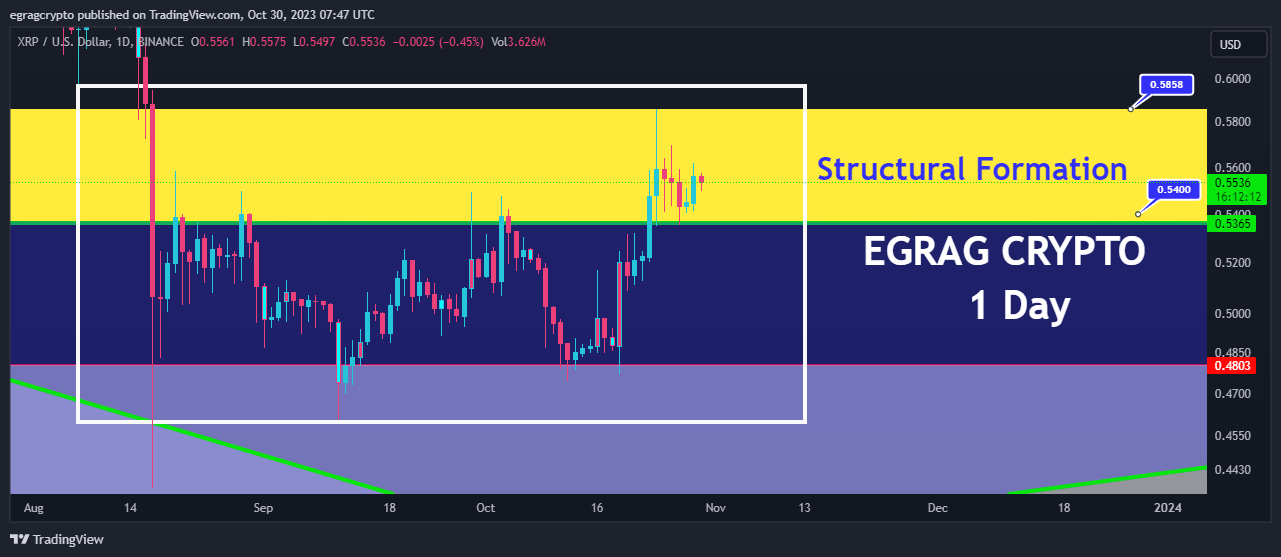
The 1-day chart, too, garnered Egrag’s scrutiny. He highlighted the imminent completion of the seventh full-body candle within the current structure, stating this indicates an “extremely bullish trend.” This observation suggests that XRP’s bullish behavior isn’t just a fleeting phenomenon but has consistency across varying timeframes.
For traders with a penchant for shorter timeframes, Egrag’s insights into the 12-hour chart are particularly salient. While there have been multiple closures within the structural formation, he singled out the importance of the ongoing momentum: “The current candle and the next one are pivotal as they form a symmetrical triangle.”
He elaborated on the implications of this pattern, saying, “Typically, symmetrical triangle breakouts have a 50/50 chance, making this a decision point for XRP.”
XRP Price Targets
Circling back to a tweet from October 27, Egrag had demarcated significant price zones, highlighting the “$0.54 to $0.58” range as a make-or-break threshold. Beyond this, he indicated the “$0.63-$0.70” range as a pivotal indicator of market sentiment shifts.
For those with an eye on the psychological dimensions of trading, Egrag’s mention of the “0.93-$1” bracket is noteworthy. He cautioned traders about this zone, advising them to “Stick to your plan and resist the temptation to let emotions or impatience dictate your actions.”
In sum, Egrag’s comprehensive analysis blends technical data with trader sentiment and psychology, providing a nuanced and detailed perspective for those invested in XRP. The coming days are likely to be watched with bated breath as traders anticipate the next big move.
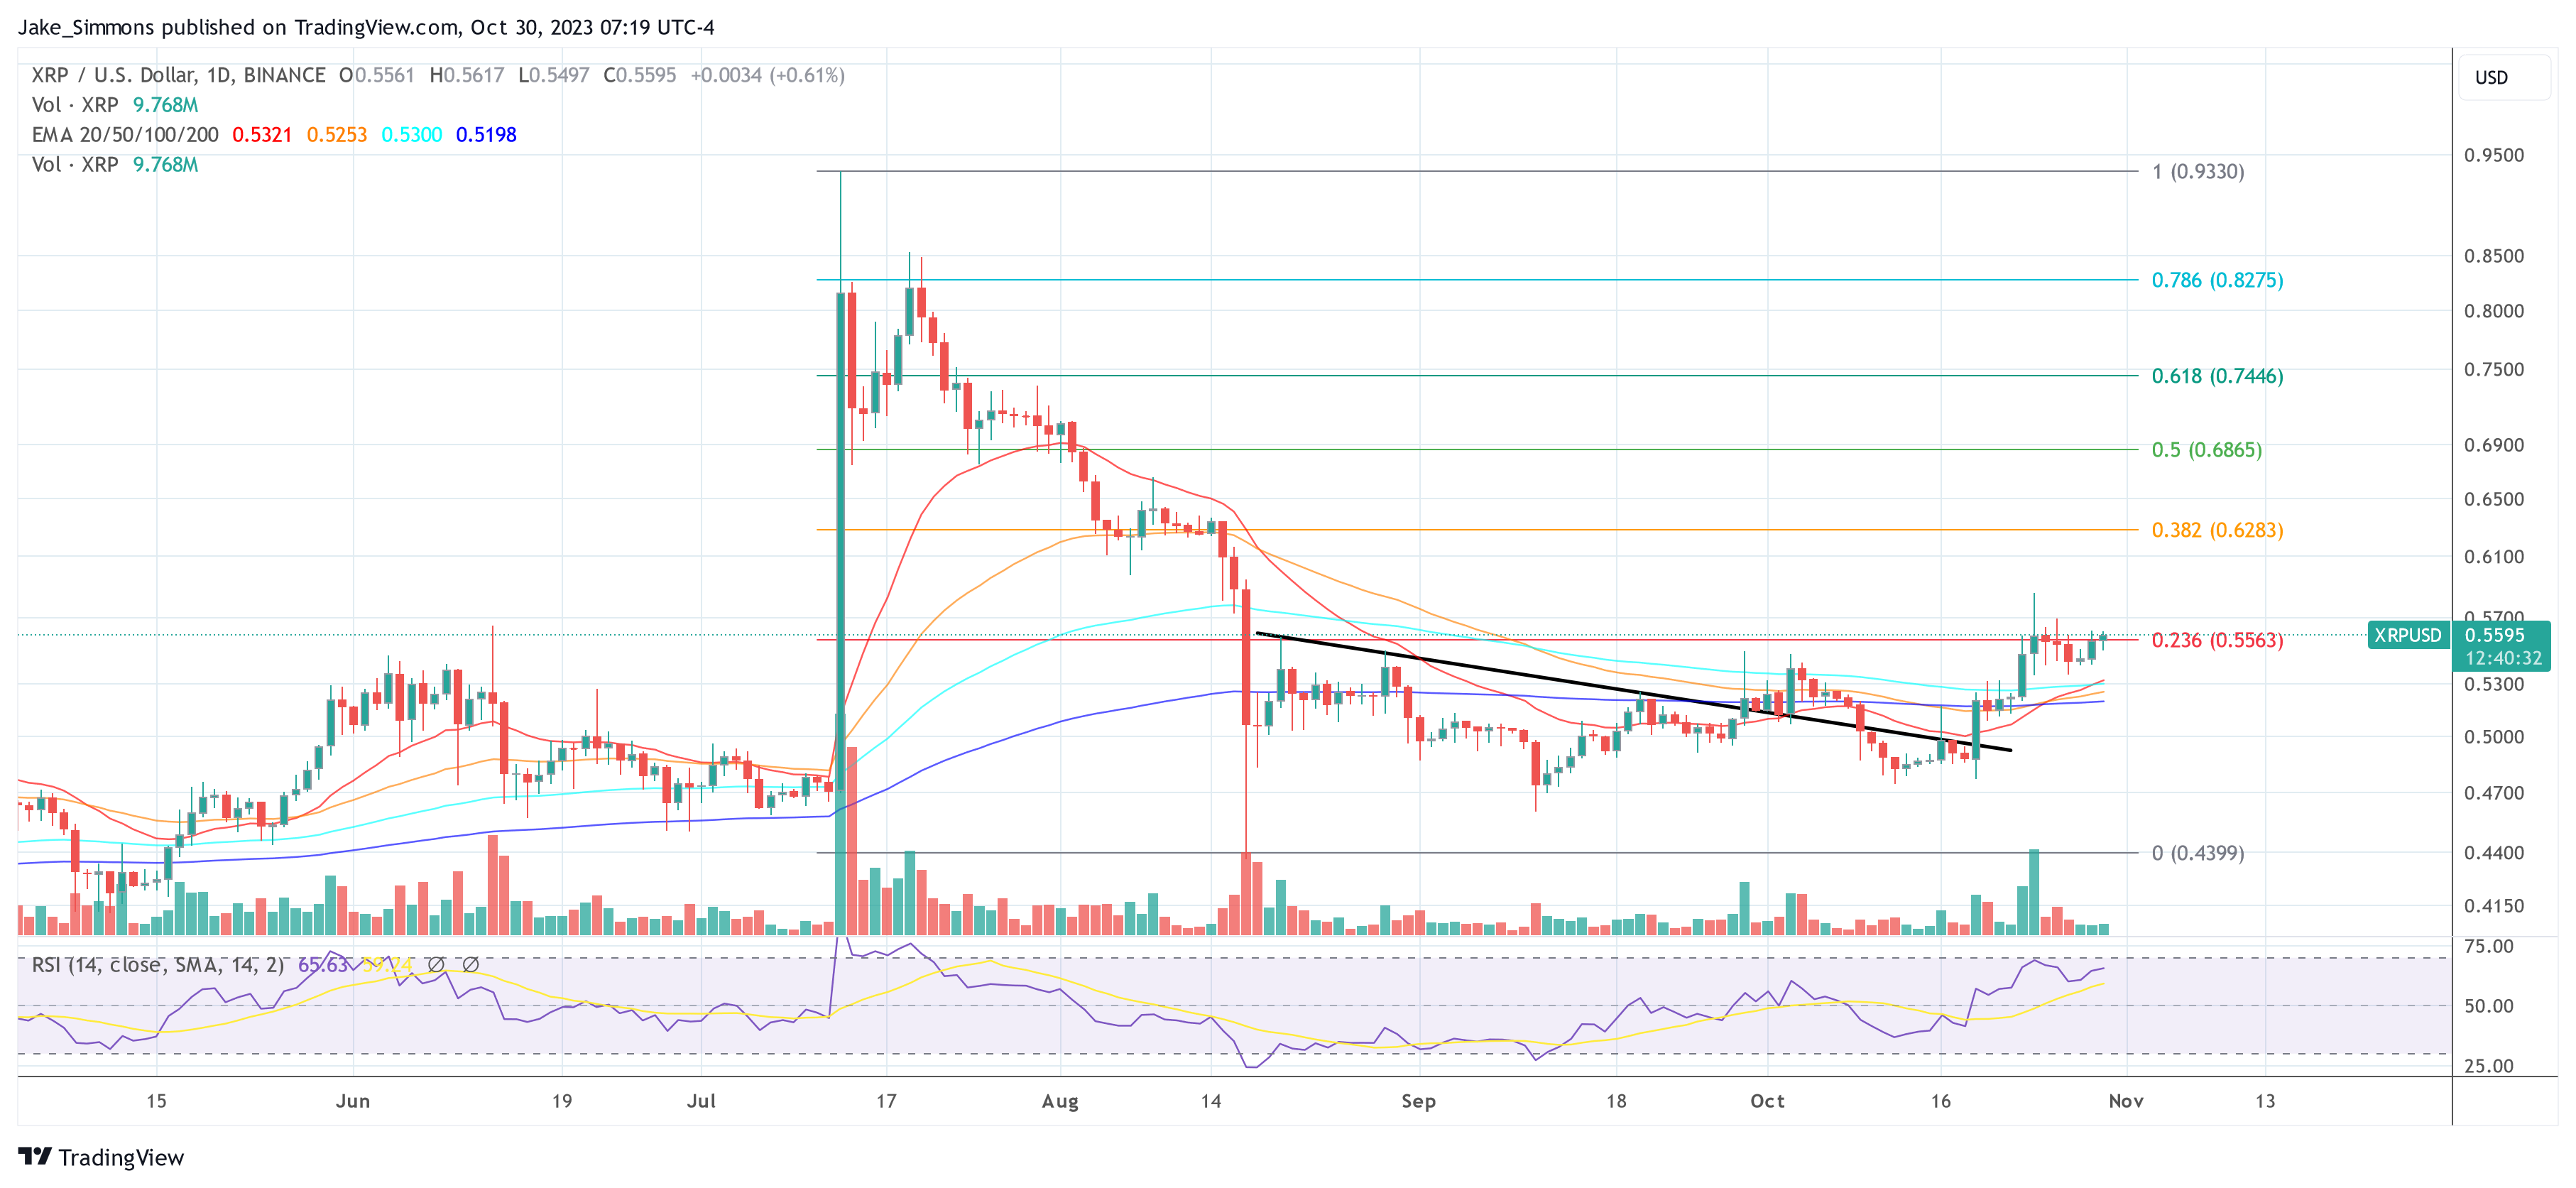
At press time, XRP traded at $0.5595.
UK publishes plans for stablecoins regulation

Non-fiat-backed stablecoins will not be allowed into regulated payment chains.
G7 countries to launch AI code of conduct: Report

The Group of Seven (G7) countries will agree on a voluntary AI code of conduct for companies developing AI to reference for mitigating risks and benefits of the technology.
Singapore plans joint crypto pilots with Japan, Switzerland and UK

Singapore’s central bank and financial regulator is seeking closer cross-border collaboration for its asset tokenization project.
Crypto Exchange Linked to 3AC Founders Drops Lawsuit Against Mike Dudas
OPNX voluntarily dropped its defamation suit against the venture investor and crypto personality.
Ethereum Resilient Above $1,800 Pre-FOMC Meeting – Details
Ethereum (ETH), one of the leading cryptocurrencies, is displaying remarkable resilience in the face of recent market fluctuations. Despite experiencing relatively modest gains compared to Bitcoin (BTC) and other major altcoins, ETH has managed to consolidate its position above the $1800 mark.
The big question on everyone’s mind is whether Ethereum can sustain this level or if it will succumb to the prevailing market sentiment.
In the world of cryptocurrencies, prices are highly susceptible to market sentiment. Cryptocurrencies often exhibit dramatic price swings based on the emotions and perceptions of investors and traders. Positive sentiment tends to drive prices up, while negative sentiment can lead to sharp declines. In this particular instance, the catalyst for market sentiment is the upcoming US Federal Open Market Committee (FOMC).
The Role Of FOMC In Influencing ETH And The Crypto Market
The FOMC is a key division of the US Federal Reserve responsible for setting monetary policy in the United States. One of the primary tools at its disposal is the adjustment of interest rates. When the FOMC meetings take place, the decisions made regarding interest rates can have a significant impact on various financial markets, including cryptocurrencies.
If the FOMC decision leans towards a hawkish stance, implying an increase in interest rates, it could result in a surge of bearish sentiment across the cryptocurrency market. In such a scenario, Ethereum sellers might exert pressure, potentially pushing the altcoin below the $1700 mark.
Conversely, a dovish or unchanged policy stance could lead to a more positive sentiment, allowing ETH to maintain its current position and even experience upward momentum.
As of the latest data available on CoinGecko, Ethereum is trading at $1,816, showcasing a 1.8% gain over the last 24 hours and a notable 8.8% increase over the past seven days. While these gains may appear modest when compared to the cryptocurrency market’s usual volatility, they reflect Ethereum’s capacity to maintain a steady footing in turbulent times.
Ethereum Layer 2 Solutions Break Records
A noteworthy development in the Ethereum ecosystem is the remarkable performance of Layer 2 (L2) solutions. These scaling solutions are designed to alleviate Ethereum’s network congestion and high gas fees.
Recently, L2 solutions set a new all-time high in Total Value Locked (TVL), briefly touching $12 billion before stabilizing around $11.89 billion. This achievement surpasses the previous historic high registered back in April at $11.85 billion, signifying the increasing adoption of Ethereum’s Layer 2 solutions.
With the $1,800 threshold serving as a crucial psychological barrier, the ultimate direction of Ethereum’s price movement hinges on the delicate balance between market sentiment and the decisions of key financial institutions.
(This site’s content should not be construed as investment advice. Investing involves risk. When you invest, your capital is subject to risk).
Featured image from Shutterstock
Saudi’s NEOM partners with Animoca Brands for regional Web3 development

Saudi Arabia’s forthcoming regional development project, NEOM, has partnered with Animoca Brands to push Web3 in the region and a potential $50 million investment deal.
Singapore, Japan, UK, Swiss Regulators Plan Asset Tokenization Pilots
Project Guardian seeks to advance digital asset tokenization pilots in fixed income, foreign exchange and asset management products.
Bitcoin price and energy use for mining highly correlated: UN report

UN scientists evaluated the activities of 76 Bitcoin mining nations during the 2020–2021 period and found that the global BTC mining network consumed 173.42 TW/hs of electricity.
Crypto Analyst Presents Uniswap’s UNI As The Next Coin Primed For Breakout
Several altcoins are currently on the rise following Bitcoin’s resurgence, and popular crypto analyst Ali Martinez has singled out the Uniswap UNI token as one of those tokens that could rally further as he projects that UNI is set to break out soon from its current resistance level.
Why Uniswap Is Poised For A Breakout
In a post shared on his X (formerly Twitter) platform, Martinez noted that the majority of UNI holders were positioned ‘Out of the Money,’ which suggests that the token was preparing for a breakout. Accompanying his post was data from the crypto analytics platform Intotheblock based on the ‘Historical In/Out of the Money’ metric.
The data shows that over 75% of the token holders are ‘out of the money’, which means that they were yet to break even in their investments as the average cost price at which they bought these tokens is greater than its current price.
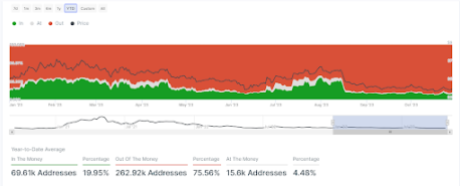 More addresses are out of the money | Source: IntoTheBlock
Furthermore, the crypto analyst explained that selling pressure has gotten exhausted and that the UNI token has been able to build “an important support” level at around $4. This could serve as a lift-off point for the altcoin.
Key Supply Walls UNI Needs To Break
To further support his breakout theory, Martinez noted two supply walls that UNI “needs” to overcome in order to signal a bullish breakout. According to him, one of these supply walls is at $4.23, where data from Intotheblock shows that 7,000 addresses have bought 14.24 million worth of UNI.
The other supply wall is at $4.45, where data from Intotheblock shows that 2,000 Uniswap addresses have accumulated 10.28 million worth of UNI. Whales and institutional players may also be aware of this potential breakout and may be looking to position themselves, as Martinez noted.
The crypto analyst also recently commented on a potential Ethereum breakout. In a different post on his X platform, he said that the second largest cryptocurrency by market cap will need to overcome the huge supply wall at $1,960, where data from Intotheblock showed that 1.14 million addresses bought close to 33 million ETH.
Meanwhile, Martinez believes that now is a good time for people to accumulate Bitcoin based on his examination of the past two cycles from the market bottom and the present Bitcoin trend. According to him, a similar trajectory points to the next Bitcoin market top being around October 2025.
At the time of writing, the UNI token is trading at around $4.10, according to data from CoinMarketCap.
Sam Bankman-Fried Implied His Friends Lied About His Role in FTX’s Collapse
Sam didn’t do it. He didn’t defraud anyone, he didn’t steal customer funds – he just built a company which “turned out basically the opposite” of the product he envisioned when he founded FTX: “A lot of people got hurt – customers, employees – and the company ended up in bankruptcy.” At least, that’s his story.
UK Publishes Final Proposals for Crypto, Stablecoin Regulation
The U.K. government published its final proposed rules for crypto and stablecoins on Monday.
Kraken will share data of 42,000 users with IRS

The information will be sent to the Internal Revenue Service in early November.
Bitcoin Whales Take Charge as Number of $100K Transactions Surge
The number of transactions of over $100,000 processed on the Bitcoin blockchain rose to a new year-to-date high last week.
Thailand’s KBank acquires crypto exchange business Satang

Thailand’s second-largest lender by assets, Kasikornbank, is moving into crypto by acquiring a majority stake in the local crypto business Satang.
Bitcoin Price Poised For Another Surge Like Last Week: Here’s Why
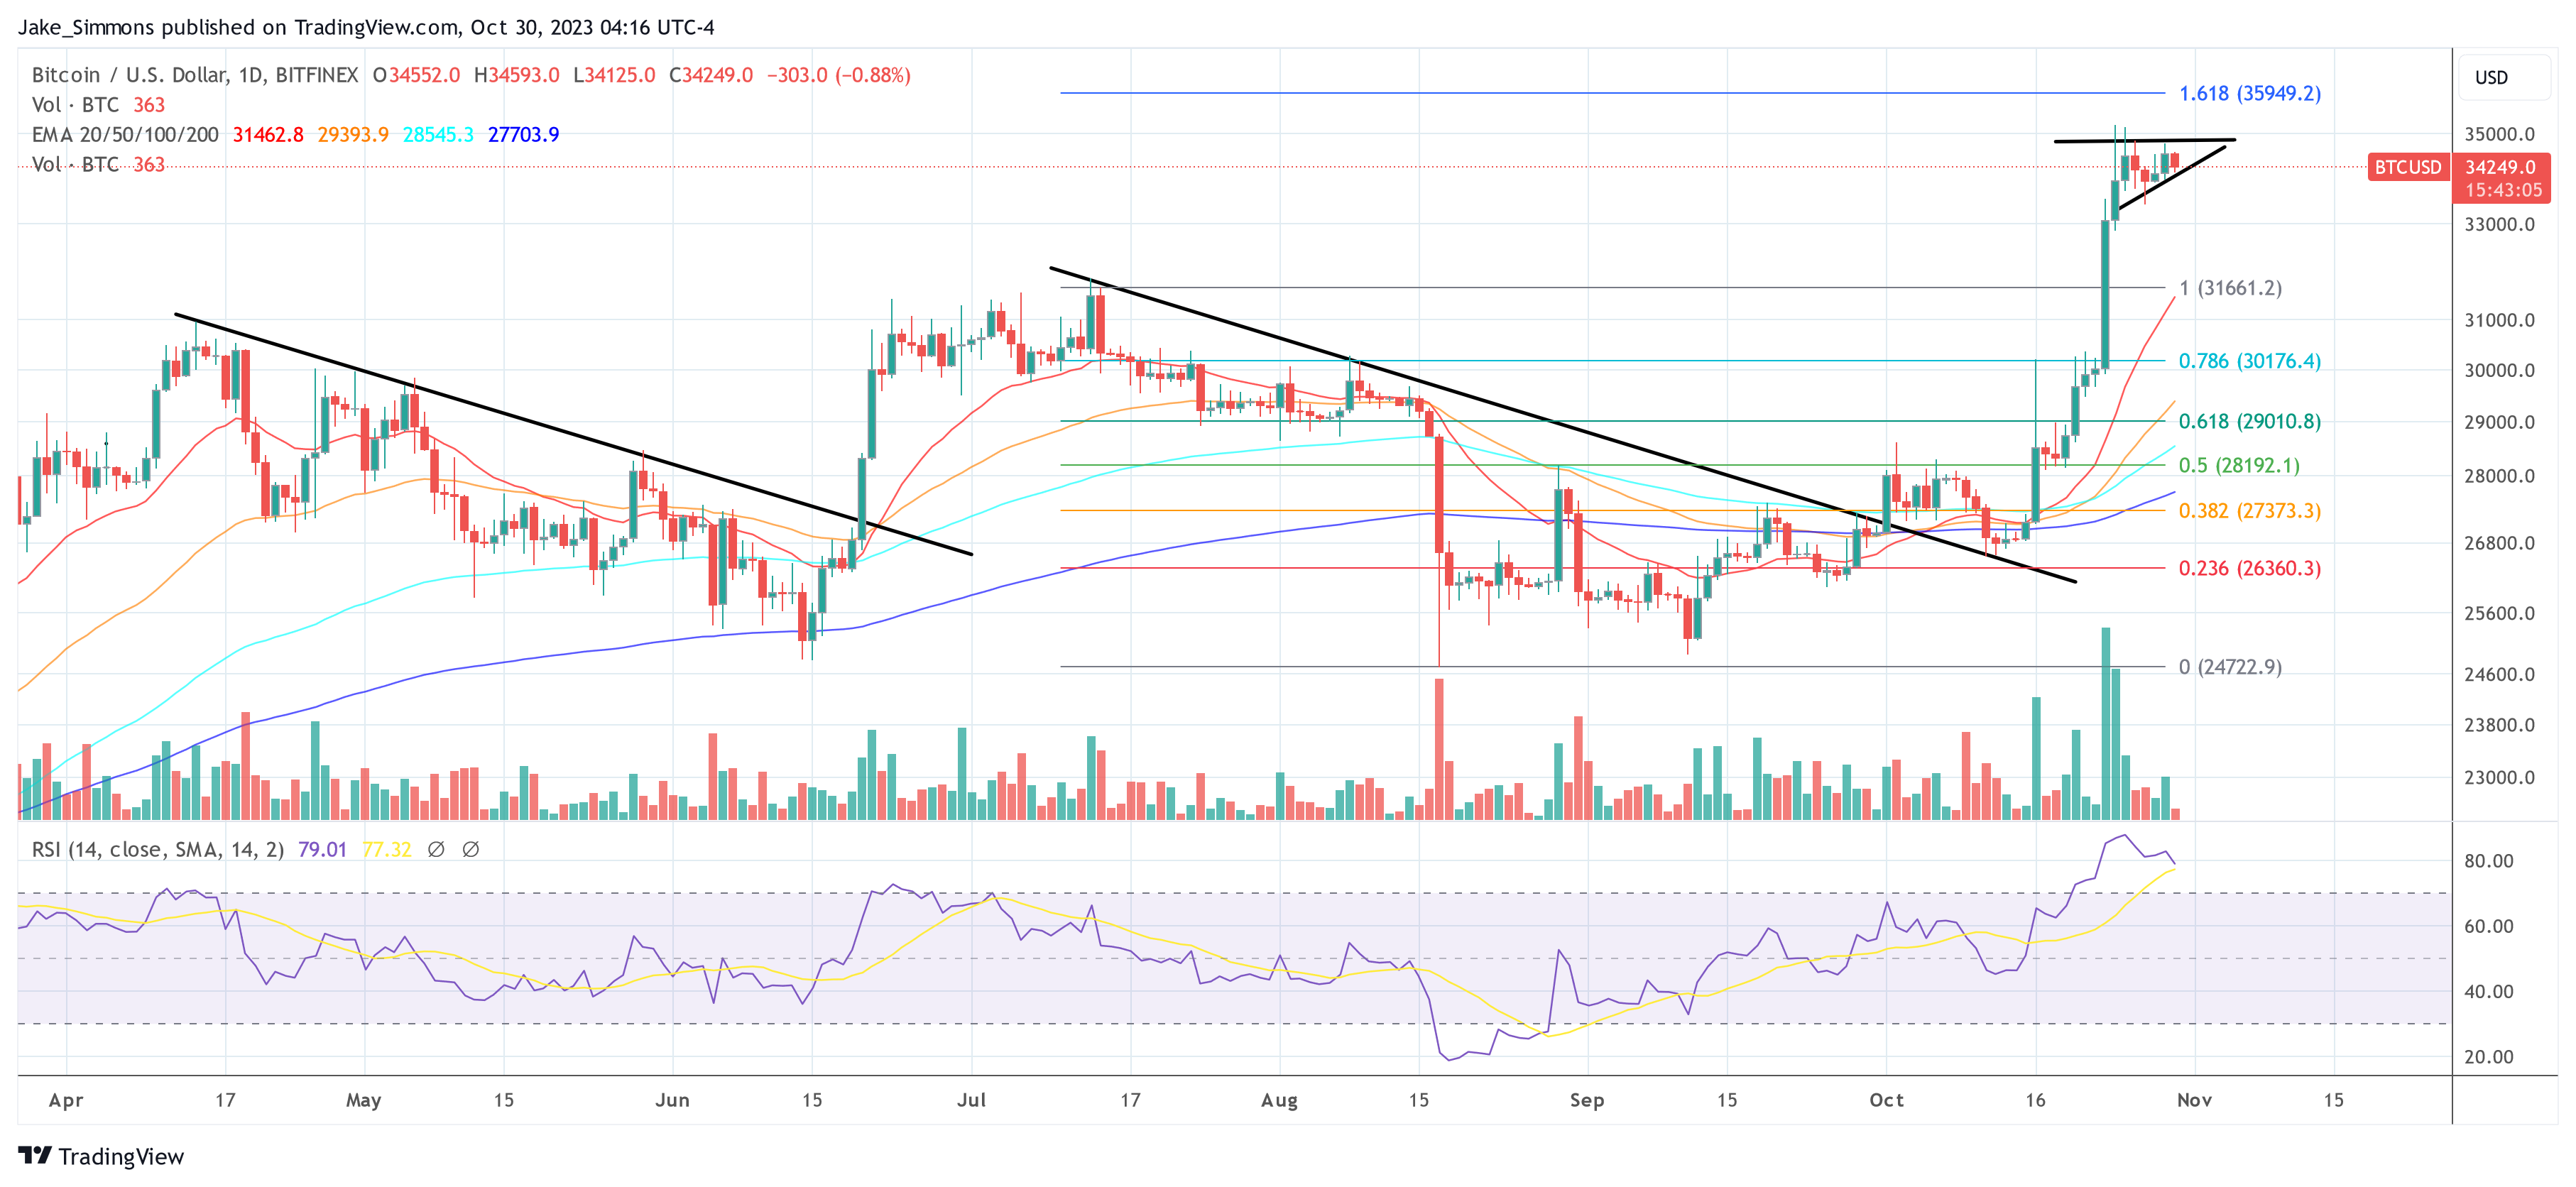
In a recent statement via X (formerly Twitter), Alex Thorn, head of firm wide research at digital asset firm Galaxy, highlighted the potential for another Bitcoin gamma squeeze similar to the one witnessed last week. BTC gained 15% last week. He remarked, “The Bitcoin gamma squeeze from last week could happen again. If BTCUSD moves higher to $35,750-36k, options dealers will need to buy $20m in spot BTC for every 1% upside move, which could cause explosiveness if we begin to move up towards those levels.”
Elaborating on the mechanics, Thorn explained the behavior of dealers in relation to gamma and delta. “When dealers are short gamma and price moves up, or when they are long gamma and price moves down, they need to buy spot to stay delta neutral. Last week’s expiries will dampen potential explosiveness, but it’s still in play.” This essentially means that the actions of options dealers, driven by the need to maintain a neutral position, can amplify price movements.
Will Bitcoin Price Rally Like Last Week?
Thorn also emphasized the importance of on-chain data in understanding these dynamics. He mentioned a continued divergence between the supply held by long-term holders and the supply that has moved in less than 24 hours. This divergence, which has been growing over the past year, indicates a decline in on-chain liquidity, suggesting that long-term holders are not selling their holdings, potentially leading to a supply squeeze.
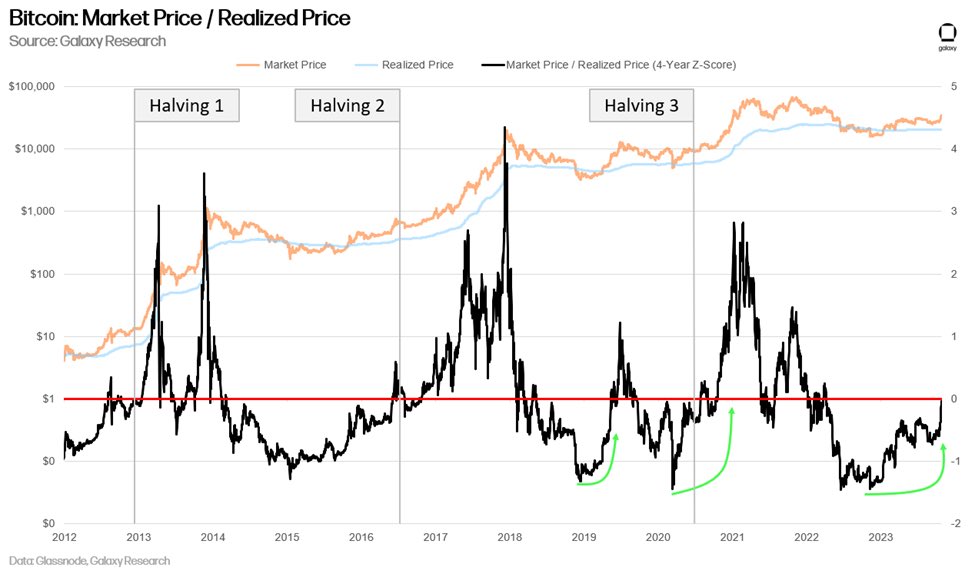
Furthermore, Thorn pointed to the 4-year rolling Z-score of the ratio of market price to realized price, a variation of the MVRV ratio. This metric provides insights into Bitcoin’s valuation relative to its historical average. A high positive Z-score indicates potential overvaluation, while a negative Z-score might suggest undervaluation. Thorn’s observation that the pattern is beginning to resemble those seen before previous bull runs is particularly noteworthy.
Another crucial observation made by Thorn pertains to the compression of relative cost bases. He noted a tightening pattern that has historically been observed during bear or accumulation periods that precede bull markets. This compression suggests that there is a consensus among different types of holders about the value of Bitcoin.
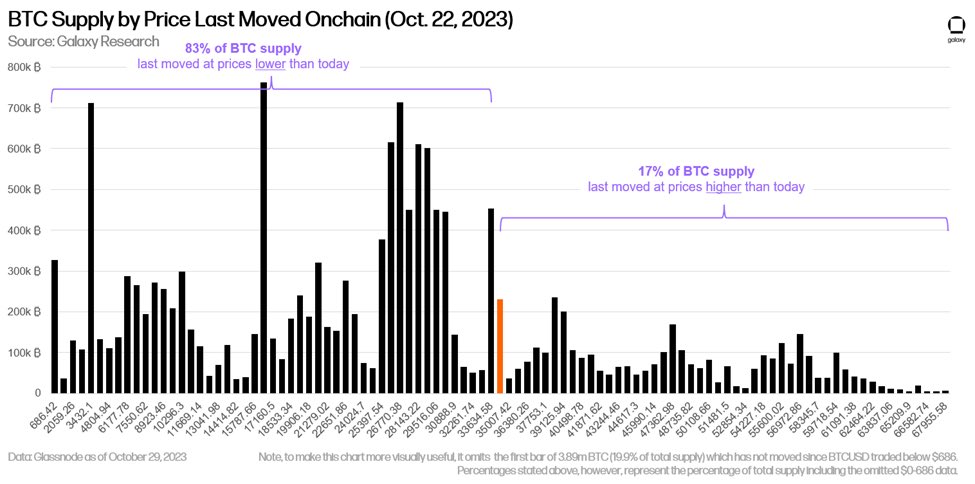
Thorn’s analysis of the Bitcoin supply by the price at which each coin last moved is particularly illuminating. He observed a sparse cost basis between the current price of $34,591 and the $38,400-39,100 range. Moreover, with 83% of the supply not having moved since prices were lower than today and nearly 70% of the supply stagnant for over a year, it’s evident that long-term holders are in profit and are likely waiting for even higher prices before selling.
Last week, as reported by NewsBTC, Thorn had accurately predicted a gamma squeeze. He had emphasized the significant role the options market played in influencing Bitcoin’s price trajectory. Thorn warned, “We are approaching max pain for gamma shorts.”
In summary, while Thorn does not make a direct prediction about Bitcoin’s near-term price, his analysis on X provides a comprehensive overview of the current market dynamics. The combination of potential gamma squeezes, declining on-chain liquidity, and historical patterns all point towards a favorable environment for Bitcoin bulls.
At press time, BTC traded at $34,249.
3 unique ways hackers are stealing your crypto: Bitrace Report

Crypto investors claiming “my coins disappeared suddenly” have been found to recently download crypto applications from unverified sources.
End of ‘Uptober’ targets $40K BTC price — 5 things to know in Bitcoin this week

Bitcoin holds higher BTC price levels into what looks to be a crunch week for crypto markets across the board.
Charting The Dogecoin Path: More Gains On the Horizon?
Dogecoin (DOGE) continues its remarkable ascent in the cryptocurrency market, garnering attention from investors and enthusiasts alike. Over the past two years, DOGE has exhibited a strong affinity for an ascending trendline, which has played a pivotal role as a dynamic support mechanism.
This trendline, indicative of the coin’s consistent upward trajectory, has become a defining feature of the meme coin’s journey.
In the last six months, the price of Dogecoin has entered a consolidation chapter, repeatedly rebounding off the ascending support trendline situated in the $0.055-$0.06 range.
The significance of this pattern lies in the coin’s resilience to market fluctuations, bolstered by the unwavering support from its community of investors.
As of the latest data from CoinGecko, DOGE is currently trading at $0.068750, with a 0.6% gain in the past 24 hours and an impressive 10.8% surge over the past week. This upward momentum reflects the coin’s resilience and growing appeal among traders and investors.
Dogecoin Potential Upsurge
A notable technical pattern that has emerged is the formation of a double bottom, signifying a potential bullish trend. This pattern suggests that DOGE’s price could experience a substantial 20% rally, contingent on buyers maintaining support above the immediate threshold of $0.067.
The recent surge in meme coins, including DOGE, Shiba Inu (SHIB), and Floki Inu (FLOKI), has added to the excitement in the cryptocurrency sphere.
The growing enthusiasm can be attributed to the buzz surrounding the Bitcoin Exchange Traded Fund (BTC ETF), which has sent ripples across the crypto market and turned it a vibrant shade of green.
Understanding The Ascending Trendline
The significance of DOGE’s affinity for the ascending trendline cannot be overstated. This trendline serves as a visual representation of the coin’s consistent bullish trajectory over the past two years.
As the price of DOGE hovers in the $0.055-$0.06 range, it reaffirms the coin’s resilience and stability, making it an attractive option for both long-term and short-term investors.
The formation of a double bottom pattern in DOGE’s price chart is a promising development for traders. This pattern typically suggests that the coin is on the verge of a bullish trend reversal.
If buyers manage to uphold the immediate support level of $0.067, there is a potential for DOGE to embark on a significant 20% rally, offering traders an enticing opportunity for profits.
DOGE’s sustained journey along its ascending trendline, coupled with the potential of a double bottom pattern, paints an optimistic picture for the coin’s future.
As the broader cryptocurrency market experiences a surge in meme coin popularity, driven by the BTC ETF hype, DOGE enthusiasts eagerly await what the future holds for this beloved meme-inspired cryptocurrency.
(This site’s content should not be construed as investment advice. Investing involves risk. When you invest, your capital is subject to risk).
Featured image from Shutterstock


