
The license is pending operational approval and allows Crypto.com’s Dubai entity to offer exchange, broker-dealer, and lending and borrowing services.
Cryptocurrency Financial News
The license is pending operational approval and allows Crypto.com’s Dubai entity to offer exchange, broker-dealer, and lending and borrowing services.

Account abstraction advocate John Rising shared “sobering” figures concerning the adoption of ERC-4337 smart accounts.

FTX Foundation employee Ross Rheingans-Yoo said he was not part of Sam Bankman-Fried’s “inner circle” and knew nothing about FTX’s fraud.
Ethereum (ETH), the second-largest cryptocurrency, has seen a significant price increase over the past month. The recent bullish rush in the crypto market, coupled with BlackRock’s involvement, has pushed ETH to its year-to-date high of $2,139.
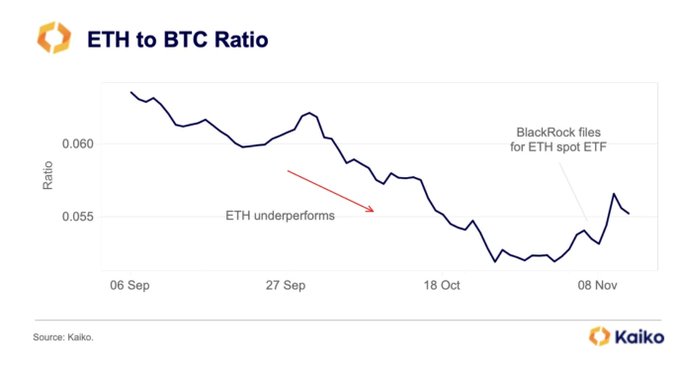
According to market data provider Kaiko, ETH has outperformed BTC and many altcoins in recent weeks, signaling a shift in market dynamics.
Kaiko’s report highlights how ETH struggled to gain momentum over the past year, despite successful upgrades such as The Merge in April.
However, the sentiment around ETH changed dramatically when BlackRock filed for a spot ETH exchange-traded fund (ETF), leading to a reversal in the ETH to Bitcoin (BTC) ratio.
The impact on the market was substantial, with ETH prices surging above $2,000 for the first time since April. Additionally, daily spot trade volumes reached $7 billion, the highest level since the collapse of FTX.
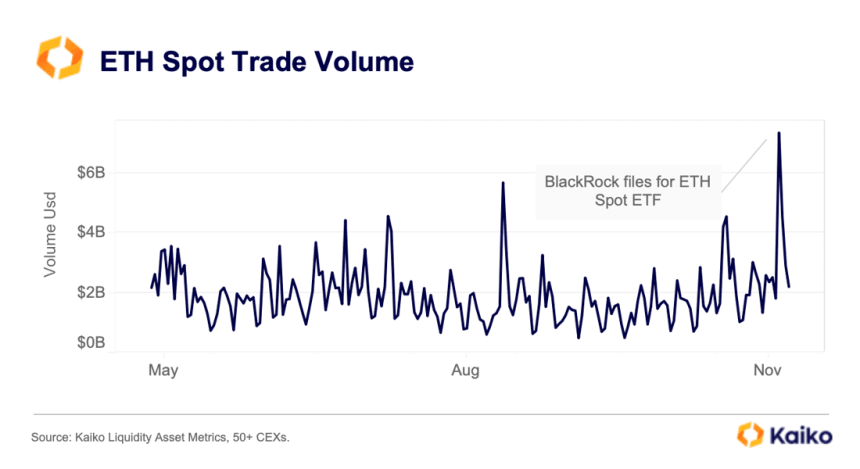
The ETH ETF narrative provided further impetus to the ongoing rally, amplified by improved global risk sentiment and declining US Treasury yields.
The dominance of altcoin + ETH volume relative to BTC has risen to 60%, marking its highest level in over a year. During bull rallies, altcoin volume typically increases relative to BTC.
This surge in demand has also led to rising leverage, as reflected in the recovery of ETH open interest to early August levels. Notably, BTC open interest has declined over the past month due to liquidations on Binance, resulting in the Chicago Mercantile Exchange (CME) outpacing Binance as the largest BTC futures market.
Furthermore, ETH funding rates, a gauge of sentiment and bullish demand, have reached their highest levels in over a year, indicating a significant shift in sentiment. In November, both BTC and ETH 30-day volatility rose to 40% and 50% respectively, following a multi-year low of around 15% during the summer months.
Renowned crypto expert Michael Van de Poppe believes that ETH is on the cusp of a significant breakthrough. According to Van de Poppe, if Ethereum manages to surpass the crucial $2,150 resistance level, it could signify the end of the bear market.
Drawing a parallel with Bitcoin’s critical $30,000 barrier, Van de Poppe suggests that breaching this level could pave the way for a substantial rally, potentially propelling Ethereum towards the price range of $3,100 to $3,600.
However, Ethereum has yet to touch the $2,150 resistance line, as it faces a pre-existing obstacle in the form of its yearly high of $2,139. This pivotal level has halted the cryptocurrency’s bullish momentum, acting as a formidable resistance.
As a result, Ethereum has been consolidating within a narrow range between $2,050 and $2,100 for the past three days.
The forthcoming days will reveal whether Ethereum can overcome its immediate resistance levels and establish a consolidated position above them. Alternatively, it may face a fate similar to Bitcoin, which failed to surpass the $31,000 level for over seven months before reaching its current trading price of $36,000.
Featured image from Shutterstock, chart from TradingView.com

A memecoin drawing its name from the Grok AI project plummeted after allegations its social media account was recycled from that of a former scam token.
Ethereum prices are firm at spot rates, still trading above the $2,000 level, and multiple other factors point to possible trend continuation.
According to Kaiko’s data on November 12, not only is the ETH-BTC ratio shifting and reversing after extended periods of lower lows, but also there is a notable uptick in trading volume with funding rates in crypto derivative platforms shifting from negative to positive, suggesting increasing demand.
As of writing on November 13, Ethereum is relatively firm and changing hands at around the $2,090 level. Despite the expected contraction in trading volume over the past couple of days following the rally on November 9, the uptrend remains in place.
So far, the immediate support level technical analysts are watching remain at $2,000, marking July 2023 highs. Conversely, the $2,100 zone, marking the April high, is a critical liquidation level that optimistic bulls must break for a buy trend continuation pattern.
As it is, traders are optimistic. However, whether the uptrend will continue depends primarily on trader sentiment and if existing fundamental factors might spark more demand, lifting ETH to new 2023 highs. Thus far, even though the general ETH support base remains upbeat, the coin, unlike Bitcoin (BTC), is struggling to break key resistance levels recorded in H1 2023, which is a concern.
On the positive side, looking at the ETHBTC candlestick arrangement in the daily chart, the sharp reversal of ETH fortunes on November 9 could anchor the next leg up, signaling a new shift in a trend that favors Ethereum buyers. Looking at the ETHBTC formation, Bitcoin bulls have had the upper hand in 2023.
Related Reading: XRP Price Path To $1: Exploring Two Potential Outcomes From The $0.66 Resistance Level
To quantify, BTC is up 33% versus ETH, with the climactic sell-off of October 23 pushing BTC to the highest point against the second most valuable coin in 2023. However, the sharp recovery on November 9 and the subsequent failure of BTC bulls to reverse losses suggest that ETH has the upper hand.
Thus far, ETHBTC prices are trending inside the November 9 bullish engulfing bar at the back of light trading volumes, a net positive for bullish ETH holders.
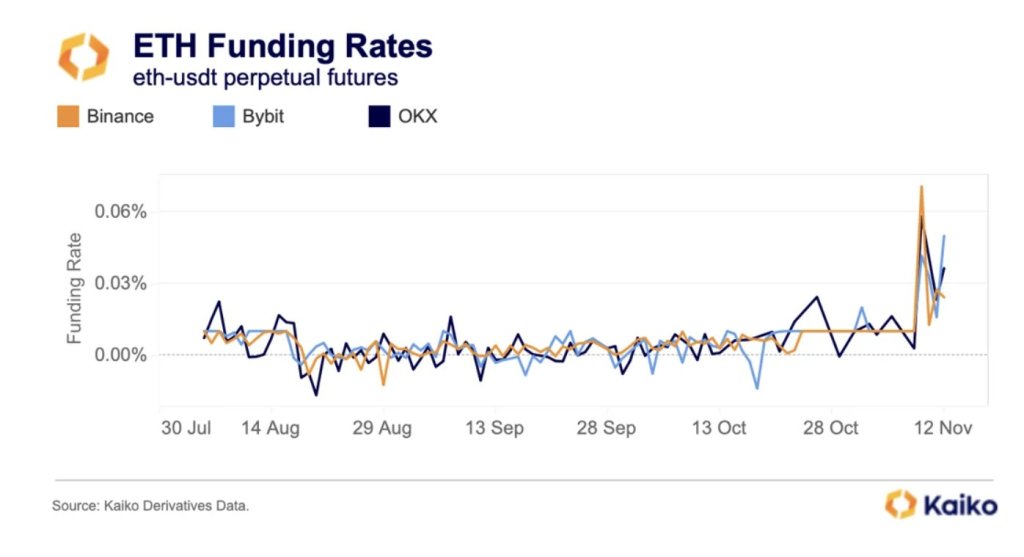
Following this surge, Kaiko notes that the funding rate of the ETHUSDT pair is positive, signaling increasing demand in the crypto derivatives scene. When funding rates turn positive from negative, it means “long” traders are paying “short” traders to keep their positions open. This development indicates that more traders are long ETH, expecting prices to rise in the sessions ahead.
Grok (GROK) token, inspired by Elon Musk’s artificial intelligence service through X (formerly Twitter), has recently come under scrutiny following explosive growth in market capitalization.
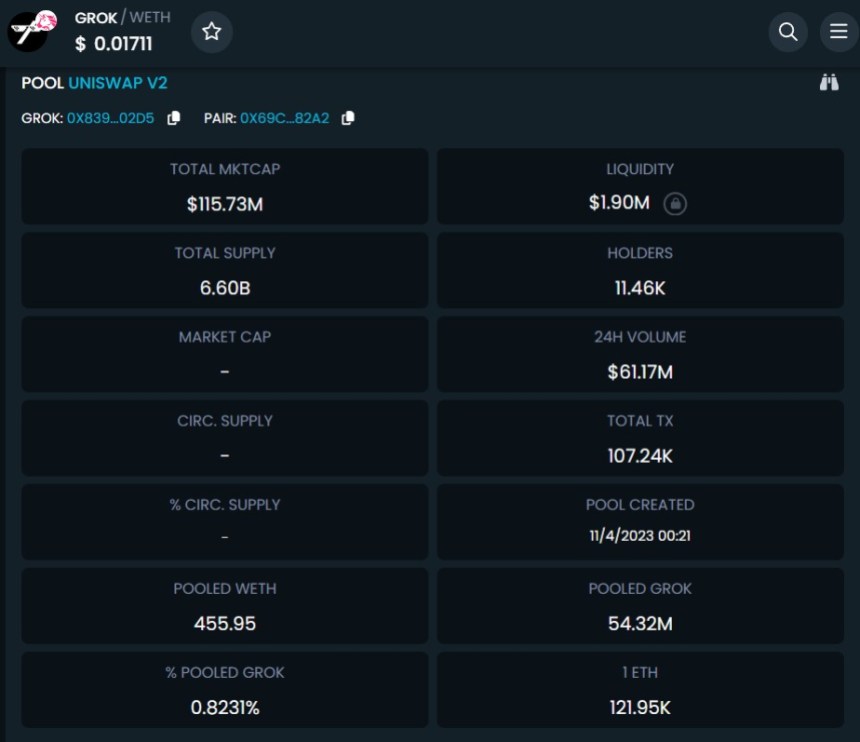
According to recent reports, Grok zoomed to a staggering $160 million market cap within just eight days of its release. However, reports of alleged scam involvement have overshadowed the token’s rapid ascent.
Grok token prices have soared, doubling within the past 24 hours alone, extending a week-long rally that has seen an astonishing 13,000% increase. The token boasts an impressive 11,000 holders and has witnessed a trading volume of over $60 million over the past 24 hours, according to data from DEXTools.
However, ZachXBT, a self-proclaimed crypto detective, has raised concerns about the legitimacy of Grok, stating that the token was created by a scammer. ZachXBT has stated that the same X/Twitter account associated with Grok has been linked to at least one other fraudulent scheme. ZachXBT stated:
Not that people in this space will care but GROKERC20 GROK was created by a scammer. Same exact X/Twitter account has been reused for at least one other scam. X/Twitter ID: 1690060301465714692
Satoshi Flipper, another prominent crypto trader on X, echoed this sentiment, labeling Grok as an “effing scam” and emphasizing that Elon Musk did not authorize the token’s launch. Satoshi Flipper said:
This is Grok. $1.9M liquidity and a $137M market cap? What an effing scam. Not only that, it’s completely fraudulent to trade this knowing Elon Musk, the owner of Grok, did not authorize these devs to launch a token. Imagine touching this toxic trash.
Experts from Arkham Intelligence also weighed in, reporting that an on-chain trader sold a significant amount of GROK at nearly 40% slippage, reinforcing the scam allegations made by ZachXBT.
The controversy surrounding Grok has raised concerns within the cryptocurrency community. Critics argue that the token’s market cap, coupled with the lack of authorization from Elon Musk, raises red flags.
The token’s market cap has undergone a retracement, now at $108 million, down from its previous value of $160 million. Additionally, the token exhibits a liquidity of $1.83 million.
Despite experiencing a substantial slippage of 48%, with its price dropping as low as $0.0056000, the token has remarkably recuperated and is now trading at $0.0108452.
It is yet to be determined whether further reports will surface to shed light on the individuals behind the token’s creation and their objectives, potentially exposing the risk of a rug pull within the cryptocurrency industry.
However, despite these allegations, the token has attracted significant attention and excitement from investors eager to participate in the potential surge of the next major meme coin, aiming to achieve substantial gains in their investments. As of the time of writing, the Grok official account on X has not made any statements regarding these allegations.
Featured image from Shutterstock, chart from TradingView.com
DTCC, Euroclear, Nomura and WisdomTree also participated in the Series B funding round.
Crypto analyst Fiery Trading has revealed a very bullish outlook for the Cardano (ADA) price. The digital asset which has been having a reasonably good run over the last few weeks is expected to shatter expectations as the analyst puts the price at $35.
Fiery Trading’s latest Cardano (ADA) prediction right be one of the most bullish for the digital asset this year. ADA, the native token of the Cardano network, is currently trading at $0.388 and if the crypto analyst’s prediction proves true, then it’ll be an 8,800% rise to $35.
The analyst presents the argument that ADA had already bottomed out last month and this is why the price has been in an uptrend. They place the bottom for the price downtrend at the bottom support of the parallel channel which happened right before the price recovery started.
As the analyst explains, “The parallel channel is formed by drawing a line between the two bull-market tops, and copying that exact line towards the Corona dump’s bottom.” So with this, ADA has confirmed the pattern, which is very bullish for the digital asset.
Fiery Trading explains that it is this trend that could drive the Cardano price toward the new all-time high of $35. However, this is not happening soon as the crypto analyst expects that the next market top for ADA during the bull market will happen sometime in 2025. Nevertheless, the analyst expects ADA to follow this pattern and ride it all the way above $35.
Fiery Trading’s prediction above $30 is not the first to emerge for the Cardano price. Another analyst Lucid had also presented a similar argument that the ADA price could climb above $30. However, where Fiery Trading used the parallel channel confirmation as a basis for their analysis, Lucid argued that Cardano had the potential to surge to $30 if “even Ethereum with all its issues hit $500 billion!”
Investors seem to agree with this outlook as they have increased their accumulation over the last month. Notably, Cardano whales spent over $600 million to buy 1.89 billion ADA in one month. These large investors also increased the frequency of their transactions and the fact that the price continued to climb amid this suggested that they were buying rather than selling.
This growing confidence from investors and the fact that Cardano remains one of the top networks in terms of developments suggests that it is primed for an intense breakout. It also means that the digital asset is well-positioned to do well in the bull run.

XRP’s price surge was short-lived and has almost returned to its original price.
A fake BlackRock XRP Trust filing roiled the crypto market during U.S. afternoon hours, weighing on altcoins as the crypto rally cooled.
The open source protocol spearheaded by DeFi giant Stani Kulechov has released a bevy of new monetization features.
All Aave v2 markets are now operational, the team behind the non-custodial liquidity protocol announced in a November 13 post on X. This a day after v3 markets were unfrozen following the approval from the community.
Aave is a platform where users can supply liquidity in exchange for rewards while borrowers are free to take loans while paying interest in a trustless environment.
In the post, Aave said the security of the decentralized finance (DeFi) protocol remains a “priority and is non-negotiable for the community.”
On November 4, Aave said they received a report “of an issue on a certain feature.” After being validated, the protocol decided to take a step and pause the operation of their v2 markets on Ethereum. At the same time, some v2 markets on Avalanche were frozen. Even so, the v2 markets on Polygon were unaffected.
Aave also froze operations on Aave v3 on Polygon, Arbitrum, and OP Mainnet. However, v3 markets on Ethereum, Base, and Metis were unaffected.
While Aave v2 and v3 markets were frozen, the protocol clarified that users supplying or borrowing affected assets could still withdraw and repay their positions but couldn’t supply or borrow more. With those markets unfrozen, they can now continue as it was before.
The resumption of services, looking at the AAVE candlestick arrangements in the daily chart, has not impacted prices. However, the token is trading at around 2023 highs and remains within a bullish formation as optimistic traders expect the uptrend to continue.
Despite the uptrend, bulls have failed to break above the $110 resistance level. As it is, this reaction level marks August 2022 highs and has not been breached in the past 15 months.
The token has more than doubled at spot rates, rising from $50, a critical support level marking January and June 2023 lows. For trend continuation, there must be a solid breakout above $110 and the $60 range from where prices have been moving horizontally in a multi-month accumulation.
Still, it is unclear how the token will react in the days ahead and whether there will be more upside momentum as liquidity increases as activity resumes on Aave v2 markets.
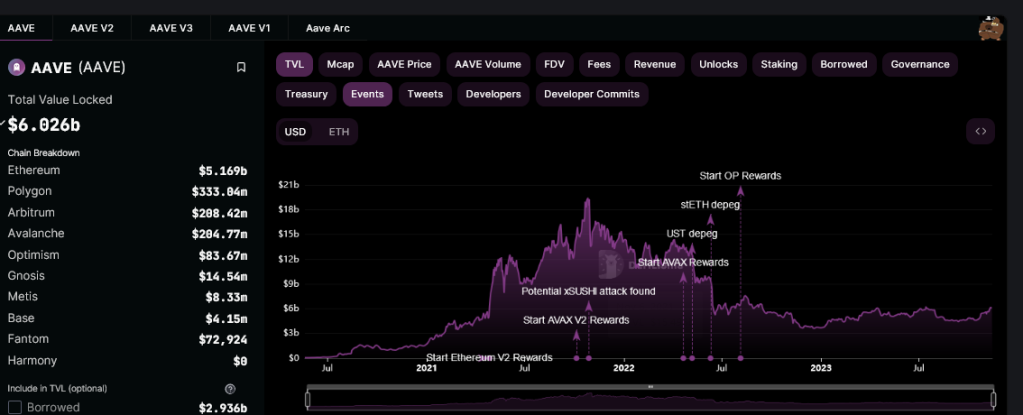
According to DeFiLlama data, Aave is one of the largest DeFi protocols, with over $6 billion in total value locked (TVL). Most of these assets are locked in Ethereum, where over $5.1 billion of tokens are under management.

Even if approved by Nov. 17, the spot Bitcoin ETFs are unlikely to come to market for at least a month after approval.

U.S. Treasury Secretary Janet Yellen said she is looking forward to hearing from the finance ministers of some of the world’s most crypto-forward countries.

Despite an 11.3% correction in just two days, SOL maintains a robust position with healthy derivatives markets and on-chain metrics.
Uniswap Labs, the company behind the decentralized finance (DeFi) protocol, has achieved a milestone in its revenue generation strategy. Just a month after its implementation, the firm’s newly introduced front-end fees have crossed roughly $1 million, a testament to the platform’s robust activity and user base.
This achievement comes shortly after the mid-October decision to introduce a 0.15% fee on some certain tokens transacted on its front-end interface. This new fee structure applies to various assets, including popular ones like ETH, USDC, WETH, USDT, DAI, WBTC, and others.
As shown in data from Token Terminal, over the past few weeks following the fee’s launch, Uniswap has amassed about $1.14 million.
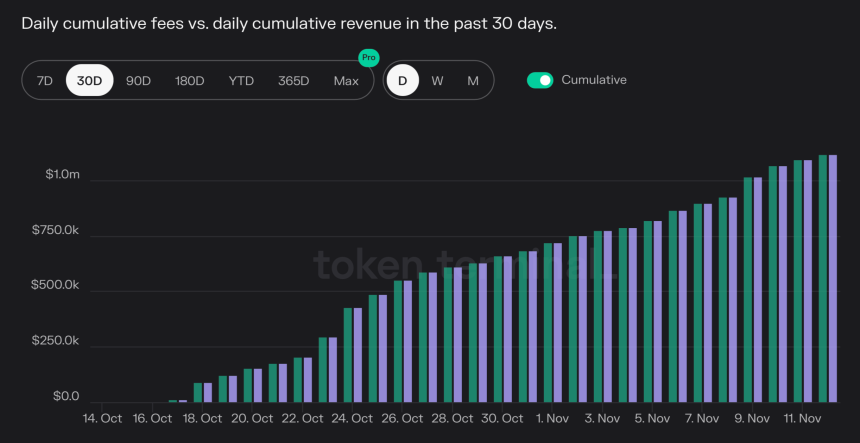
This figure translates to an average daily revenue of approximately $44,000. Projected annually, this rate could bring in roughly or more than $16 million in revenue for Uniswap Labs.
Meanwhile, Blockchain reporter Colin Wu estimated daily fees from Uniswap V3’s new structure could range between $388,000 and $444,000. Although the figures have been more modest, they still represent a substantial income stream.
Wu’s analysis also reveals that about 35% to 40% of Uniswap’s total transaction volume is processed through the front end, indicating a significant portion of the platform’s activity is subject to these new fees.
Regardless, the total cumulative amount recorded in the past weeks, nearly a month, marks a significant financial upturn for the company and highlights the potential profitability of increased fee structures in the DeFi space.
Notably, unlike the long-established 0.3% fee, dispensed among liquidity providers as an incentive, the new front-end fees solely directed towards Uniswap Labs is not just a revenue-generating move, as it also signified a strategic shift towards diversifying income sources.
So far, this step allows Uniswap Labs to have a direct and consistent revenue stream, independent of the protocol fees traditionally distributed among liquidity providers.
It is worth noting that the recent boost in Uniswap’s cumulative front-end fees aligns with an emerging DeFi resurgence, marked by a significant rise in capital inflows.
Data from DeFiLlama reveals a notable nearly $10 billion increase in the DeFi market’s total value locked (TVL) over the past month. This upward trajectory has seen the TVL escalate from $36.62 billion in October to roughly $46.65 billion.
Moreover, this bullish trend extends to DeFi tokens, with leading DeFi assets experiencing substantial growth. Top tokens such as Chainlink (LINK), Avalanche (AVAX), and Uniswap (UNI) have recorded increases of 19.39%, 35%, and 8.56% respectively in the last week, reflecting the overall positive momentum in the crypto market.
Featured image from Unsplash, Chart from TradingView
While crypto representatives and lawyers cautioned the U.S. Internal Revenue Service (IRS) that its crypto tax proposal is a dangerous and improper overreach, questions posed by a panel of IRS and Department of the Treasury officials at a Monday hearing may reveal some flexibility in the rule as it’s still being written.

The Blockchain Association claimed the U.S. Treasury overstepped its authority in proposing crypto tax rules difficult or impossible to follow by many in the space.


