To some, Sam Bankman-Fried’s impending trial is one of the biggest stories in recent news, but to many New Yorkers, the name does not strike a chord.
Circle weighs in on SEC vs. Binance case, argues stablecoins are not securities

Circle noted that assets pegged to USD are not securities, partly because users are not expecting any profit from acquiring them.
Gemini to halt operations in the Netherlands by mid-November

The company cites the inability to meet regulators’ requirements but says it intends to return to the Dutch market.
Bitcoin Traders Eye $28K; Solana, Cardano and Tellor Lead Altcoin Bump
Traders at Japanese exchange Bitbank said in a daily note that they expect bitcoin prices to move towards the $28,000 level, citing ETF optimism.
$9 Trillion BlackRock Sees Bitcoin Spot ETF Approval Delayed, What This means
In continuation of its recent wave of delays, the US Securities and Exchange Commission (SEC) has further delayed the Spot Bitcoin ETF application of the world’s largest asset manager, BlackRock.
SEC Request For Comments On BlackRock’s Bitcoin ETF Application
In its release concerning BlackRock’s application, the SEC called for written comments on why the iShares Bitcoin Trust should be approved or disapproved. This move ultimately extends the period in which the Commission can decide on the proposed rule change, with the next deadline coming on January 15, 2024.
As part of its request for comments, the SEC specifically asked commenters to give their views on whether the Chicago Mercantile Exchange (CME) represented a regulated market of significant size for spot Bitcoin. It also asked them to give their views on the correlation between the Bitcoin spot market and the CME Bitcoin futures market.
It is unknown what the SEC aims to achieve from this, considering that the court had ruled in Grayscale’s case against the Commission that the spot and futures market were correlated. Therefore, there was no reason why ETFs relating to both markets should enjoy different regulatory treatment.
Meanwhile, in a similar fashion, the SEC also extended the deadline for a decision on the Spot Bitcoin ETF applications of Bitwise, Invesco, and Valkyrie. Following this, the next deadline for the SEC to decide on these applications is in January 2024, with Bitwise’s coming on the 14, Invesco on the 15, and Valkyrie’s on the 17 of that month.
It is worth mentioning that the SEC can still further delay these applications one last time before it finally has to decide on them. If that happens, these ETFs are likely not to launch (if approval is given) until mid-March. Meanwhile, the SEC must decide on the ARK 21Shares Bitcoin ETF by January 10, 2024.
The SEC is still expected to delay the Spot Bitcoin ETF applications of WisdomTree, VanEck, and Fidelity before a potential government shutdown on October 1.
Not A Bad Day For Valkyrie
Despite the delay of its Spot Bitcoin ETF application, asset manager Valkyrie and its investors still had something to cheer about, as it is reported to have gotten the nod to offer exposure to ETH futures contracts through its Valkyrie Bitcoin and Ether Strategy ETF.
The asset manager had earlier applied to the SEC to convert its Valkyrie Bitcoin Strategy ETF (BTF) to a new fund that holds both Bitcoin and Ethereum futures contracts.
This move was then touted as a way for the asset manager to gain a first-mover advantage over the rest, and it looks like it worked, as it will become the first to offer US investors the chance to bet on the future price of Ethereum.
Confirming this news, Bloomberg Analyst James Seyffart stated that Valkyrie’s ticker will begin holding “a small % of ETH futures” from September 29 and will switch to “50% ETH 50% BTC” from next week.
New US bill to require firms to report off-chain transactions to CFTC

The new legislation aims to protect crypto investors from disputes, manipulation or fraud potentially stemming from transactions occurring off-chain.
Fireblocks Acquires Tokenization Firm BlockFold for $10M
The acquisition will expand Fireblocks’ capabilities in tokenization including token customization, orchestration, distribution and advisory.
NFT artist raises $140K for cancer support charity

The funds raised from the event will help 4,000 people impacted by cancer and locals who need immediate and vital support.
Coinbase Attempts to Plug Void in Crypto Perpetuals Left by FTX
Cryptocurrency exchange Coinbase this week announced that it had received regulatory approval to list perpetual futures on its international exchange.
Fortnite Developer Epic Games Lays Off 16% of Staff Following Metaverse-Inspired Transition
The game’s growth is now primarily driven by creator content, meaning lower revenue for Epic as the revenue is shared around more.
French police raid Nvidia offices amid antitrust investigation: Report

The action reportedly came as a part of a general inquiry of French antitrust authorities into the cloud computing sector.
Why Is Bitcoin Price Up Today? Insights From Leading Analysts
In the last 24 hours, the Bitcoin price experienced a significant surge of 2%, touching an intraday high of $27,320 yesterday. As of this writing, the BTC price hovered near the $27,000 mark.
Why Is Bitcoin Price Up Today?
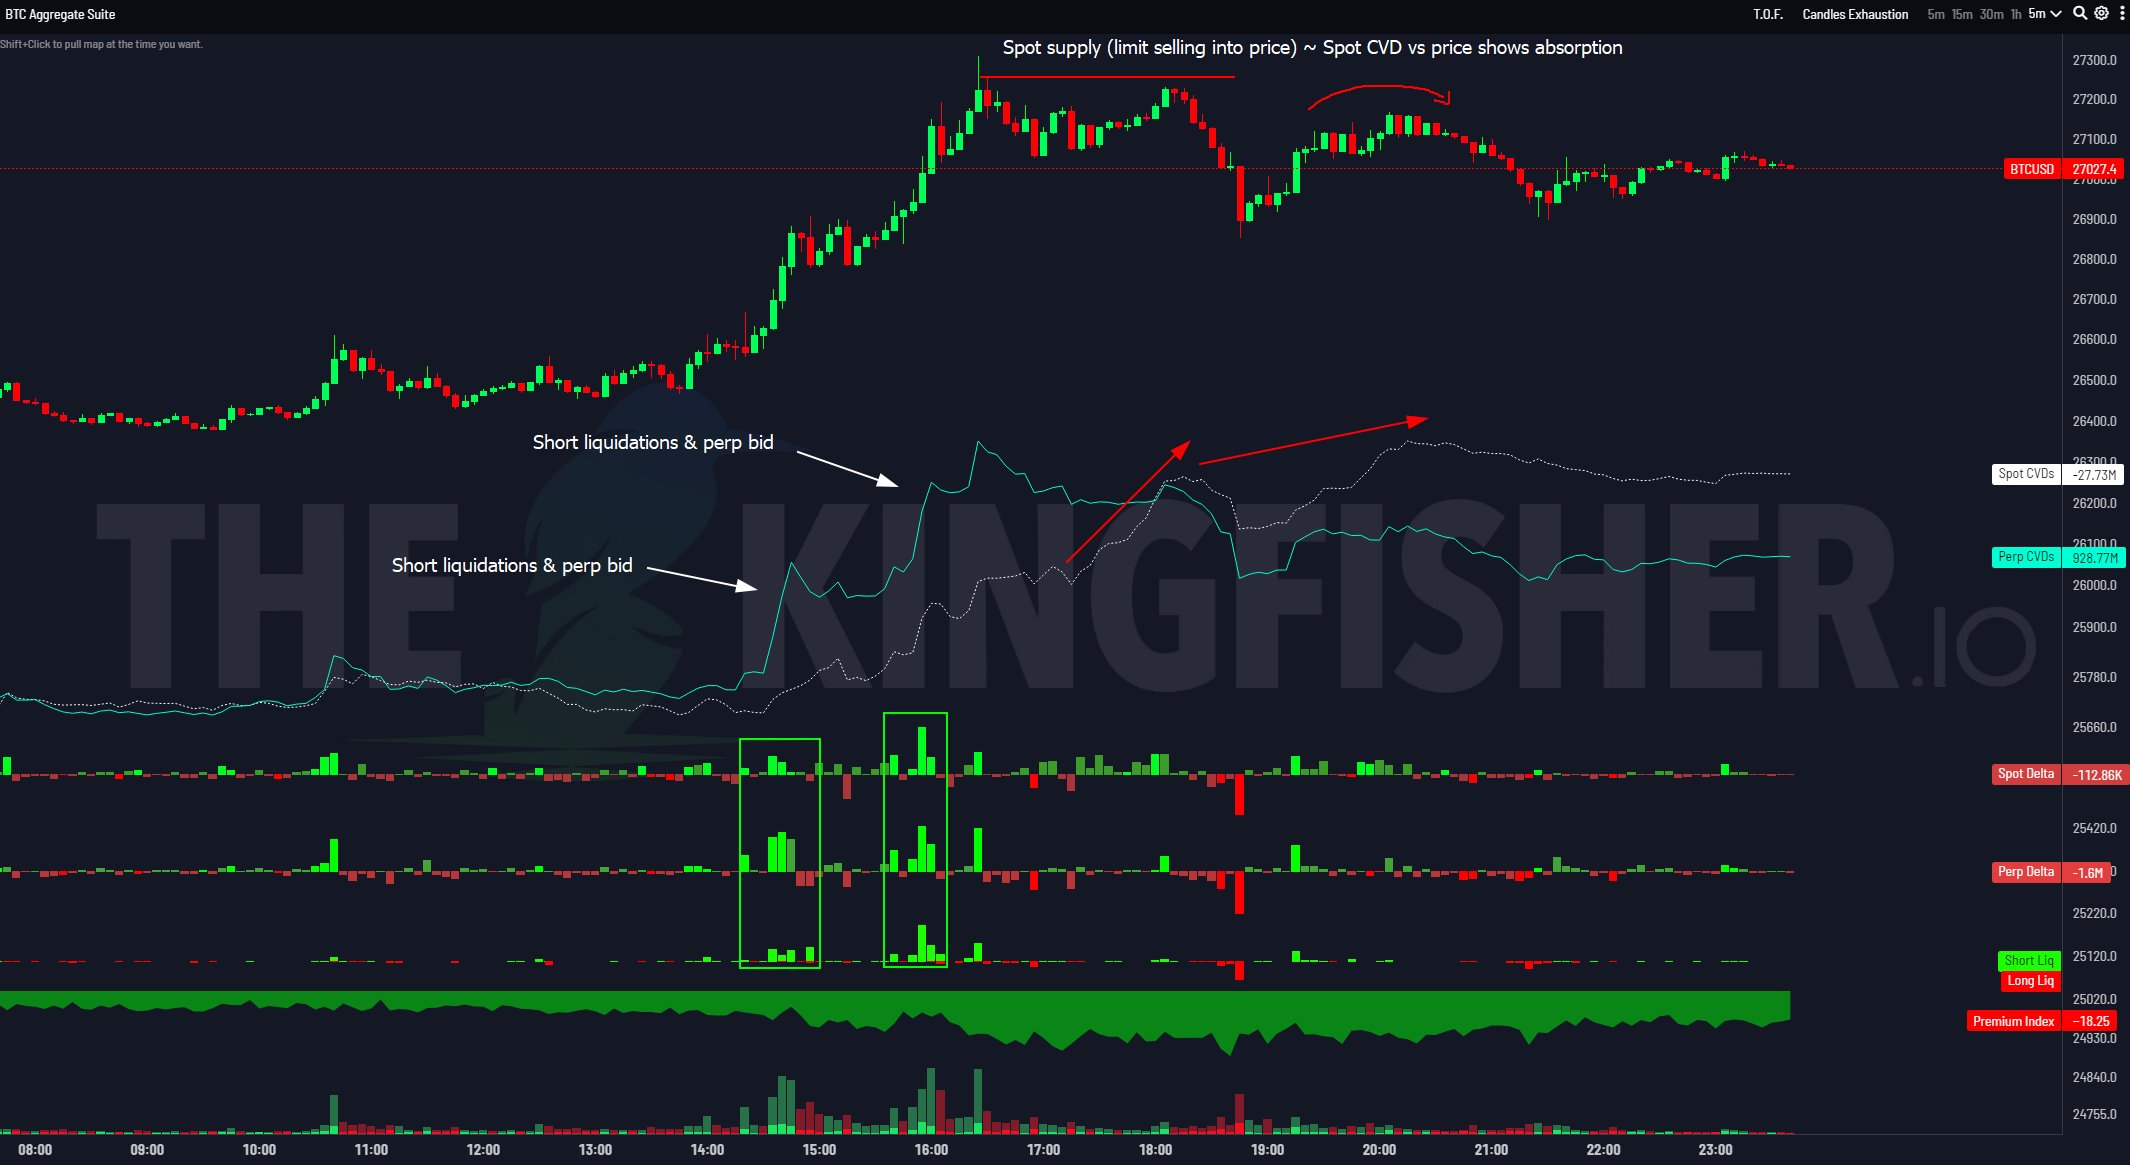
Several analysts have offered insights into the recent upward trajectory. Renowned crypto specialist Skew elucidated on Twitter, “BTC Aggregate CVDs & Delta: Lower timeframe stuff but pretty clear spot absorption around the high, so $27.2K is an important price area to clear for spot buyers. Most of the push up was perp driven with spot trailing price (short liquidations & strong perp bid).”
Skew’s chart unveils that the momentum was predominantly backed by short liquidations and sturdy bids in the perpetual markets. Upon touching the $27,200 threshold, spot market selling began, indicating a potential local zenith for the Bitcoin price.
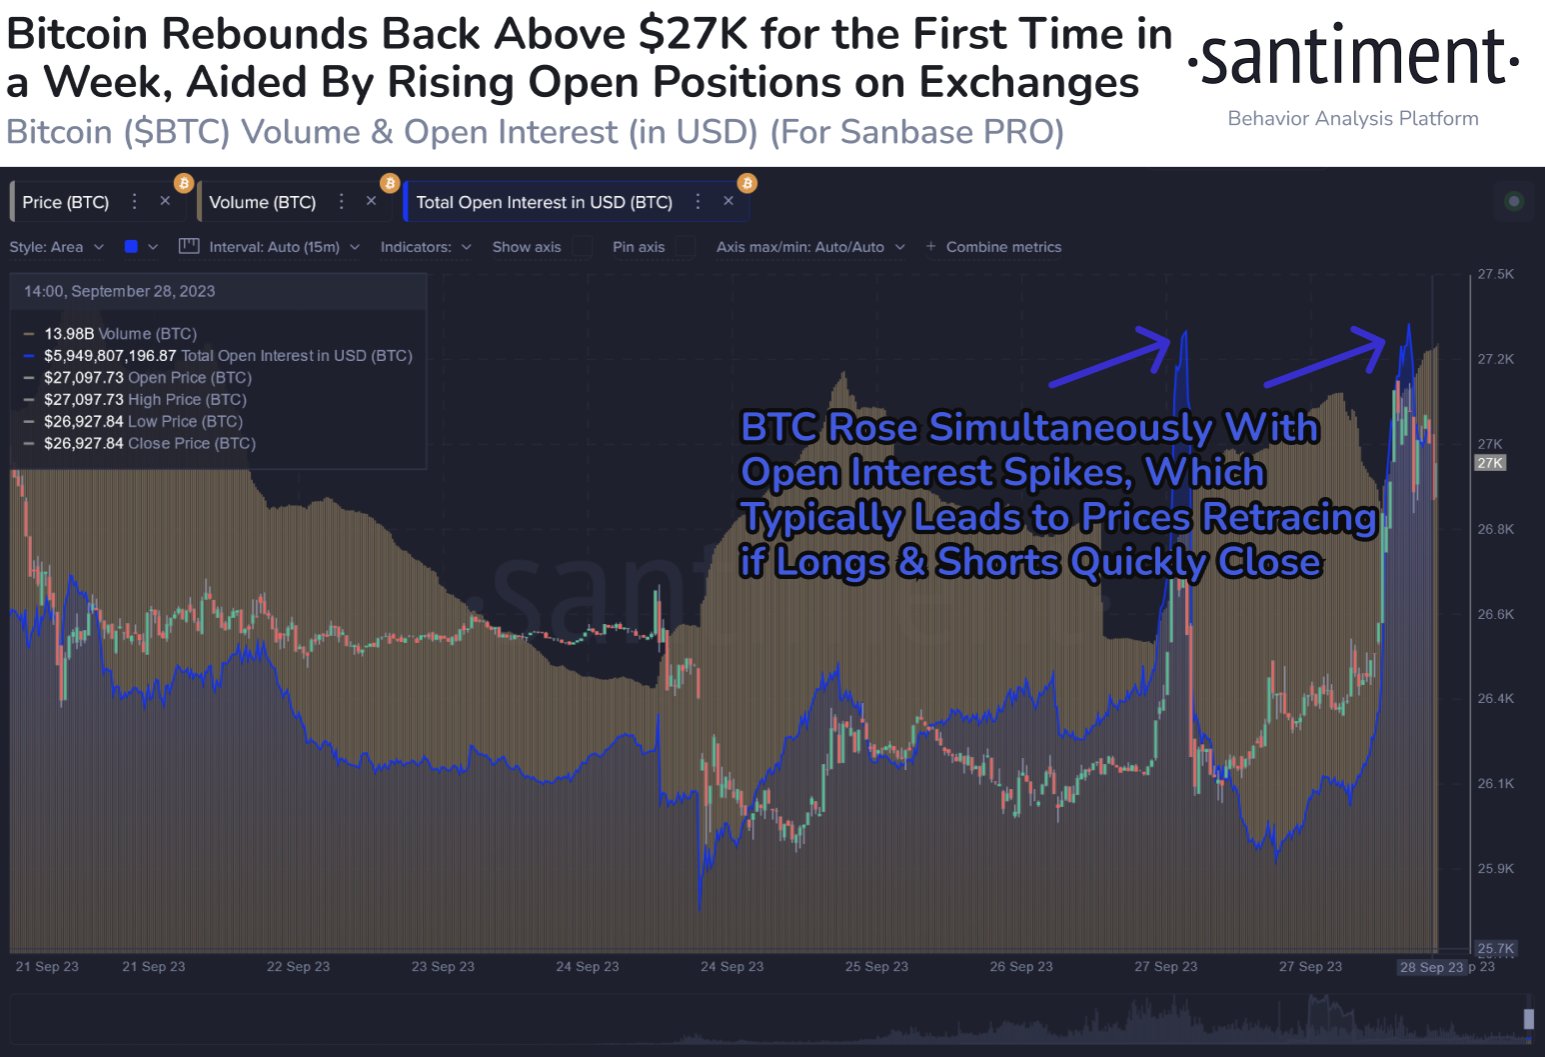
Complementing the data, on-chain analytics firm Santiment confirmed that open long and short Bitcoin positions surged as Bitcoin’s price enjoyed a bullish Thursday. The chart shared by Santiment correlates Bitcoin’s ascent with the augmented open interest in the futures market.
“After a quick price retrace after those longs & shorts quickly closed yesterday, they have remained high today, allowing prices to maintain their levels,” the on-chain tracker said.
On a bullish note, Santiment commented that Bitcoin sharks and whale addresses, which are defined as 10-10,000 BTC wallets, have now accumulated to their highest amount held in 2023, amounting to 13.03 million BTC. Additionally, Tether sharks and whales are accumulating buying power. “This is generally a bullish combination,” Santiment remarked.
Nonetheless, the analysis firm also sounded a note of caution: “The long-term outlook is bright for Bitcoin with whales accumulating BTC & USDT. However, watch for a short-term correction, with traders profit taking heavily as $27K hit Thursday. When the 7D MVRV gets below 0, that may be ideal for another leg up.”
Their data further highlights that during yesterday’s significant move, Bitcoin showcased its highest on-chain profit/loss mark in the past quarter, which usually hints at an impending short-term correction.
DaanCrypto, another industry pundit, remarked during the price flux, “Bitcoin Price up, Spot Premium up, Funding down. This move has seen a strong sustained spot bid so far which is looking quite healthy as we speak.”
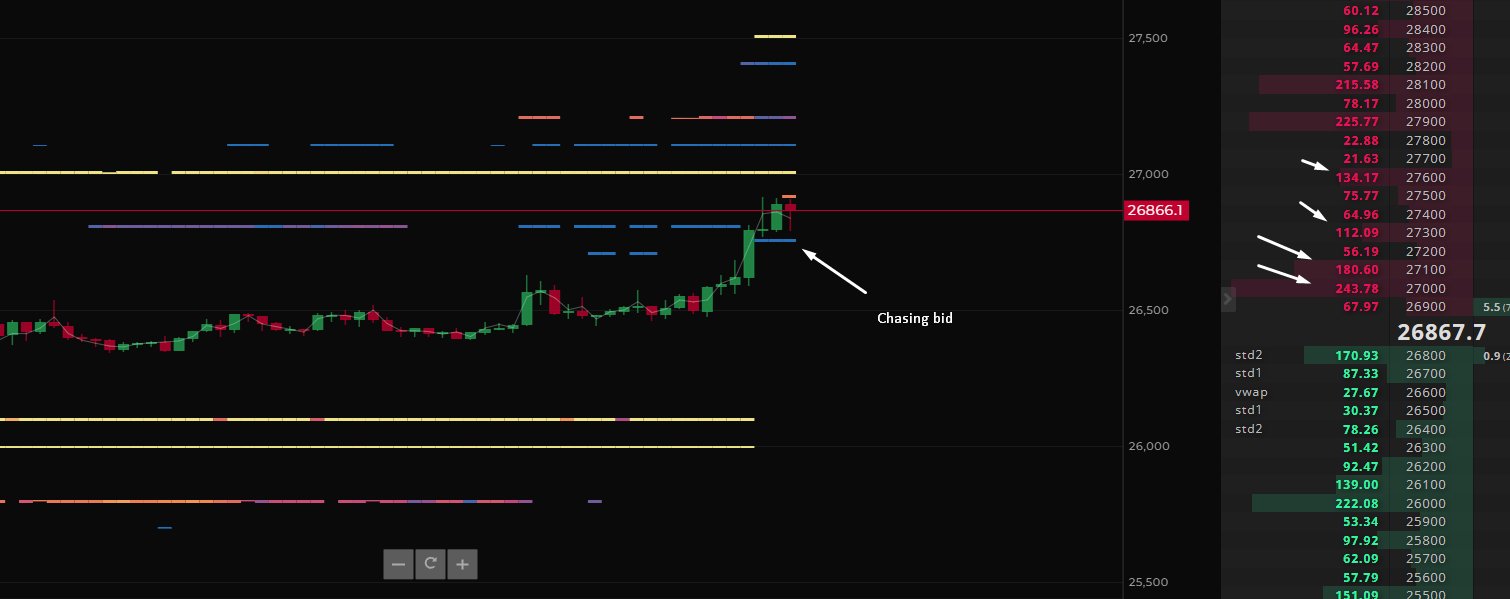
Similarly, renowned crypto analyst Exitpump chimed in during the price crescendo with the observation, “BTC Binance spot orderbook: Noticed chasing bid on the book with big asks stacked slightly above the price, it’s getting interesting. Maybe a spoof buy wall, but I think that it just grinds higher.”
What’s Next For BTC Price?
As described in one of our last analyses, the Bitcoin price is facing a crucial monthly close tomorrow, Saturday. Rekt Capital, a seasoned crypto analyst, recently spotlighted the significance of Bitcoin’s approaching monthly candle close.
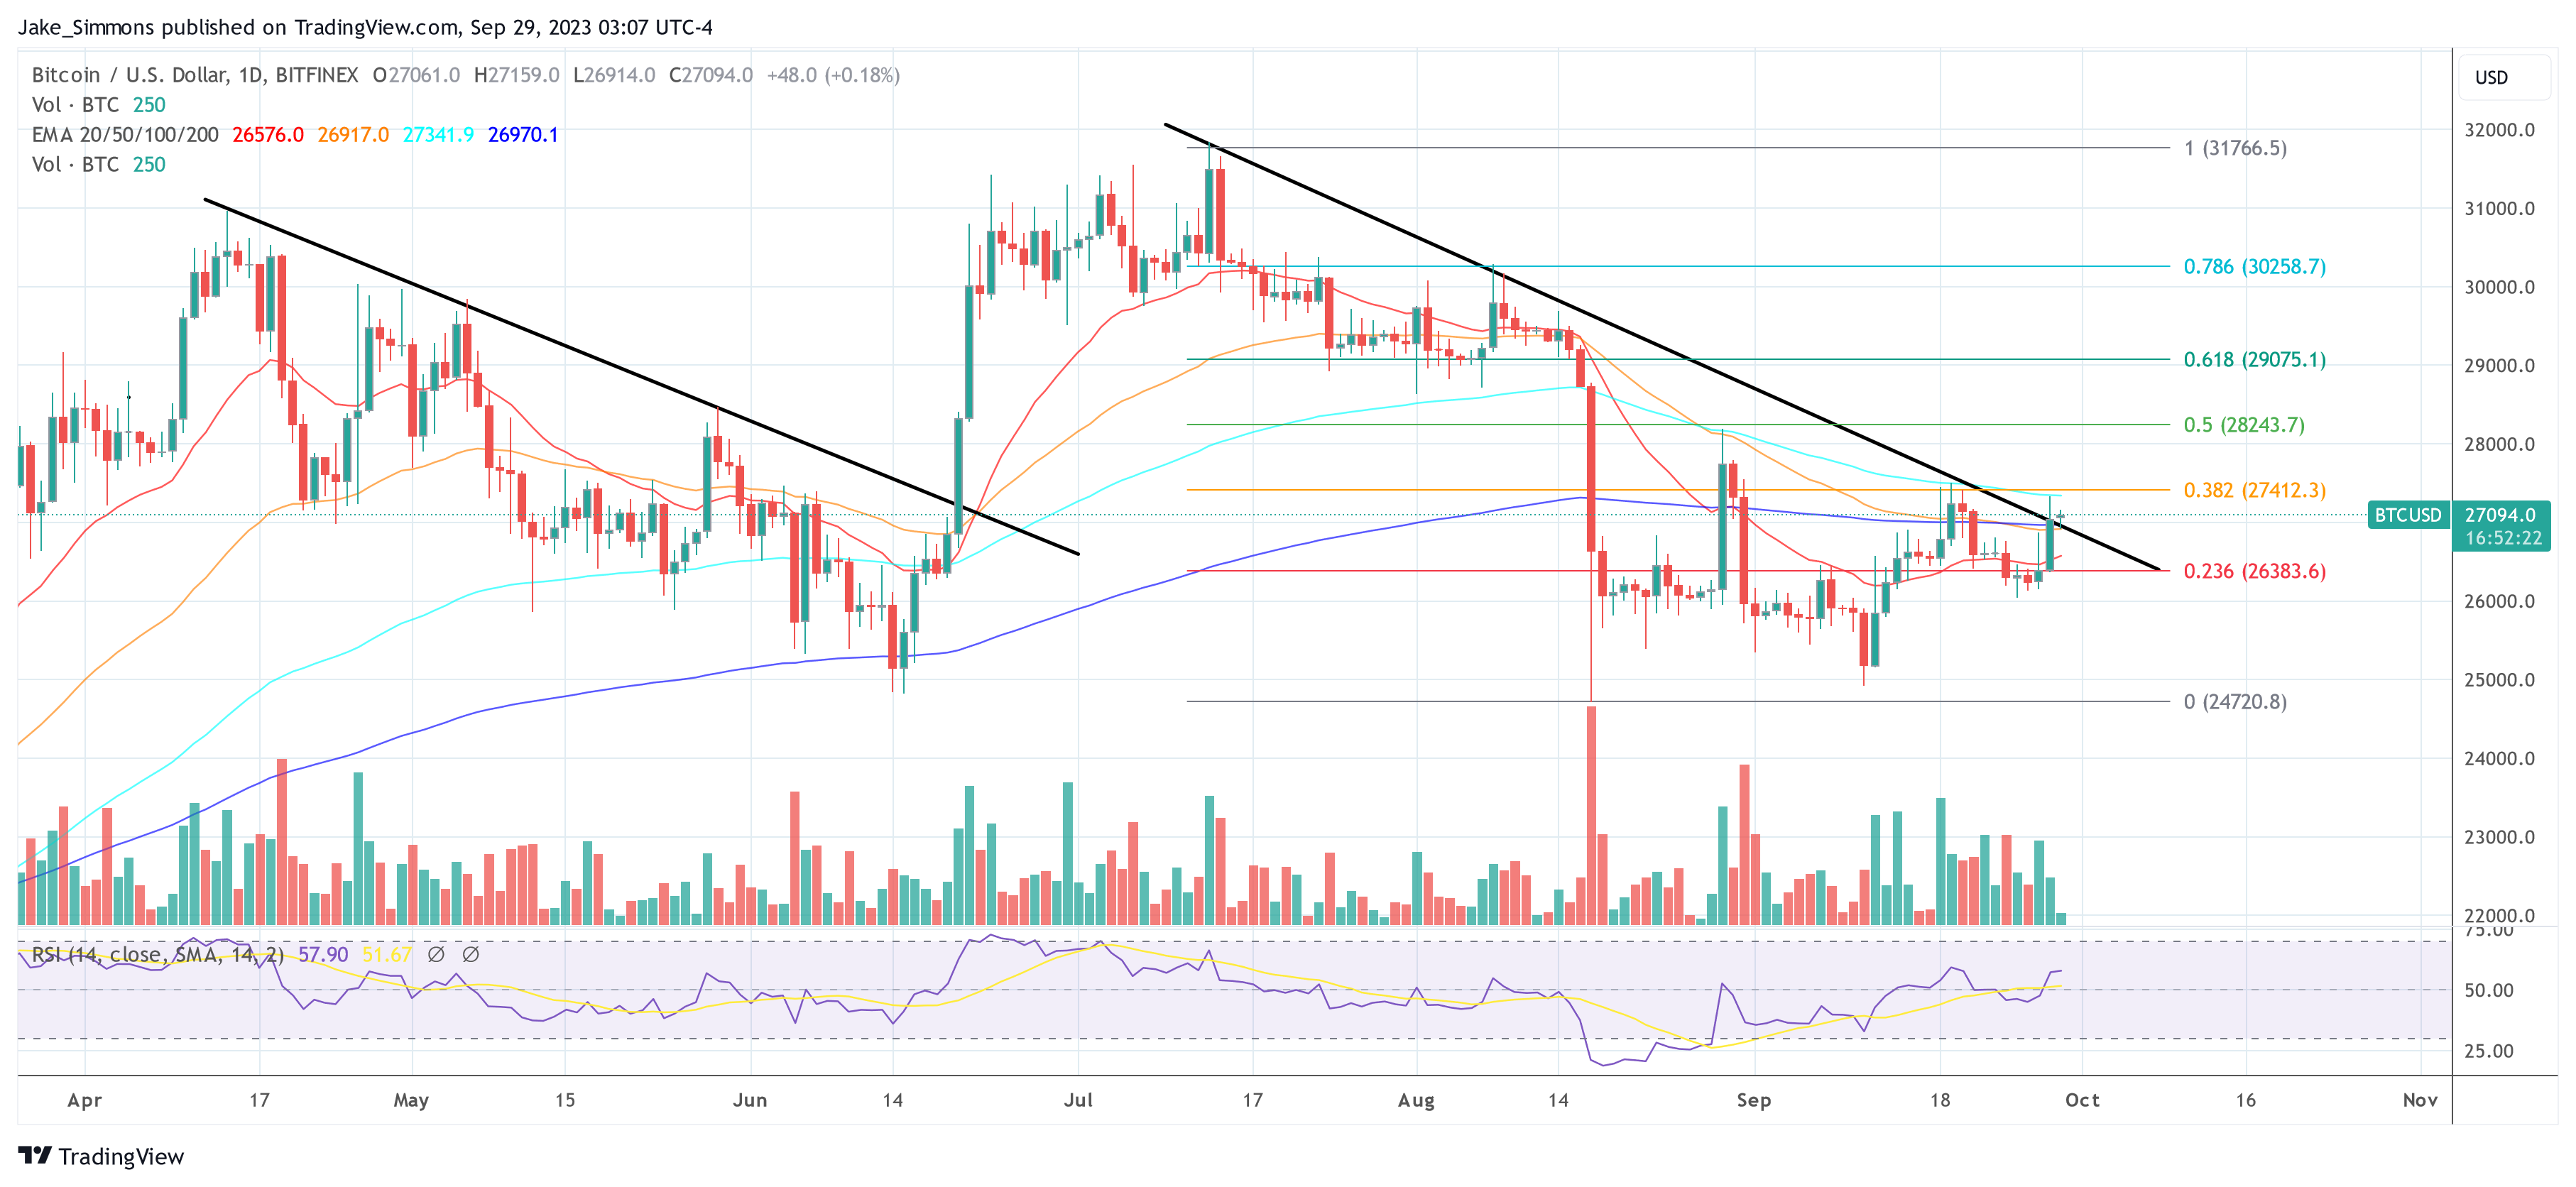
Via X, he emphasized that Bitcoin is currently treating the $27,000 mark as a resistance. He elaborated, “Bitcoin needs to monthly close above $27,091 for this to be a fake-breakdown. Otherwise, the breakdown will be technically confirmed.” In this case, a fall toward $23,000 could be imminent.
On the 1-day chart, Bitcoin is showing strong bullish momentum today. The BTC price has managed to break the (black) trend line. The task today is to defend the re-test. If it succeeds, a monthly close above $27,100 seems very likely, and a rally similar to June could be possible.
Ether Bears Lose $11M as ETF Hopes Lift ETH Prices
There’s a “90% chance” an ether futures ETF will be traded in the first week of October, one analyst said.
Maker (MKR) Inks 20% Price Advance, Leads Top 50 Coins Today
Maker (MKR) is currently making waves in the cryptocurrency market with an impressive surge in value. Over the past month, MKR has exhibited remarkable growth, experiencing a substantial 40% increase in price. Today, the crypto flexes its muscle and leads the roster of top 50 coins.
One noteworthy development amidst this rally is the strategic maneuver executed by a prominent crypto whale. This entity recently deposited 3,527 MKR tokens on the Binance exchange, capitalizing on the upward trajectory of MKR’s price.
This shrewd move has boosted the whale’s total MKR holdings to an impressive 10,000 tokens, resulting in a staggering $5.12 million in profits. This remarkable increase in value underscores the attractiveness of MKR as a lucrative investment in the current crypto landscape.
The price of $MKR has increased by ~40% in the past 1 month and topped $1,500 today.
A smart whale deposited 3,527 $MKR($5.27M) to #Binance to make a profit an hour ago.
And currently has 10,000 $MKR($14.9M) left, the total profit is ~$5.12M(+34%).https://t.co/4atyyejMwJ pic.twitter.com/SyEBI3pNg4
— Lookonchain (@lookonchain) September 28, 2023
Maker: Impressive Metrics And Bullish Indicators
As of the latest data from CoinGecko, MKR is currently trading at $1,553, reflecting a notable 4.1% gain in the past 24 hours and an impressive seven-day surge of 20%. What sets this rally apart is the consistency in MKR’s price patterns, characterized by higher highs and higher lows, a clear indicator of a bullish trend in the market.
The Relative Strength Index (RSI), according to recent price analysis, lends further credence to this bullish sentiment, with a reading of 79.34, indicating robust bullish momentum surrounding the MKR token.
#Maker‘s price has now surged +40% in the past 16 days with its active addresses hitting a 10-week high in tandem with the asset crossing $1,500. An inflow of $MKR moving to exchanges is something to be cautious of for at least a temporary local top. https://t.co/oFeijYNZCO pic.twitter.com/rStBGX6TdM
— Santiment (@santimentfeed) September 28, 2023
In addition to the price surge, data provided by Santiment reveals that the number of active MKR addresses has reached a 10-week high. This not only signifies an influx of new users into the Maker ecosystem but also highlights heightened activity among existing supporters of the protocol.
MKR Breaches $1,500 Barrier
Interestingly, this surge in activity coincided with MKR’s price surpassing the $1,500 threshold, suggesting a correlation between price action and increased user engagement.
However, amid the optimism, Santiment issues a cautionary note for MKR investors. They emphasize the importance of vigilance concerning the current influx of tokens to exchanges, as this trend may foreshadow a potential market correction in the short term.
While the current bullish momentum is undeniable, investors should remain cautious and mindful of the potential market dynamics in the coming days.
(This site’s content should not be construed as investment advice. Investing involves risk. When you invest, your capital is subject to risk).
Featured image from Shutterstock
Circle Intervenes in Binance’s SEC Case, Argues Stablecoins Aren’t Securities
Stablecoins alone can’t be considered securities, argues the USDC issuer, supported by former commodities regulator Heath Tarbert.
Epic Games lays off 830 staff, citing ‘unrealistic’ metaverse ambitions

“Spending way more than we earn” — CEO Tim Sweeney blamed job cuts on major structural changes to the company’s economics.
How long could Sam Bankman-Fried go to jail for?

“I think he’ll get the maximum sentence” — one lawyer predicts the former FTX CEO could look at life behind bars if convicted of all seven charges.
Tron Price Prediction: TRX Bulls Keeps Pushing, Why Rally Isn’t Over Yet
Tron price is gaining pace above $0.0850 against the US Dollar. TRX is outperforming Bitcoin and could rise further toward $0.092.
- Tron is moving higher above the $0.0850 resistance level against the US dollar.
- The price is trading above $0.0862 and the 100 simple moving average (4 hours).
- There is a major bullish trend line forming with support near $0.0855 on the 4-hour chart of the TRX/USD pair (data source from Kraken).
- The pair could continue to climb higher toward $0.092 or even $0.095.
Tron Price Regains Strength
In the last Tron price analysis, we discussed the chances of more gains in TRX against the US Dollar. TRX remained stable, outperformed Bitcoin, and traded above the $0.082 resistance level.
The bulls were able to pump the price above the $0.0825 and $0.0850 resistance levels. A high was formed near $0.0879 and the price is currently consolidating gains. The current price action suggests that the price could climb further higher above $0.088.
It is now trading well above the 23.6% Fib retracement level of the upward move from the $0.0820 swing low to the $0.0879 high. TRX is also trading above $0.0865 and the 100 simple moving average (4 hours). There is also a major bullish trend line forming with support near $0.0855 on the 4-hour chart of the TRX/USD pair.
On the upside, an initial resistance is near the $0.088 level. The first major resistance is near $0.0920, above which the price could accelerate higher. The next resistance is near $0.095.
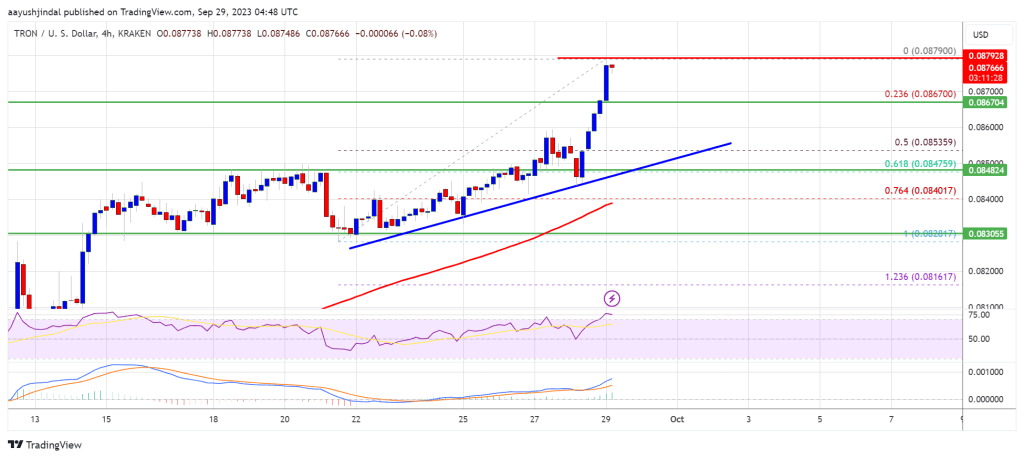
Source: TRXUSD on TradingView.com
A close above the $0.095 resistance might send TRX further higher toward $0.10. The next major resistance is near the $0.105 level, above which the bulls are likely to aim for a larger increase toward $0.112.
Are Dips Limited in TRX?
If TRX price fails to clear the $0.088 resistance, it could start a downside correction. Initial support on the downside is near the $0.0867 zone. The first major support is near the $0.0855 level or the trend line.
The trend line is near the 50% Fib retracement level of the upward move from the $0.0820 swing low to the $0.0879 high, below which it could test the 100 simple moving average (4 hours). The next major support is $0.0830.
Technical Indicators
4 hours MACD – The MACD for TRX/USD is gaining momentum in the bullish zone.
4 hours RSI (Relative Strength Index) – The RSI for TRX/USD is currently above the 50 level.
Major Support Levels – $0.0867, $0.0855, and $0.0830.
Major Resistance Levels – $0.0880, $0.0920, and $0.0950.
Ethereum Price Registers Breakout But Lacks Momentum, $1,620 Is The Key
Ethereum price is attempting a fresh increase above $1,650 against the US Dollar. ETH could accelerate higher if it clears the $1,670 resistance.
- Ethereum is attempting a fresh increase above the $1,620 level.
- The price is trading above $1,620 and the 100-hourly Simple Moving Average.
- There is a key bullish trend line forming with support near $1,645 on the hourly chart of ETH/USD (data feed via Kraken).
- The pair could continue to rise if it clears the $1,670 resistance zone.
Ethereum Price Climbs Higher
Ethereum’s price formed a base above the $1,580 level. ETH remained stable and climbed above the $1,620 resistance zone to move into a positive zone, like Bitcoin.
There was a move above the $1,650 level but upsides were limited. A high was formed near $1,667 and there was a minor downside correction. The price is now trading near the 23.6% Fib retracement level of the upward move from the $1,583 swing low to the $1,667 high.
Ethereum is trading above $1,640 and the 100-hourly Simple Moving Average. There is also a key bullish trend line forming with support near $1,645 on the hourly chart of ETH/USD.
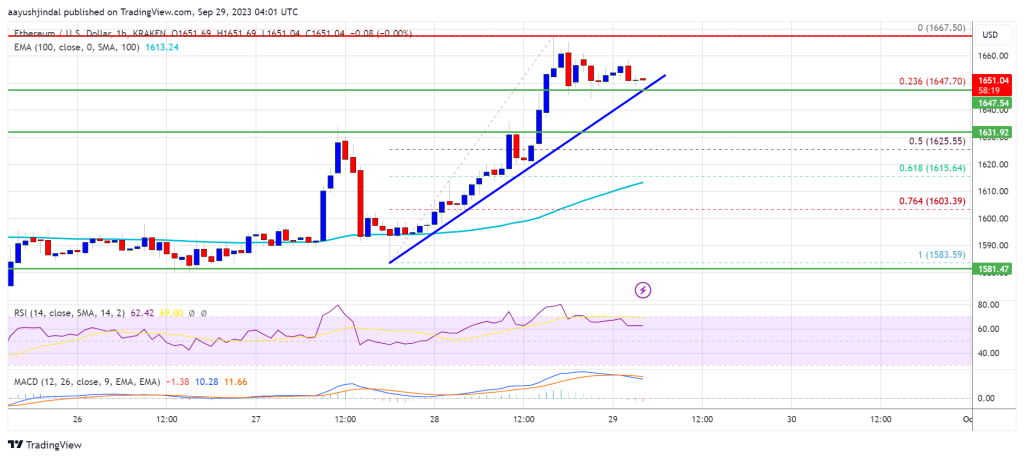
Source: ETHUSD on TradingView.com
On the upside, the price might face resistance near the $1,670 level. The next major resistance is $1,720. A clear move above the $1,720 resistance zone could set the pace for a larger increase. In the stated case, the price could visit the $1,800 resistance. The next key resistance might be $1,820. Any more gains might open the doors for a move toward $1,880.
Are Dips Limited in ETH?
If Ethereum fails to clear the $1,670 resistance, it could a downside correction. Initial support on the downside is near the $1,645 level and the trend line.
The next key support is $1,620 or the, below which the price could test the $1,600 support. A downside break below the $1,600 support might start another bearish wave. In the stated case, there could be a drop toward the $1,540 level.
Technical Indicators
Hourly MACD – The MACD for ETH/USD is losing momentum in the bullish zone.
Hourly RSI – The RSI for ETH/USD is now above the 50 level.
Major Support Level – $1,620
Major Resistance Level – $1,670
SBF trial dates revealed: FTX founder to stand trial over 6 weeks

In a hearing, Assistant U.S. Attorney Danielle Kudla said the Department of Justice estimated the case could last four to five weeks.


