
Mark Cuban confirmed that he was hacked, but doesn’t appear to know exactly how it happened as of yet.
Cryptocurrency Financial News
Mark Cuban confirmed that he was hacked, but doesn’t appear to know exactly how it happened as of yet.
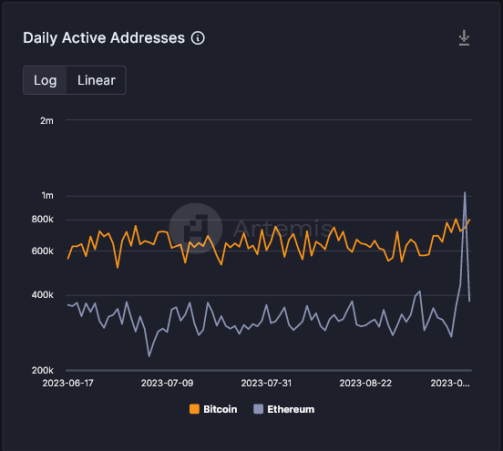
Ethereum might be the king of smart contracts and the world’s primary hub for decentralized finance (DeFi) and non-fungible tokens (NFTs) activity but onchain data suggests that Bitcoin is ahead in user engagement, interpreted by the number of daily active users, and network activity is at acceptable, healthy levels, reading from the number of daily transactions confirmed.
According to Artemis Terminal data on September 15, Bitcoin, despite being predominantly a transactional layer, enabling the peer-to-peer (P2P) transfer of value between addresses, has more daily active users than Ethereum.
This observation is even as Ethereum serves as a conduit of value since assets can be moved, just like in Bitcoin, and a smart contract platform for deploying trustless and automated decentralized applications (dapps). Some, like Uniswap, a decentralized exchange (DEX), process billions worth of transactions every month.
On September 15, Bitcoin had over 800,000 daily active addresses (DAA), more than twice those in Ethereum, which stood at slightly over 378,000. The only time there was a slight change was on September 13, when over 1 million addresses were activated on Ethereum.
Then, the number of DAA on Bitcoin also fell to around 743,000. However, the DAA on Ethereum has fallen sharply while Bitcoin has maintained an upward trajectory since late August. During this time, Ethereum’s DAA has been fluctuating heavily, as evidenced by the rise and fall on Sep 13 and through to today.
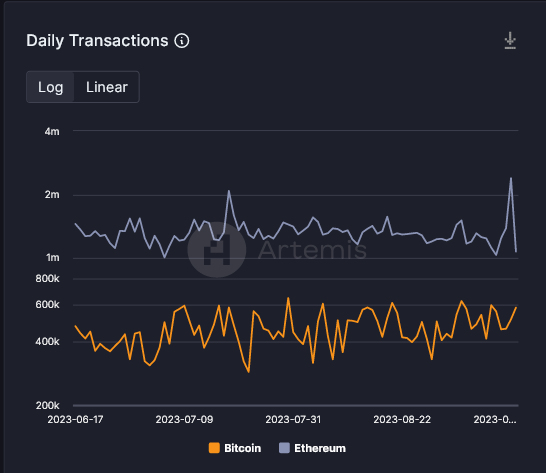
Ethereum shines in the number of daily transactions processed. When writing on September 15, the smart contract platform had processed over 1 million transactions while Bitcoin lagged, confirming less than 600,000.
Even at this level, Ethereum has processed less than half of what it did on September 13, when the network processed over 2.3 million transactions. On the other hand, Bitcoin’s daily transactions have been steady, while those of Ethereum have, on average, risen over the past three months, as Artemis Terminal data shows.
DAA and daily transaction count are important metrics that on-chain analysts use to analyze the level of engagement and health of public blockchains.
Over the past 18 months, activity has rapidly shrunk as asset prices fall in the crypto winter. Ethereum’s drop from around $5,000 in late November 2021 to as low as $1,500 in 2022 weighed negatively on DeFi and NFT activity.
According to DeFiLlama, the total value locked (TVL) of DeFi protocols has stabilized below $50 billion, down from around $180 billion in 2021. Meanwhile, trading volume has crashed by over 90%, dragging the value of NFT-related projects, including Immutable X and ApeCoin. To illustrate, APE is down 96% from peaks.
In a Friday 15 court filing, Gemini, the US-based crypto exchange platform, has accused Digital Currency Group (DCG) of engaging in “fraudulent activities” and attempting to evade responsibility for the harm caused to creditors.
The filing directly responds to a statement made by DCG regarding a proposed agreement between DCG, the debtors, and the Official Committee of Unsecured Creditors.
According to Gemini, DCG devised a $1.1 billion promissory note to conceal the significant financial losses caused by the collapse of Three Arrows Capital (3AC).
However, DCG allegedly kept the actual terms of the note “hidden,” leading to misleading representations to Gemini’s creditors. Furthermore, the company claims that DCG borrowed a substantial amount of Bitcoin (BTC) from the company instead of providing much-needed capital.
Gemini also highlights that DCG is now unwilling to repay the more than $630 million it borrowed from the company, which was due several months ago in May.
In response, as reported by NewsBTC, DCG has proposed a deal that would require Genesis creditors, including Gemini, to extend years of credit to DCG. However, Gemini intends to fight against this proposal, asserting that DCG should pay creditors a just and adequate amount.
Gemini argues that DCG has attempted to “wear down” creditors over the past ten months, hoping they would settle for a significant reduction in the amount owed.
According to the court filing, Gemini is determined not to succumb to these tactics and will continue to pursue a fair resolution.
In the filing, Gemini criticizes DCG’s proposed recovery rates, claiming they are “misleading and deceptive.” The company argues that receiving fractional shares of interest and principal payments over seven years from a risky counterparty is not equivalent to receiving the actual cash and digital assets owned by Genesis.
Gemini demands that DCG significantly improve the terms of the loans it provides if it wishes to gain the support of the harmed individuals.
Overall, Gemini accuses DCG of being the architect of its subsidiary’s insolvency and “sacrificing” the exchange and its creditors to shield itself from liability.
The company founded by the Winklevoss twins asserts that DCG’s delay tactics have hindered progress in distributing funds to Gemini Lenders, despite Gemini’s offer of a $100 million premium for a swift resolution.
It is worth noting that the court filing by Gemini comes after months of negotiations with the crypto lender and DCG and the collapse of the Gemini Earn program, which resulted in lawsuits and severed ties between Digital Currency Group and the crypto exchange.
Featured image from iStock, chart from TradingView.com

Despite Brian Shroder resigning as CEO of the exchange’s US wing amid SEC and CFTC lawsuits, Binance CEO Changpeng Zhao claimed that the departure was normal.
Since its inception, Ethereum has continuously been compared to Bitcoin with the former being hailed as a better option to the latter in some cases. As the years have flown by, the competition has gotten even fiercer, especially with ETH growing rapidly. Eventually, Ethereum seems to be catching up with Bitcoin, especially in terms of active addresses.
On Thursday, September 14, on-chain data tracker Santiment revealed a surprising update on the fierce rivalry between Bitcoin and Ethereum. In the X post, the tracker revealed that the number of unique addresses that were transaction on the network had reached its second-highest daily figure of all time.
While this is significant on the part of the blockchain alone, it is also significant in terms of the competition between the two largest assets in the space. To put this in perspective, the 1,089,893 figure reported by Santiment puts Ethereum ahead of Bitcoin in terms of this metric alone.
The last time that the daily unique active addresses on the network hit its new all-time high was back in December 2022. So it has been almost a year since the metric was this high, suggesting a unique driving factor behind it.
This report is also in line with the report from Artemis Terminal that shows that Ethereum was right in front of Bitcoin in terms of daily active addresses.
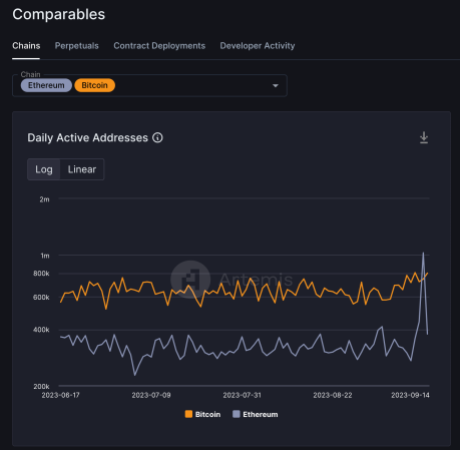
Artemis reports that on September 13, Ethereum saw a total of 1.03 million daily addresses compared to Bitcoin’s 743,800 addresses in the same time period. However, this figure has since retracted and Bitcoin has pulled in front of Ethereum once more as of September 14.
While Ethereum’s surge on Wednesday was impressive, it does not mean much since the network has been unable to sustain the growth. Also, the surge could be easily explained by the rise in the popularity of the Friend.Tech decentralized finance social media platform based on the Ethereum blockchain.
Friend.Tech had seemingly come back from the death to reach a new all-time high in its number of daily users. Since an ETH address is required to participate in the platform, it is no surprise there was an uptick in the number of ETH addresses active on the network.
The spike in the number of daily active addresses also seems to have had little impact on the price of the cryptocurrency itself. ETH’s price is still struggling to hold above $1,600, with small gains of 0.35% in the last day and losses of 1.15% in the last week.
Binance crypto exchange announced in late August that it is moving to end support for its beloved BUSD stablecoin. This move comes amid the stablecoin’s run-in with regulators, leading to a halt in its production. And now, the exchange has started moving to begin the end of support for the stablecoin.
Binance took to its official X (formerly Twitter) account on Thursday, September 14, to announce that it would begin burning a number of Binance-pegged tokens. Among the five tokens listed to be burned, four were BUSD tokens across different blockchains.
According to the announcement, the Binance-pegged tokens would be burned on the listed blockchains, and then the exchange would release the equivalent amount of tokens that were initially used as collateral on their native networks.
Later today, #Binance will burn a number of idle Binance-pegged tokens.
The equivalent amount of tokens on their native networks, which were used as collateral, will then be released.
Tokens:
TUSDOLD (BSC)
— Binance (@binance) September 14, 2023
The BUSD tokens listed across four networks include BUSD on the Polygon (MATIC) network, BUSD on the Tron (TRX) network, BUSD on BSC, and BUSD (BNB). In addition to these, the exchange also revealed that the TUSDOLD on BSC would be burned as well, making it the only token on this list that is not BUSD.
The collateral in this case will be the equivalent of the Binance-pegged tokens that are burned. So if 1,000 BUSD on the MATIC network is burned, then the equivalent on the native blockchain will be released by the exchange.
The BUSD stablecoin first came under fire in early 2023 when the United States Securities and Exchange Commission (SEC) issued a Wells Notice to issuer Paxos alleging that the stablecoin was an unregistered security. The regulator, through this, made its intention to pursue legal action known.
Following the move by the SEC, the New York State Department of Financial Services (NYDFS) asked the issuer to stop printing new tokens. The NYDFS’s concern mainly bordered on Paxos’ relationship with Binance, and eventually, the BUSD issuer decided to cut ties with the crypto exchange.
Since the initial move by regulators, the stablecoin has suffered in terms of usage and market cap. The stablecoin which was once a top 10 crypto by market cap has since seen its market cap decline to $2.5 billion, making it the 26-largest cryptocurrency as of the time of this writing.
Binance has also announced plans to stop offering support for the stablecoin completely by 2024. Paxos also revealed that it will cease all BUSD redemptions in February 2024, and Binance’s complete withdrawal is expected to come shortly after this.
Nevertheless, the stablecoin continues to maintain its dollar peg quite well. It is still trading at a 1:1 parity with the United States dollar and has rarely dipped below $1 amid the regulatory storm.

The U.S. attorney sees no reason for potential jurors to discuss effective altruism or ADHD, among other things, before trying SBF.

Lawyers representing Gemini Trust filed a response in bankruptcy court to Digital Currency Group’s plan claiming to offer unsecured creditors a “70–90% recovery.”
Crypto Michael, a cryptocurrency analyst in the crypto space, has recently shared some insights on the possible market trend of the Bitcoin (BTC) price before the halving commences. These insights were shared in a video uploaded on the analyst’s YouTube channel.
According to the recent revelations by Crypto Michael, Bitcoin might be on the brink of a new bull run. In his video, which has garnered over 2,000 views on YouTube, the analyst suggests that the cryptocurrency shows considerable resilience and potential for a surge.
This optimism stems from various indicators and patterns observed in Bitcoin’s price action. It’s not just Bitcoin’s impending rise that Crypto Michael has highlighted.
The analyst also mentions that the altcoin market is warming up for a possible upward trend. The expert believes the significance of this parallel bullish movement for altcoins cannot be underestimated.
It is worth noting that a comprehensive bull market, including both Bitcoin and its altcoin counterparts, could mean significant gains for diversified crypto portfolios.
Diving deeper into his analysis, Crypto Michael predicts a potential Bitcoin price of $45,000 before the much-anticipated halving event next year. A halving is crucial in the Bitcoin network, where miners’ rewards for adding new blocks to the blockchain are cut in half.
This event typically decreases supply and can significantly influence Bitcoin’s price. Historically, the crypto market has experienced bullish trends before and after halvings.
This cyclical behavior has been observed in the past two halvings, with price surges leading up to and following the event. However, the current market dynamics have left investors in a speculative state, pondering if history will repeat itself.
Particularly, Bitcoin has shown a bearish trend over the past month, down by nearly 10%. The asset plunged from its high of $30,000 in late July to as low as trading just above $25,000 on Monday. However, Bitcoin’s price can be seen to show signs of recovery in the past few weeks.
The asset trades above $26,000 at the time of writing, with a price of $26,338 and a market cap of $513 billion today. Notably, Bitcoin’s market cap is currently up by more than $10 billion compared to its recent market cap value of below $500 billion, seen earlier this month.
It is worth noting that while its market cap and price have surged over the past two weeks, the asset’s trading has trended in the opposite direction. Particularly, Bitcoin’s daily trading volume has plunged from the $18 billion seen earlier this month to as low as $10 billion, in the last 24 hours.
Featured image from iStock, Chart from TradingView

This week’s Crypto Biz looks at PayPal’s crypto gateway, Franklin Templeton’s BTC ETF filing, Coinbase’s Lightning Network integration, and Meta’s plans for a new AI model.

The documents filed Aug. 28 may be seen by the public in a week. They are not all the sealed documents in the case, however.
One year has passed since the Ethereum (ETH) Merge, which marked the integration of Ethereum’s proof-of-stake (PoS) Beacon Chain with the Ethereum Mainnet.
This significant milestone facilitated the transition of the Ethereum blockchain from the legacy proof-of-work (PoW) system to a PoS model, giving rise to Ethereum 2.0.
The completion of the Merge on September 15, 2022, brought about a major shift in Ethereum’s energy consumption, with an expected reduction of 99.95%. Additionally, this transition opened up new possibilities for scaling the Ethereum ecosystem.
The merge involved migrating the entire blockchain to new PoS validator nodes, which require participants to stake or lock up 32 Ether (ETH) to participate in the network.
Importantly, this transition did not impact Ether tokens held by investors, and the operations of Ethereum-based applications remained unchanged. As Ethereum celebrated the first anniversary of The Merge, it introduced its latest testnet called Holesky.
Initially known as Holli, the Holesky testnet is designed to enhance the testing environment on Ethereum. Drawing inspiration from a vibrant neighborhood in Prague, Czech Republic, this new testnet offers various improvements over its predecessor, Goerli.
According to a blog post from the software development firm Tatum, Holesky is set to replace Goerli as the primary testnet for staking, infrastructure, and protocol development. For testing decentralized applications, smart contracts, and other Ethereum Virtual Machine (EVM)-related functions, the Sepolia testnet remains the preferred choice.
Holesky, on the other hand, serves as Ethereum’s merged-from-genesis public testnet, mirroring mainnet functionalities and enabling precise evaluations through thorough staking trials, infrastructure assessments, and direct protocol developer testing. To ensure rigorous testing, Holesky aims to have twice as many active validators as the main Ethereum network.
The network starts with a solid foundation of 1 million validators, encouraging teams to run a substantial number of validators, with each team handling around 100,000 validators. These measures contribute to the comprehensive evaluation of the testnet and intended functionality.
According to Tatum’s blog post, by introducing Holesky and refining inflation mechanisms based on the Sepolia testnet, Ethereum continues to evolve and improve its protocols.
In a recent post on X (Formerly Twitter), the self-proclaimed Ethereum Educator, who goes by the pseudonym “Sassal.eth,” highlighted some notable statistics on the first anniversary of The Merge.
One significant achievement for Ethereum since the Merge is burning 980,000 ETH tokens, resulting in a permanent reduction of Ethereum’s total supply. Burning ETH involves removing tokens from circulation, contributing to potential scarcity and value.
Additionally, the Ethereum 2.0 network has seen a significant 11.6 million ETH being staked, which involves locking up ETH as collateral to participate in the proof-of-stake consensus mechanism.
Moreover, according to Sassal, adding 362,000 new validators has strengthened the Ethereum network. Validators are crucial in proposing and validating new blocks, ensuring the network’s security and overall robustness.
On the other hand, Ethereum’s native token, ETH, has experienced a tumultuous journey in terms of its price performance since the beginning of the year. Despite reaching an annual high of $2,144 on April 16, ETH has been impacted by the overall market trend, resulting in significant losses across various time frames.
Currently, ETH is trading at $1,619, representing a 1% decline in the past 24 hours. Similarly, over the past seven days, the token has recorded a decrease of 0.9%.
Looking at the fourteen and 30-day time frames, ETH has experienced declines of 1% and 11.3%, respectively, underscoring the prevailing downward trend for the token’s value.
However, it is worth noting that since the occurrence of The Merge, ETH has witnessed a moderate rise of 7.6% year to date, according to Coingecko data.
Featured image from iStock, chart from TradingView.com
Federal prosecutors are criticizing void dire questions proposed by Sam Bankman-Fried’s defense team.

Documents provided by crypto influencer Tiffany Fong reportedly revealed details about the former FTX CEO’s life under house arrest and his relationship with Caroline Ellison.

Coinbase’s CEO has become the latest ally of the DeFi space, calling for apt regulations of the ecosystem rather than enforcement action by regulatory bodies.

Capital One also joined the investment round, despite being the top client of rival cloud platform Snowflake.
Shiba Inu has been constantly garnering favor among crypto investors since its first price surge back in 2021. Even with the price drop over the last year, the meme coin still features as an investor favorite, surpassing the likes of Cardano and Dogecoin in countries with a large crypto investor presence.
Google Trends has shown that interest in Shiba Inu has surged ahead of that of Dogecoin in Canada and the United States, as well as Cardano. The data which shows the movements over the past 12 months shows points in time where the search for Dogecoin had spiked significantly, leading to a remarkable lead by Dogecoin compared to Shiba Inu and Cardano.
However, as time has passed and periods of brief spikes have been left behind, the trends have indicated that Shiba Inu remains the asset of the three gaining investors’ attention. Since April 2023, SHIB has appeared ahead of both Cardano and Dogecoin with no end in sight for this trend.
In September alone, the interest in Shiba Inu has come out more than double those of Cardano and Dogecoin. Even toward the end of August when the crypto market crashed and interest waned, Shiba Inu went in the opposite direction.
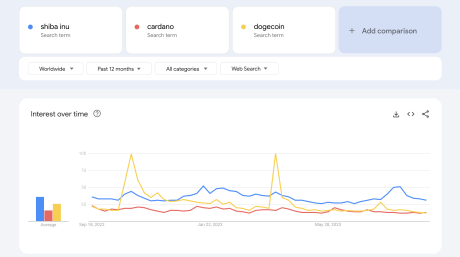
This spike in interest shown in the chart above coincides with the launch of the Shibarium blockchain. The Layer 2 network built atop the Ethereum blockchain was in the works for a long time and when it eventually launched in August, it triggered renewed interest in the SHIB token which currently serves as its official governance token.
While Shiba Inu is leading in terms of interest, it has not translated to profitability for the meme coin’s holders. The percentage of SHIB holders currently seeing any kind of profit is at only 9% compared to 41% for DOGE holders, according to data from IntoTheBlock.
However, SHIB is still doing well compared to Cardano in this regard whose holder base is almost completely submerged in losses. Data shows that ADA holders in profit are sitting at a sad 4%. When put in contrast with SHIB’s numbers which is still disappointing, the meme coin is seeing twice as many holders in profit.
In terms of price performance, all three have performed similarly when comparing their current prices to their all-time prices. SHIB is down 91.49% from its ATH, while Dogecoin and Cardano are down 91.59% and 91.89%, respectively, data from Messari shows.

Marcel Pechman explains the myth of excess cash in U.S. households and the lack of sufficient savings, and how a U.S. government shutdown could impact Bitcoin.

Network, futures and user data all point toward Ether potentially charting a new course.
The world’s largest crypto has bounced from a 3-month low below $25,000 hit on Monday.


