SOL Price Prediction: Solana Surges 15%, Is This Just Start Of A Larger Increase?

Solana is surging above the $23.50 resistance against the US Dollar. SOL price could accelerate further higher if it clears the $25.00 resistance zone.

  • SOL price is up over 15% and it is showing signs of bullish continuation against the US Dollar.
  • The price is now trading below $23.00 and the 100 simple moving average (4 hours).
  • There is a key bullish trend line forming with support near $23.10 on the 4-hour chart of the SOL/USD pair (data source from Kraken).
  • The pair could rise further higher if it clears the $25 resistance zone.

Solana Price Starts Fresh Rally

In the past few days, Solana’s price formed a strong support base above the $18.80 level. SOL started a strong increase after it settled above the $22 resistance zone.

There was a steady increase above the $23.20 resistance, outpacing Bitcoin and Ethereum. It is up over 15% and there was a test of the $24.50 resistance. A high is formed near $24.47 and the price is now consolidating gains. SOL is well above the 23.6% Fib retracement level of the upward move from the $18.75 swing low to the $24.47 high.

It is also trading below $23.00 and the 100 simple moving average (4 hours). Besides, there is a key bullish trend line forming with support near $23.10 on the 4-hour chart of the SOL/USD pair.

SOL Price Prediction

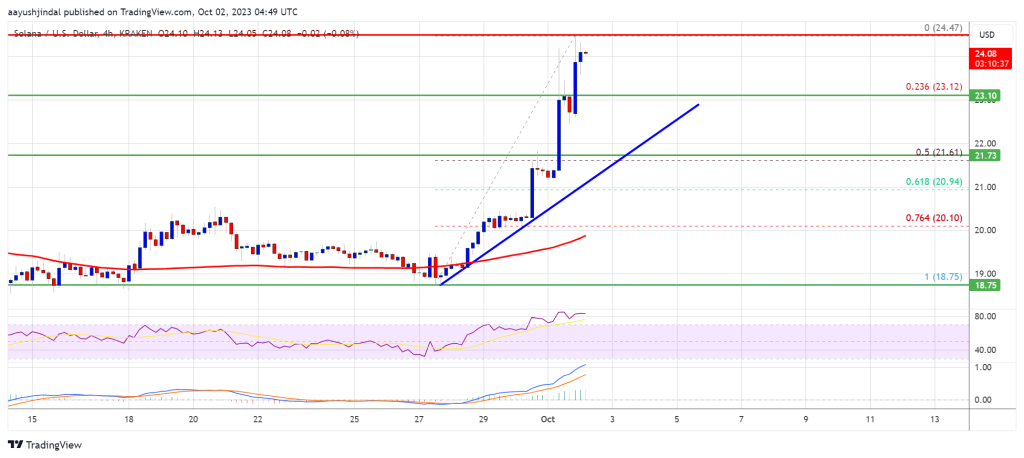
Source: SOLUSD on TradingView.com

On the upside, immediate resistance is near the $24.50 level. The first major resistance is near the $25.00 level. A clear move above the $25 resistance might send the price toward the $27.20 resistance. The next key resistance is near $28.80. Any more gains might send the price toward the $30 level.

Downside Correction in SOL?

If SOL fails to settle above $24.50 and $25.00, it could start a downside correction. Initial support on the downside is near the $23.20 level and the trend line.

The first major support is near the $21.50 level or the 50% Fib retracement level of the upward move from the $18.75 swing low to the $24.47 high. If there is a close below the $21.50 support, the price could decline toward the $20.50 support. In the stated case, there is a risk of more downsides toward the $20.00 support in the near term.

Technical Indicators

4-Hours MACD – The MACD for SOL/USD is gaining pace in the bullish zone.

4-Hours RSI (Relative Strength Index) – The RSI for SOL/USD is above the 50 level.

Major Support Levels – $23.20, and $21.50.

Major Resistance Levels – $24.50, $25.00, and $27.20.
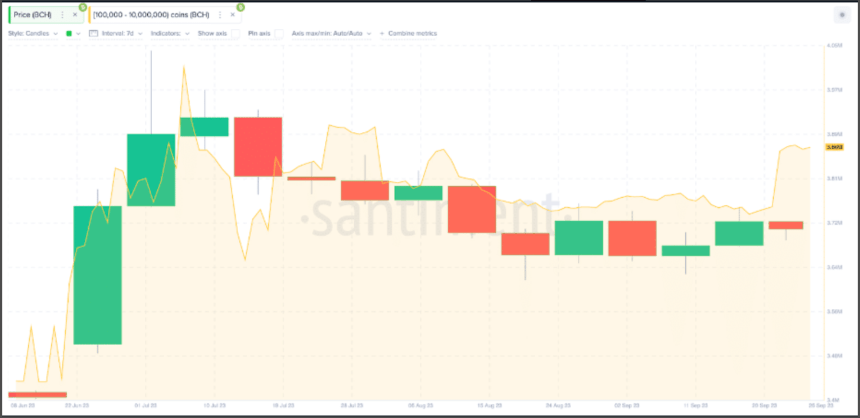
Ethereum Price Increase Could Soon Fade If ETH Fails To Surpass $1,750

Ethereum price is attempting a fresh increase above $1,720 against the US Dollar. ETH could accelerate higher if it clears the $1,750 resistance.

  • Ethereum is attempting a fresh increase above the $1,720 level.
  • The price is trading above $1,700 and the 100-hourly Simple Moving Average.
  • There is a connecting trend line forming with resistance near $1,750 on the hourly chart of ETH/USD (data feed via Kraken).
  • The pair could continue to rise if it clears the $1,750 resistance zone.

Ethereum Price Gains Traction

Ethereum’s price settled above the $1,650 level. ETH formed a base above $1,650 and recently started a decent increase above the $1,700 level, like Bitcoin.

There was a move above the $1,720 resistance level and the price tested the $1,750 zone. A high was formed near $1,756 and there was a minor downside correction. The price declined below the $1,735 level. However, it is still above the 50% Fib retracement level of the recent rally from the $1,668 swing low to the $1,756 high.

Ethereum is trading above $1,700 and the 100-hourly Simple Moving Average. On the upside, the price might face resistance near the $1,750 level. There is also a connecting trend line forming with resistance near $1,750 on the hourly chart of ETH/USD.

Ethereum Price

Source: ETHUSD on TradingView.com

The next major resistance is $1,800. A clear move above the $1,800 resistance zone could set the pace for a larger increase. In the stated case, the price could visit the $1,850 resistance. The next key resistance might be $1,920. Any more gains might open the doors for a move toward $2,000.

Are Dips Supported in ETH?

If Ethereum fails to clear the $1,750 resistance, it could start a downside correction. Initial support on the downside is near the $1,710 level. The next key support is $1,680.

The 76.4% Fib retracement level of the recent rally from the $1,668 swing low to the $1,756 high is also near $1,685 to provide support, below which the price could test the $1,650 support. A downside break below the $1,650 support might start another bearish wave. In the stated case, there could be a drop toward the $1,600 level.

Technical Indicators

Hourly MACDThe MACD for ETH/USD is losing momentum in the bullish zone.

Hourly RSIThe RSI for ETH/USD is now above the 50 level.

Major Support Level – $1,700

Major Resistance Level – $1,750

Bitcoin Bulls Aim Big After Recent Surge To $28K

Bitcoin price rallied above the $27,500 resistance. BTC is consolidating near $28,000 and might start a minor downside correction in the near term.

  • Bitcoin gained pace above the $27,200 and $27,500 resistance levels.
  • The price is trading above $27,500 and the 100 hourly Simple moving average.
  • There is a key bullish trend line forming with support near $27,350 on the hourly chart of the BTC/USD pair (data feed from Kraken).
  • The pair is signaling more gains above $28,000 after a mild downside correction.

Bitcoin Price Rallies To $28K

Bitcoin price started a decent increase above the $27,000 resistance zone. BTC gained pace for a move above the $27,200 and $27,500 resistance levels.

The upward move was such that the price even tested the $28,000 resistance. A high is formed near $28,087 and the price is now consolidating gains. It is trading well above the 23.6% Fib retracement level of the upward move from the $26,692 swing low to the $28,087 high.

Bitcoin is trading above $27,500 and the 100 hourly Simple moving average. There is also a key bullish trend line forming with support near $27,350 on the hourly chart of the BTC/USD pair. The trend line is near the 50% Fib retracement level of the upward move from the $26,692 swing low to the $28,087 high.

Bitcoin Price

Source: BTCUSD on TradingView.com

Immediate resistance on the upside is near the $28,000 level. The next key resistance could be near the $28,200 level. A close above the $28,200 resistance could send the price further higher. In the stated case, the price could climb toward the $28,800 resistance. Any more gains might call for a move toward the $29,500 level.

Are Dips Supported In BTC?

If Bitcoin fails to continue higher above the $28,000 resistance, there could be a downside correction. Immediate support on the downside is near the $27,750 level.

The next major support is near the $27,350 level or and the trend line. A downside break and close below the $27,350 level might send the price toward $27,000. The next support sits at $26,750. Any more losses might call for a test of $26,200.

Technical indicators:

Hourly MACD – The MACD is now losing pace in the bullish zone.

Hourly RSI (Relative Strength Index) – The RSI for BTC/USD is now above the 50 level.

Major Support Levels – $27,750, followed by $27,350.

Major Resistance Levels – $28,000, $28,200, and $28,800.

FTX Exploiter Executes Ongoing Funds Exodus, Moves $17 Million In ETH In One Day

According to an on-chain report on Saturday, September 30, an address associated with the FTX exploiter became active for the first time in 10 months. As earlier reported, some 5,000 ETH (equivalent to $8.2 million) was transferred from the flagged address (identified as 0x3e9) to new addresses on Saturday.

However, in the latest development, blockchain data tracker Spot On Chain revealed that the FTX exploiter has moved more than $17 million worth of Ether tokens in the past 24 hours.

FTX Exploiter To Keep Moving Stolen Funds, Spot On Chain Speculates

In one of the most significant exploits in the crypto space, the now-defunct FTX exchange fell victim to a hack a few hours after declaring bankruptcy, leading to a loss of more than $600 million. 

According to an on-chain revelation, the exploiter has been moving huge chunks of their loot in the past 24 hours. The transferred funds have reached a total of 10,250 ETH (worth roughly $17.2 million), spread across five addresses.

A breakdown by Spot On Chain shows that a significant 7,749 ETH (equivalent to about $13 million) was moved to the Thorchain router and Railgun contract. These two decentralized finance (DeFi) protocols are renowned for their privacy-focused features.

Within the past day, the FTX exploiter has executed swap transactions involving 2,500 ETH (worth approximately $4.19 million). These funds were converted to 153.4 tBTC (an ERC-20 token standard for Bitcoin) at an average price of $27,281.

The recent movement of funds by the attacker is believed to be triggered by the highly likely approval of Ether futures ETFs in the US. However, there has been no substantial evidence to back up these connections.

There have been speculations that the exploiter might be looking to dump their tokens should the ETH price rally after futures ETFs are greenlighted. 

In any case, spectators will probably keep an eye on the address’ activity, especially after Spot On Chain suggested the exploiter may keep transferring ETH.

Ethereum Price Overview

The Ethereum price showed good strength to end September after largely struggling throughout the month. The cryptocurrency has made a positive start to October, approaching the psychological $1,700 level with a 0.6% rise in the past day.

The value of ETH has jumped by nearly 6% in the past week, reflecting positive signs of recovery. According to data from CoinGecko, the cryptocurrency has experienced a nearly 4% decline in daily trading volume, representing a recent fall in market activity.

Nevertheless, Ethereum remains the second-largest cryptocurrency, with a market cap exceeding $200 billion.

FTX

Crypto Analyst Tips Bitcoin (BTC) To Reach $40,000 In Q4 2023

Bitcoin has recorded an overall positive price movement in the last week, gaining by 2.39%, according to data from CoinMarketCap. The premier cryptocurrency suffered a slight dip between Tuesday and Thursday but soon rose on Friday to trade above $27,000 again. 

Meanwhile, in celebrating the new month of October, popular crypto analyst Michaël van de Poppe has predicted an incoming bullish run for Bitcoin in Q4 2033 based on certain expected events. 

Analyst Projects Bitcoin To Reach $40K In Q4 2023 Starting With A Positive ‘Uptober’

Via a post on X on October 1, Michaël van der Poppe welcomed his 667,000 followers to October with much optimism towards the BTC market, renaming the month as “Uptober.” 

In general, the well-known analyst believes the crypto bear market is almost over, and Bitcoin could soon record some significant gains, as he expressed in a previous post on September 30.

Interestingly, van de Poppe’s optimism extends beyond October to the whole of Q4 2023, as he predicts Bitcoin could attain $40,000 before the year runs out. Albeit, this prediction is hinged on the occurrence of certain events.

Firstly, Michaël van der Poppe mentions the potential approval of ETF applications. The ongoing Bitcoin spot ETF saga in the US has drawn much attention over the last few months due to its possible effects on the BTC market.

Currently, analysts are quite optimistic about the chances of approval of a Bitcoin spot ETF, which could result in massive gains for the largest crypto asset upon realization. 

Realistically, this approval could occur in Q4 2023, as it contains the second deadline date for most applications. 

However, the US Securities and Exchange Commission could decide to delay its responses to these proposals till the final deadlines, most of which are slated for Q1 2024. The US securities regulator is already employing such tactics, as seen with the first deadline dates for most applications.

In the last week, the SEC also announced it would be pushing back its response to certain applications beyond their second deadline date. These applications included proposals from BlackRock, 21Shares, Bitwise, and Valkyrie. 

The Bitcoin Pre-Halving Rally

In addition to potential ETF approvals, Michaël van de Poppe also mentioned a possible bitcoin pre-halving rally as a factor that could spur the asset growth to $40,000 in Q4 2023. 

Historically, the months leading up to the halving event are marked by a Bitcoin rally, as seen in 2012 and 2016.

Based on van de Poppe’s prediction, he foresees a similar BTC price movement in the coming months ahead of the next Bitcoin halving set for April 2024, during which the mining rewards will be slashed from 6.25 BTC to 3.125 BTC. 

However, investors should take note of black swan events, as seen with the last Bitcoin halving in 2020. In the months before this halving event occurred, the BTC pre-halving rally was temporarily affected by the negative market effects of the COVID-19 pandemic.

At the time of writing, Bitcoin is trading at $27.138 with a 1.07% gain in the last day. Meanwhile, the asset’s daily trading volume is down by 21.37% and valued at $6.28 billion. 

Bitcoin

XRP Price Threatened As Ripple Unlocks 1 Billion Coins

The XRP price has already been under pressure for the past month, as the future outlook of Ripple is still set to be determined in the near future. Although XRP has moved up with the rest of the crypto market over the past few days of green, there is still uncertainty about the next bull run.

However, this little price movement could be brief, as the number of XRP tokens in circulation just increased by 1 billion XRP, around 1.87% of the circulating supply of 53.312 billion tokens.

Potential Impact On XRP Price And Supply

On-chain data from Whale_Alerts has shown bouts of XRP totaling 1 billion have been unlocked from escrow in three transactions from two separate wallets. First, 400 million XRP tokens worth over $205.9 million were unlocked.

In the second transaction, 100 million XRP tokens worth $51.4 million were unlocked.

And in the last transaction, Ripple unlocked 500 million XRP tokens worth $257.3 million. With the current market price of XRP at $0.5177, this puts the value of the unlocked tokens over $514.6 million. 

Ripple’s latest unlock is part of the periodic release in its plan to release 55 billion XRP tokens over 55 months. Since 2017, the payment company has been known to release 1 billion XRP tokens each month through a smart contract. While Ripple claims this helps increase liquidity and utility, it also means a major influx of new coins entering circulation.

With more XRP available, the price often drops as supply outweighs demand. Each new release adds downward pressure, and the price frequently falls in the days leading up to and following the escrow unlocking. 

The monthly escrow has led to significant price slumps in the past months, especially during periods of lower interest in XRP. In particular, XRP witnessed a major selloff in June as whales dumped around 120 million XRP after Ripple unlocked its escrow. 

Ripple has been known to periodically relock a portion of released tokens into the escrow system to reduce selling pressure, which helps extend the runway for the remaining tokens to be unlocked. For instance, Ripple immediately relocked 800 million (80%) of September’s token unlock. The total amount to be locked back in escrow this month is yet to be determined. 

Ripple: The Future Outlook For XRP

XRP is currently up by 1.83% in a seven-day timeframe but the price outlook looks remains highly uncertain in the short term. Various predictions have come in for the token’s future, with one prediction even going as high as $10,000. 

(This site’s content should not be construed as investment advice. Investing involves risk. When you invest, your capital is subject to risk).

Featured image from iStock

Bitcoin Cash Bulls Charge: 13% Price Rally Driven By Fresh Demand

The price of Bitcoin Cash has experienced significant rise over the course of the last 30 days, resulting in favorable returns for investors. Since July, BCH holders have continuously maintained a positive perspective, which has reduced the frequency of selling activity. This collective sentiment has played a significant role in the upward trajectory of BCH, consequently yielding favorable outcomes for these holders.

The price of BCH has increased by about 13% over the previous week, giving it some of the biggest gains in the last seven days for cryptocurrency assets. According to CoinMarketCap data, the altcoin was trading at $234.78 at the time of publication.

The value of the world’s cryptocurrency market dropped to $1.06 trillion at the time of writing, a 0.1% decrease in a day. On Thursday, ETH increased by about 0.8% to $1,629, while Bitcoin (BTC) rose slightly above the $27K level.

Can Bitcoin Cash Reach New ATH This Year?

BCH is anticipated to undergo a trial of the support line at a value of $229, after which a subsequent rebound is projected. The breach of the current barrier at $253 is crucial for the potential rise of the altcoin. If this level is surpassed, it might pave the way for the altcoin to achieve new 2023 highs, beyond the $300 mark.

Bitcoin Cash has increased by a remarkable 90% in the last six months, demonstrating strong performance. Furthermore, the price of BCH has been up significantly by 136% so far this year, maintaining a favorable return.

Santiment research indicates that whales in the cryptocurrency space have increased their holdings in Bitcoin Cash significantly. Collectively, bitcoin whales with holdings ranging from 100,000 to 10 million BCH held 3.74 million BCH as of September 18, 2023.

Long-Term Holder Addresses Up

But on September 26, their holdings had increased to 3.86 million BCH, showing a noteworthy acquisition of 120,000 BCH in just one week. Their balances are now comparable to what they were in July 2023 thanks to this accumulation, and the 120,000 BCH that the Bitcoin Cash whales purchased are worth about $25.6 million at the current market price of $213 per BCH.

Meanwhile, the increase in long-term holders of Bitcoin Cash indicates a positive outlook for the cryptocurrency’s sustainability. These committed investors, who believe in BCH’s long-term potential, contribute to a stable user base and network demand. This support from long-term holders, combined with whale accumulation, could help BCH reach or exceed $300 in the future

(This site’s content should not be construed as investment advice. Investing involves risk. When you invest, your capital is subject to risk).

Featured image from iStock