Bitcoin Price Predictions For 2024: Insights From Major Banks To Hedge Funds

With anticipation around Bitcoin ETFs from giants like BlackRock, Fidelity, and Invesco, and an expected halving in April 2024, forecasts for Bitcoin’s price next year show a significant range. From JPMorgan to Standard Chartered Bank, here are the most notable estimates for 2024:

Pantera Capital: $150,000

In their August “Blockchain Letter”, Pantera Capital, led by Dan Morehead, predicts a possible rise to $147,843 post the 2024 halving. Employing the stock-to-flow (S2F) ratio, they believe the price model suggests the valuation of Bitcoin against its scarcity will become more pronounced.

Specifically, Pantera Capital stated, “The 2020 halving reduced the supply of new bitcoins by 43% relative to the previous halving. It had a 23% as big an impact on price.” With history as a reference, this could indicate a hike from $35k before the halving to $148k after. However, not all Bitcoin supporters are on board, having witnessed failed predictions based on this model in the recent past.

Standard Chartered Bank: $120,000

In a recent research report from July, Standard Chartered Bank offered a bullish outlook on Bitcoin’s potential trajectory. The British multinational bank now expects Bitcoin’s value to ascend to $50,000 by the end of the current year, with the potential to soar as high as $120,000 by the close of 2024. This revised forecast from Standard Chartered marks an increase from their previous April prediction, where they projected a top of $100,000 for Bitcoin.

The upward revision in the bank’s forecast is underpinned by several determining factors. Notably, one primary reason cited for the potential price escalation is the ongoing banking-sector crisis. Additionally, the report sheds light on the rising profitability for Bitcoin miners as a pivotal factor influencing the price trajectory. Geoff Kendrick, the head of FX and digital assets research, emphasizes the instrumental role of miners. He notes, “The rationale here is that, in addition to maintaining the Bitcoin ledger, miners play a key role in determining the net supply of newly mined BTC.”

JPMorgan: $45,000 Per Bitcoin

JPMorgan, one of the world’s leading investment banks, anticipates a more restrained growth for Bitcoin, predicting a rise to $45,000. This forecast is influenced by the surging gold prices. Historically, Bitcoin and gold have shown correlation in their price movements, and with the gold price recently surpassing the $2,000 mark per ounce, it has bolstered JPMorgan’s conservative outlook on Bitcoin.

In a detailed note from May, JPMorgan strategists explained, “With the gold price rising above $2,000, the value of gold held for investment purposes outside central banks stands at about [$3 trillion]. Consequently, this suggests a Bitcoin price of $45,000, based on the premise that BTC will achieve a standing akin to gold among private investors.”

Matrixport: $125,000 By End-2024

In July, Matrixport, a prominent crypto services provider, predicted that Bitcoin’s price could surge to as high as $125,000 by the close of 2024. This optimistic outlook was based on historical price patterns and a significant signal: Bitcoin’s recent breach of $31,000 in mid-July, marking its highest level in over a year. Historically, such milestones have signaled the end of bear markets and the beginning of robust bull markets.

By comparing these patterns with historical data from 2015, 2019, and 2020, Matrixport estimated potential gains of up to 123% within twelve months and 310% within eighteen months. This translates to potential Bitcoin prices of $65,539 and $125,731 within those respective timeframes.

Tim Draper: $250,000

Tim Draper, a prominent venture capitalist, maintains a highly bullish outlook on Bitcoin. While his previous prediction for Bitcoin to reach $250,000 by June 2023 didn’t materialize, he remains optimistic about the cryptocurrency’s long-term potential. In a July interview on Bloomberg TV, Draper attributed recent regulatory actions in the United States, such as those against Coinbase and Binance, to BTC’s short-term downtrend.

Despite these challenges, Draper continues to believe in Bitcoin’s transformative power and sees it potentially reaching $250,000, albeit now possibly by 2024 or 2025. His confidence in Bitcoin’s ability to revolutionize finance and retain its long-term value remains unwavering.

Berenberg: $56,630 At Bitcoin Halving

The German investment bank Berenberg revised its prediction in July, pointing toward $56,630 by April 2024. This upward adjustment was supported by improved market sentiment attributed to the anticipation of the Bitcoin halving event expected in April 2024 and the growing interest exhibited by prominent institutional players.

Berenberg’s team of analysts, led by the insightful Mark Palmer, emphasizes their expectation of significant appreciation in Bitcoin’s value in the coming months. This projection is driven by two key factors: the highly anticipated Bitcoin halving event and the growing enthusiasm displayed by significant institutions.

Highlighting their confidence in the market, Berenberg also reaffirmed its buy rating on the stock of Microstrategy. The bank has revised its share price target for Microstrategy from $430 to $510, driven by a higher valuation of the company’s BTC holdings and an improved outlook for its software business.

Blockware Solutions: $400,000

Blockware Intelligence, in an analysis from August titled “2024 Halving Analysis: Understanding Market Cycles and Opportunities Created by the Halving,” delved into the intriguing possibility of Bitcoin’s price reaching $400,000 during the next halving epoch, anticipated in 2024/25.

A central factor identified in the research is the role of the halving in shaping Bitcoin’s market cycles. The report asserts that miners, responsible for a significant portion of sell pressure, receive newly minted BTC, much of which they must sell to cover operational costs. However, the halving events serve to weed out inefficient miners, leading to reduced sell pressure.

With supply diminishing due to halvings, the research emphasizes that demand becomes the primary determinant of BTC’s market price. Historical data indicates that a surge in demand typically follows halving events. Market participants, equipped with an understanding of the supply-side dynamics introduced by halvings, prepare to deploy capital at the first signs of upward momentum, potentially leading to substantial price appreciation. This surge in demand is particularly evident in current on-chain data, validating the positive sentiment surrounding halving events.

Beyond these notable forecasts, there are a plethora of other price predictions for BTC, ranging from Cathie Wood’s (ARK Invest) ambitious $1 million projection to Mike Novogratz’s (Galaxy Digital) $500,000, Tom Lee’s (Fundstrat Global) $180,000, Robert Kiyosaki’s (Rich Dad Company) $100,000, Adam Back’s $100,000, and Arthur Hayes’ $70,000 prediction, underscoring the diverse perspectives on Bitcoin’s future value.

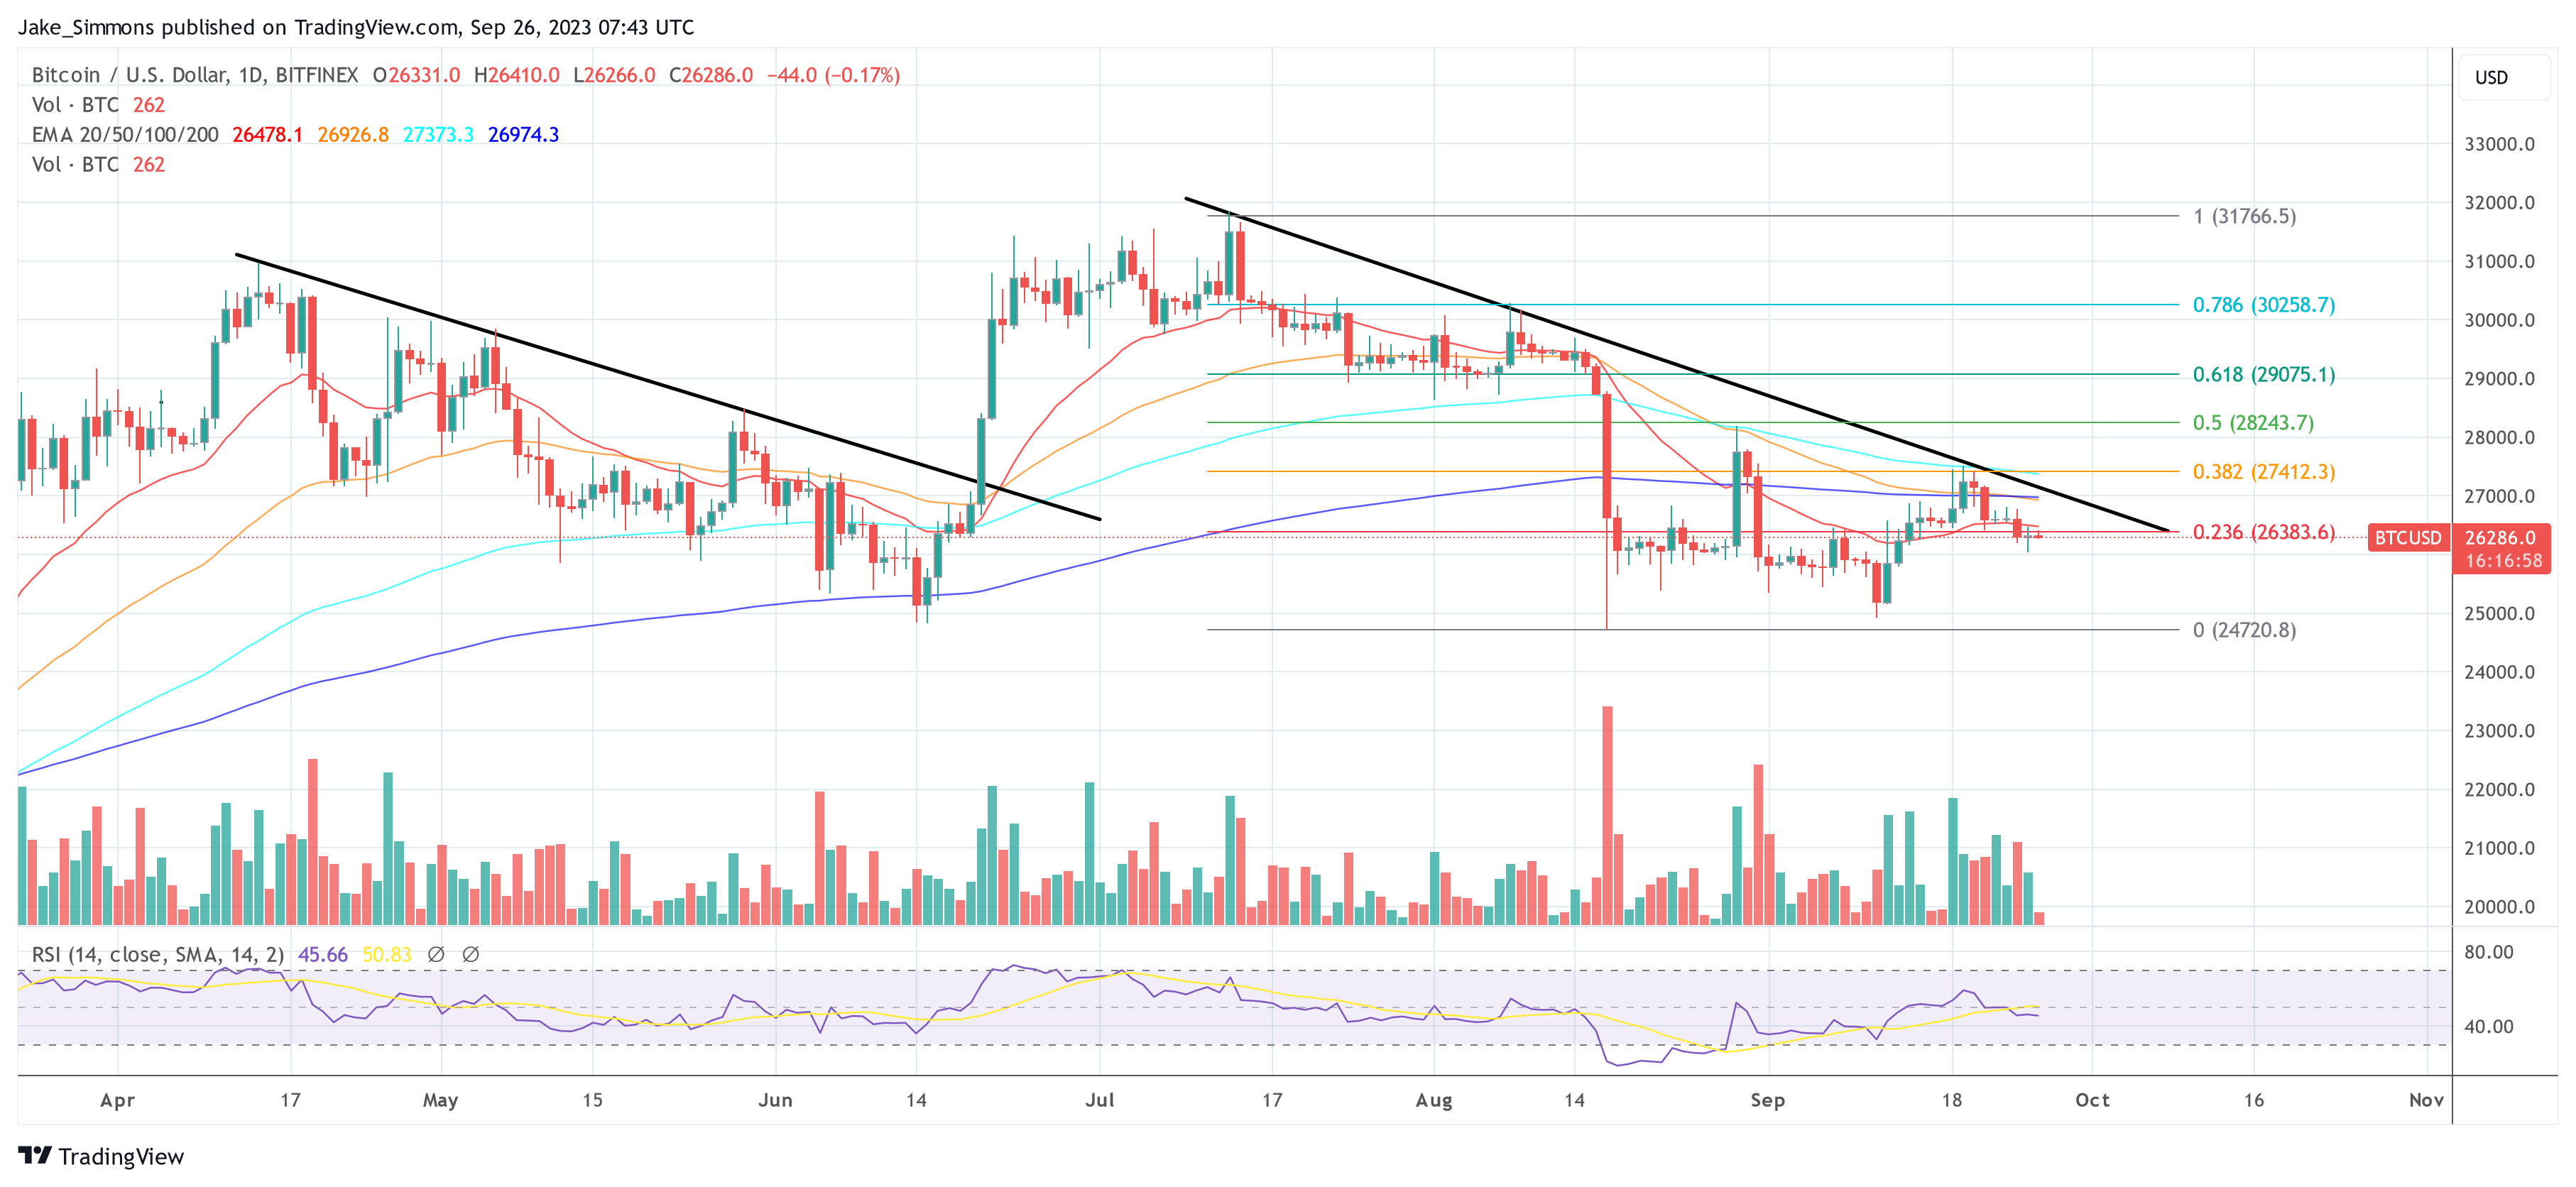
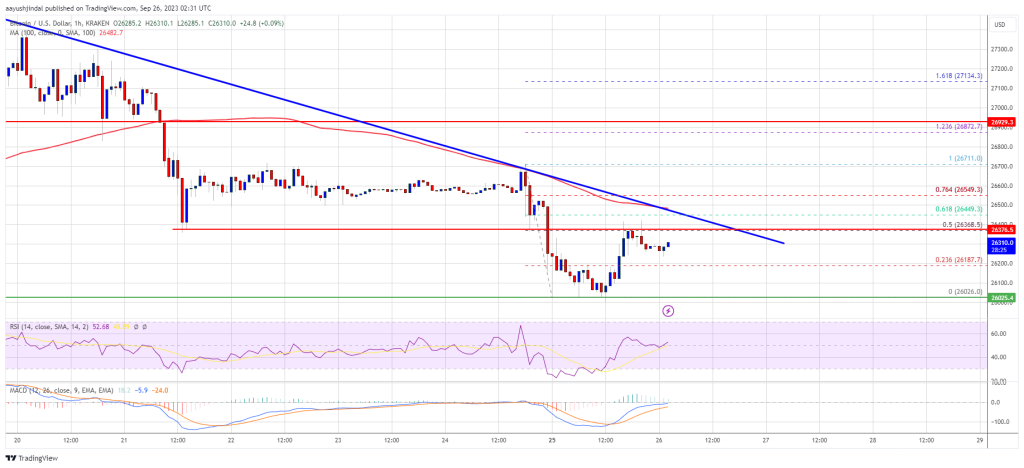
At press time, Bitcoin traded at $26,286.

Bitcoin price

Litecoin Stuck In A Rut: Will Bullish Momentum Or Bearish Pressure Prevail?

Litecoin (LTC) has spent the past week trading within a tight price range, with its value hovering steadily around the mid-range point of $64. The price action for LTC in September has remained primarily bearish, with sellers maintaining control over the market. 

While LTC has a history of volatile price swings, recent times have seen it mirroring the sideways movement of the overall market, largely influenced by Bitcoin’s fluctuations, which rose from $25,000 to $27,000 before dropping to $26,000.

As of the latest data from CoinGecko, Litecoin is currently trading at $64.63, with a 24-hour gain of 0.7%. However, over the past seven days, LTC has experienced a decline of 2.9%, reflecting the prevailing bearish sentiment in the market, according to a recent price report.

Chasing Litecoin Bulls and Avoiding The Bears

For those looking for a bullish revival in Litecoin’s price,  a price report notes that the key level to watch is the 23.6% Fibonacci retracement level, which stands at $69. Breaking above this level could open the door for further gains, with potential targets lying at $78 and $80.

On the other hand, if the flat trading volume persists, bears may exert further pressure, potentially leading to a drop in LTC’s price to the $60 mark.

Market speculators have not been particularly enthusiastic about Litecoin’s recent sideways movement. The Open Interest (OI) for LTC has continued to decline, with data from Coinalyze indicating a $9 million drop within the past 48 hours. This suggests that traders and investors are becoming increasingly cautious as they monitor the developments in the Litecoin market.

Litecoin’s Investment Appeal in Q3/Q4

Despite the recent lackluster performance, some analysts believe that Litecoin remains an attractive investment opportunity in the third and fourth quarters of this year. Litecoin’s established reputation, solid ecosystem, and upcoming halving events are factors that contribute to its appeal.

Halving events have historically had a positive impact on Litecoin’s price, reducing the rate at which new LTC coins are mined and potentially increasing scarcity.

Market participants are closely watching the 23.6% Fibonacci retracement level at $69 for signs of a bullish revival, while a continuation of flat trading volume could see LTC drop to $60.

Despite recent market concerns, Litecoin’s strong fundamentals and upcoming halving events make it an investment opportunity worth considering as we move into the later part of the year.

(This site’s content should not be construed as investment advice. Investing involves risk. When you invest, your capital is subject to risk).

Featured image from Invest Right

XRP Price Prediction – Will Recent Correction Trend Push XRP Under $0.50?

Ripple’s token price is holding gains above $0.50 against the US Dollar. XRP price could take a hit if it fails to recover above $0.512.

  • Ripple’s token price is attempting a fresh increase above $0.508 and $0.512 against the US dollar.
  • The price is now trading above $0.500 and the 100 simple moving average (4 hours).
  • There is a major contracting triangle forming with resistance near $0.505 on the 4-hour chart of the XRP/USD pair (data source from Kraken).
  • The pair might gain bullish momentum if there is a close above $0.512.

Ripple’s Token Price Holds Key Support

In the last XRP price prediction, we discussed the chances of more gains in Ripple’s XRP against the US Dollar. The price did climb above the $0.515 resistance level, but upsides were limited, like Bitcoin and Ethereum.

The price struggled to clear the $0.525 resistance. A high was formed near $0.5254 and the price saw a downside correction. There was a move below $0.512 and a spike below $0.50. A low is formed near $0.4907 and the price is now consolidating.

It is back above the 23.6% Fib retracement level of the recent decline from the $0.5254 swing high to the $0.4907 low. XRP price is also trading above $0.500 and the 100 simple moving average (4 hours).

On the upside, immediate resistance is near the $0.508 level. Besides, there is a major contracting triangle forming with resistance near $0.505 on the 4-hour chart of the XRP/USD pair. The triangle resistance coincides with the 50% Fib retracement level of the recent decline from the $0.5254 swing high to the $0.4907 low.

XRP Price Prediction

Source: XRPUSD on TradingView.com

The next major resistance is near the $0.5120 level. A close above the $0.512 level could send the price toward the $0.525 barrier. A successful break above the $0.525 resistance level might start a strong rally toward the $0.555 resistance. Any more gains might call for a test of the $0.580 resistance.

Downside Break in XRP?

If ripple fails to clear the $0.512 resistance zone, it could start another decline. Initial support on the downside is near the $0.50 zone and the 100 simple moving average (4 hours).

The next major support is at $0.490. If there is a downside break and a close below the $0.490 level, XRP’s price could extend losses. In the stated case, the price could retest the $0.460 support zone.

Technical Indicators

4-Hours MACD – The MACD for XRP/USD is now losing pace in the bullish zone.

4-Hours RSI (Relative Strength Index) – The RSI for XRP/USD is now below the 50 level.

Major Support Levels – $0.500, $0.490, and $0.460.

Major Resistance Levels – $0.508, $0.512, and $0.525.

Ethereum Price Hints At Potential Correction But Faces Uphill Task

Ethereum price is attempting a recovery wave from $1,565 against the US Dollar. ETH could struggle to recover above $1,600 and might resume its decline.

  • Ethereum is slowly moving higher toward the $1,600 resistance zone.
  • The price is trading below $1,600 and the 100-hourly Simple Moving Average.
  • There is a major bearish trend line forming with resistance near $1,595 on the hourly chart of ETH/USD (data feed via Kraken).
  • The pair could start a fresh decline if it fails to clear the $1,600 resistance zone.

Ethereum Price Struggles Below $1,600

Ethereum’s price started a fresh decline below the $1,620 and $1,600 levels. ETH even declined to a new weekly low below the $1,580 level, unlike Bitcoin.

It traded as low as $1,565 and recently started a short-term upside correction. There was a move above the $1,580 level. The price climbed above the 50% Fib retracement level of the recent drop from the $1,600 swing high to the $1,565 low.

However, the bears are still active near the $1,600 resistance. The price is struggling to clear the 76.4% Fib retracement level of the recent drop from the $1,600 swing high to the $1,565 low.

Ether is now trading below $1,600 and the 100-hourly Simple Moving Average. There is also a major bearish trend line forming with resistance near $1,595 on the hourly chart of ETH/USD. On the upside, the price might face resistance near the $1,595 level.

Ethereum Price

Source: ETHUSD on TradingView.com

The next major resistance is $1,600. A push above $1,600 might send Ethereum toward $1,620. If the bulls succeed in clearing the $1,620 hurdle, the price could start a decent increase toward the $1,650 resistance. Any more gains might open the doors for a move toward $1,700.

More Losses in ETH?

If Ethereum fails to clear the $1,600 resistance, it could start another decline. Initial support on the downside is near the $1,580 level.

The next key support is $1,565, below which the price could test the $1,540 support. A downside break below $1,540 might push the price further into a bearish zone. In the stated case, there could be a drop toward the $1,500 level.

Technical Indicators

Hourly MACDThe MACD for ETH/USD is losing momentum in the bearish zone.

Hourly RSIThe RSI for ETH/USD is now above the 50 level.

Major Support Level – $1,565

Major Resistance Level – $1,600

Bitcoin Price Turns Vulnerable As Indicators Point To More Weakness

Bitcoin price is struggling below the $26,500 resistance. BTC could accelerate lower if there is a close below the $26,000 support in the near term.

  • Bitcoin is struggling and trading well below the $27,500 resistance.
  • The price is trading below $26,500 and the 100 hourly Simple moving average.
  • There is a key bearish trend line forming with resistance near $26,420 on the hourly chart of the BTC/USD pair (data feed from Kraken).
  • The pair could resume its decline unless there is a close above the $26,500 level.

Bitcoin Price Faces Hurdles

Bitcoin price started a fresh decline below the $26,800 level. BTC traded below the $26,500 and $26,200 support levels to move into a negative zone.

Finally, the pair tested $26,000 and a low was formed near $26,026. Recently, the price started a minor recovery wave above the $26,200 level. The price climbed above the 23.6% Fib retracement level of the recent drop from the $26,712 swing high to the $26,026 low.

However, the bears are protecting a break above the $26,500 resistance. The price is struggling to clear the 50% Fib retracement level of the recent drop from the $26,712 swing high to the $26,026 low.

Bitcoin is now trading below $26,500 and the 100 hourly Simple moving average. Immediate resistance on the upside is near the $26,400 level. There is also a key bearish trend line forming with resistance near $26,420 on the hourly chart of the BTC/USD pair.

Bitcoin Price

Source: BTCUSD on TradingView.com

The next key resistance could be near the $26,500 level, above which the price could gain bullish momentum. In the stated case, the price could climb toward the $27,000 resistance. Any more gains might call for a move toward the $27,500 level.

More Losses In BTC?

If Bitcoin fails to start a fresh increase above the $26,500 resistance, it could continue to move down. Immediate support on the downside is near the $26,150 level.

The next major support is near the $26,000 level. A downside break and close below the $26,000 level might start another major decline maybe toward the next support at $25,400. Any more losses might call for a test of $25,000.

Technical indicators:

Hourly MACD – The MACD is now losing pace in the bearish zone.

Hourly RSI (Relative Strength Index) – The RSI for BTC/USD is now below the 50 level.

Major Support Levels – $26,150, followed by $26,000.

Major Resistance Levels – $26,400, $26,500, and $27,000.

NEAR Protocol’s Daily Active Addresses Spike, Will Prices Follow?

In the past month, there have been more daily active addresses on the NEAR Protocol than in Ethereum and its layer-2 protocols, including Arbitrum and OP Mainnet, Artemis data from September 25 reveals.

Artemis, an institutional data platform for digital assets, shows that the number of daily active addresses on NEAR Protocol has been consistently above the 400,000 level in September. 

Daily Active Addresses On NEAR Protocol Surging

Looking closer at the data confirms that the number of daily active addresses on Ethereum, the pioneer smart contract platform that hosts most decentralized finance (DeFi) and non-fungible token (NFT) activity, has been dropping.

To illustrate, the number of daily active on Ethereum rose above 1 million in mid-September but has since more than halved to below 400,000. The same trend can be seen in Arbitrum, which dropped from around 200,000 in late June to 150,000 when writing on September 25.

Daily active addresses| Source: Artemis

During this time, NEAR Protocol’s daily active addresses have rapidly spiked from around 40,000 in late June to above 400,000, outperforming Ethereum in this metric. With rising daily active addresses, there has been a spike in daily transactions over the past month. According to trackers, the NEAR Protocol processes more transactions than Ethereum.

Daily transactions| Source: Artemis

Public ledgers like NEAR Protocol and Ethereum depend on a community of users who actively transact—moving value or running protocols—or validators- to secure the network. However, the number of daily active addresses can provide valuable insights into the level of adoption, user engagement, and the network’s overall health.

Besides user engagement, rising daily active addresses might also point to changing market sentiment, which could significantly impact prices.  

Bears In Control As DEX Trading Volume Remains Relatively Stable

When writing, NEAR, the native token of the NEAR Protocol, is trading at around 2023 lows. Changing hands at $1.107, the coin is down 61% from 2023 highs and remains under pressure.

The candlestick arrangement in the daily chart points to consolidation and stability above the primary resistance level at $1. Bears have the upper hand if prices remain below $1.23, a critical resistance level marking the August 17 highs.

NEAR price on September 25| Source: NEARUSDT on Binance, TradingView

As evidence shows, the network activity and price action diverge. Although the transaction count also rose, the number of unique addresses interacting with NEAR Protocol decentralized exchanges has mostly been stable. Looking at the numbers, DEX volume on the platform is significantly lower than those registered in Ethereum and its popular layer-2 platforms.

Cardano: Factors That Could Drive ADA Price As High As $12

The Cardano community has been one of the fastest-growing in the crypto space and this has shone a heavy spotlight on the ADA price. With expectations mounting already even amid the crypto winter, there are key factors that stakeholders believe could drive the altcoin’s price as high as $12.

ADA Price Could Reach $12

In the last bull market, the ADA price went on a tremendous rally that saw the coin rise from as low as $0.03 to as high as $3.10 at its peak. This price action cemented the token as one of the winners of the bull, and some investors believe that the coin could be poised for another repeat of this price action. One X (formerly Twitter) user has given some points as to why this could be the case.

In the post, the user points to the current state of interaction and sentiment in the crypto market right now, which they refer to as brutal. However, they do not believe that this will always be the way things will be. According to the user, a quick change in the interaction and sentiment would lead to a rapid price increase.

At this point, they believe that most investors will end up entering the asset at a much higher price of $3 and above. This would put it at its previous all-time high. However, it doesn’t end there. They put forward that at the end of the next bull market, the ADA price would be between $8 and $12.

As with any forecast, a timeframe is often asked and they responded that they expect this to happen in the second quarter of 2025. This would coincide with the current 4-year cycle that usually sees prices of cryptocurrencies topping out by Q2 and Q3.

Cardano ADA price chart from Tradingview.com

Cardano Is In Better Shape

A prominent Cardano influencer has also painted a bullish picture for the digital asset. @cardano_whale, an account that boasts over 137,000 followers on X, said in a tweet that the Cardano network is currently in better shape than it has ever been.

They urged investors who have been increasingly critical of the network to think if they are that way because they are projecting their emotions from the ADA price action onto the network itself. “If you’ve noticed yourself become increasingly negative about it over the last year or so, consider that you might just be projecting emotions from price action onto it,” the post read.

Although ADA has not seen the most impressive performance, it has not deterred bullish predictions from analysts. One analyst explained that ADA at $0.25 was a prime accumulation price and that the price of the digital asset could climb as high as $5.