
Poland’s data protection watchdog has confirmed it has opened an investigation into OpenAI over a complaint it received from an applicant.
Cryptocurrency Financial News
Poland’s data protection watchdog has confirmed it has opened an investigation into OpenAI over a complaint it received from an applicant.

Experts remain divided on when the next bull market is set to kick off, but they all agree on one thing: the next big rally won’t look like the last one.

The decades old ‘NSA created Bitcoin’ theory has again made the rounds on social media, with one Bitcoin advocate adding more weight to his ongoing theory.
Chainlink’s LINK price recovered above the $6.50 resistance. The price is now correcting gains, but it might find bids near $6.40 and could start a fresh increase.
After a steady decline, LINK price found support near the $5.75 zone against the US Dollar. A low was formed near $5.74 and the price recently started a fresh increase, like Bitcoin and Ethereum.
The price recovered above the $6.00 and $6.20 resistance levels. The bulls were able to pump the price above the $6.50 level and the 100 simple moving average (4 hours). Finally, the bears appeared near the $7.00 zone. A high is formed near $7.03 and the price is now correcting gains.
It traded below the 23.6% Fib retracement level of the upward move from the $5.74 swing low to the $7.03 high. LINK is still trading above the $6.50 level and the 100 simple moving average (4 hours). There is also a connecting bullish trend line forming with support near $6.40 on the 4-hour chart of the LINK/USD pair. The trend line is near the 50% Fib retracement level of the upward move from the $5.74 swing low to the $7.03 high.
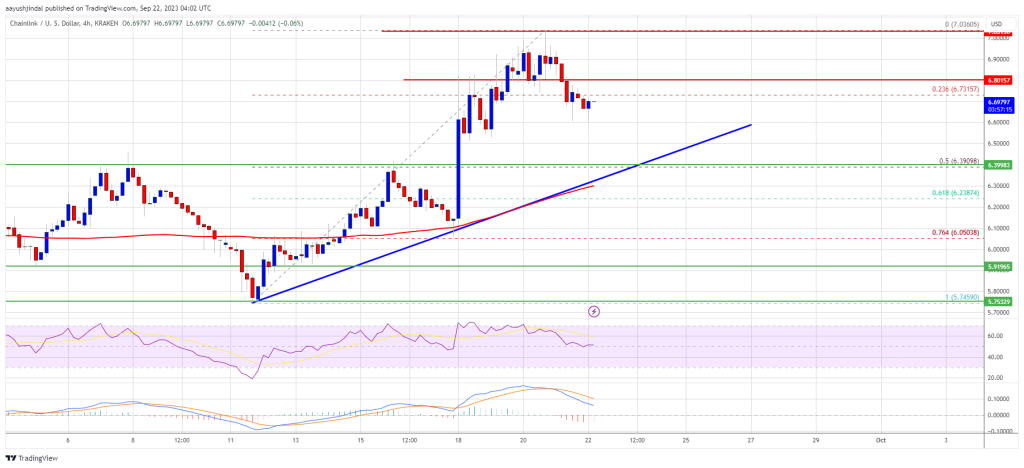
Source: LINKUSD on TradingView.com
If there is a fresh increase, the price might face resistance near $6.80. The first major resistance is near the $7.00 zone. A clear break above $7.00 may possibly start a steady increase toward the $7.25 and $7.32 levels. The next major resistance is near the $7.50 level, above which the price could revisit $7.85.
If Chainlink’s price fails to climb above the $6.80 resistance level, there could be a downside extension. Initial support on the downside is near the $6.50 level.
The next major support is near the $6.40 level, below which the price might test the $5.90 level. Any more losses could lead LINK toward the $5.75 level in the near term.
Technical Indicators
4 hours MACD – The MACD for LINK/USD is losing momentum in the bullish zone.
4 hours RSI (Relative Strength Index) – The RSI for LINK/USD is now above the 50 level.
Major Support Levels – $6.50 and $6.40.
Major Resistance Levels – $6.80 and $7.00.

China’s capital outflows reached $49 billion in August, its highest in nearly eight years. Analysts are debating whether it could be a boon for Bitcoin and crypto.
Ethereum price gained bearish momentum below $1,620 against the US Dollar. ETH is showing bearish signs and might decline further toward $1,540.
Ethereum’s price started a fresh decline from the $1,660 and $1,670 resistance levels. ETH declined below the $1,620 support level to enter a bearish zone and underperformed Bitcoin.
The bears even pushed the price below the $1,600 support and the 100-hourly Simple Moving Average. A low is formed near $1,568 and the price is now attempting a recovery wave. There was a move above the $1,580 level. The price is testing the 23.6% Fib retracement level of the recent decline from the $1,660 swing high to the $1,568 low.
Ether is now trading below $1,620 and the 100-hourly Simple Moving Average. There are also two bearish trend lines forming with resistance near $1,600 and $1,620 on the hourly chart of ETH/USD.
On the upside, the price might face resistance near the $1,600 level and the first trend line. The next resistance is near the $1,610 level, the second trend line, and the 100-hourly Simple Moving Average. The trend line is also near the 50% Fib retracement level of the recent decline from the $1,660 swing high to the $1,568 low.
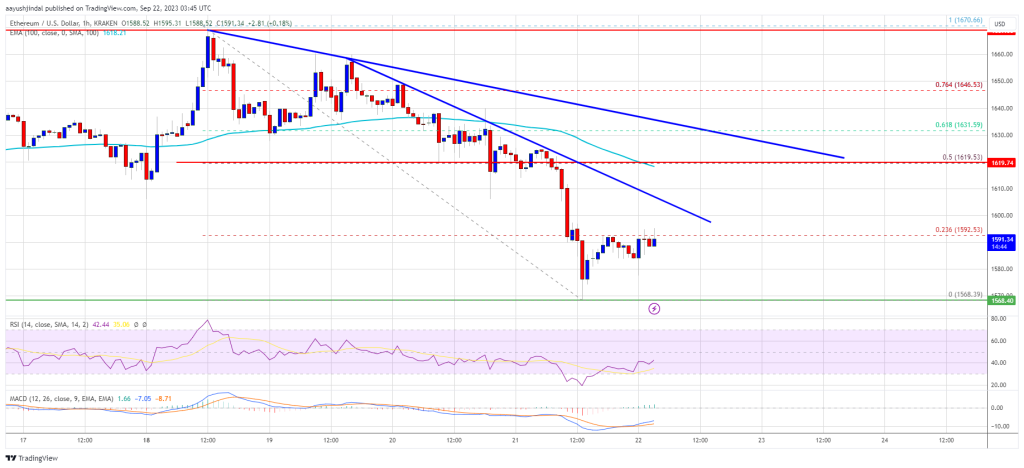
Source: ETHUSD on TradingView.com
A close above the $1,620 resistance might send the price toward the $1,650 resistance. The next major barrier is near the $1,660 level. A close above the $1,660 level might send Ethereum further higher toward $1,750.
If Ethereum fails to clear the $1,620 resistance, it could start another decline. Initial support on the downside is near the $1,565 level.
The next key support is $1,540. A downside break below $1,540 might accelerate losses. In the stated case, there could be a drop toward the $1,440 level in the coming days.
Technical Indicators
Hourly MACD – The MACD for ETH/USD is losing momentum in the bearish zone.
Hourly RSI – The RSI for ETH/USD is now below the 50 level.
Major Support Level – $1,540
Major Resistance Level – $1,620
Bitcoin price is again moving lower from the $27,500 resistance. BTC could extend its decline and revisit the $25,400 support zone.
Bitcoin price started a downside correction after it failed to clear the $27,500 resistance. BTC traded below the $27,000 and $26,800 support levels to enter a bearish zone.
Besides, there was a break below a major bullish trend line with support near $26,800 on the hourly chart of the BTC/USD pair. The pair retested the $26,350 support zone and is currently consolidating losses. It is trading near the 23.6% Fib retracement level of the recent decline from the $27,494 swing high to the $26,358 low.
Bitcoin is now trading below $27,000 and the 100 hourly Simple moving average. Immediate resistance on the upside is near the $26,800 level. The first major resistance is near the $27,000 zone, a connecting bearish trend line, and the 50% Fib retracement level of the recent decline from the $27,494 swing high to the $26,358 low.
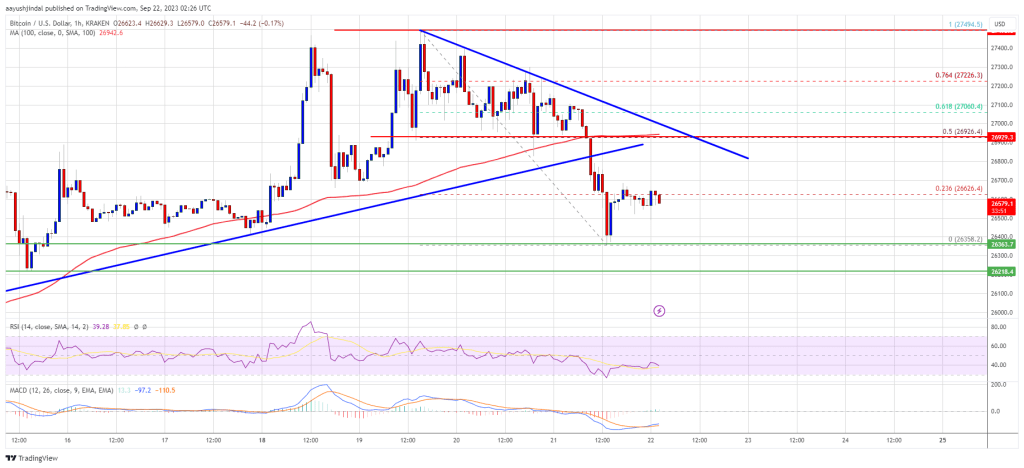
Source: BTCUSD on TradingView.com
The next key resistance could be near the $27,050 level, above which the price could gain bullish momentum. In the stated case, the price could even rise toward the $27,500 resistance. Any more gains might call for a move toward the $28,800 level in the coming days.
If Bitcoin fails to start a fresh increase above the $27,000 resistance, it could continue to move down. Immediate support on the downside is near the $26,350 level.
The next major support is near the $26,200 level. A downside break and close below the $26,200 level might spark more bearish moves and the price could decline toward the next support at $25,400.
Technical indicators:
Hourly MACD – The MACD is now losing pace in the bearish zone.
Hourly RSI (Relative Strength Index) – The RSI for BTC/USD is now below the 50 level.
Major Support Levels – $26,350, followed by $26,200.
Major Resistance Levels – $27,000, $27,050, and $27,500.
IMX, native token of Ethereum layer-2 scaling solution Immutable X, recorded massive gains on Thursday, soaring by over 23% within the last 24 hours. Before this price gain, IMX had been relatively stable all week, hovering around the $0.52 price zone, according to data from Coingecko.
Although there may be no clear reasons for the token’s positive price movement, Chinese reporter Colin Wu speculated about potential price speculation.
According to a post on X by Wu, 10.95 million of the token, valued at $8.1 million, were transferred to the Upbit exchange from several other crypto exchanges, including Binance, OKX, Bybit, Crypto.com, Gate, etc.
Korean traders are manipulating the price of IMX and driving a surge. Today, 10.95 million IMX ($8.1 million) flowed into Upbit from multiple CEXs such as Binance, OKX, Bybit, Cryptocom, Gate, etc. The price quickly rose from US$0.56 to US$1. https://t.co/JjUcqi7CKS
— Wu Blockchain (@WuBlockchain) September 21, 2023
Following these transactions, the token surged from $0.56 to $0.74, representing a 34.5% price gain. Wu has stated that Korean traders are “behind this move.” The Upbit exchange is mainly popular in South Korea, dominating over 83% of the nation’s crypto market.
Providing more insight into these transactions, on-chain analytics firm Lookonchain reports that these transfers to Upbit were sent to the same wallet with the address “0x2F77.” This indicates a single crypto whale was likely behind this price surge.
Within three hours on Thursday, 12.54 million of the token, valued at $9.45 million, was transferred to “0x2F77,” allowing this address to become the 9th largest holder of the token, owning 20.4 million worth $15 million.
Furthermore, Lookonchain also revealed that several IMX investors opted to take profit following the token’s price gain. These investors include GSR Markets, a crypto investment firm that moved 2 million IMX, worth $1.52 million, to Binance right after IMX rose.
In addition, three investors withdrew 3.5 million IMX, valued at $2.3 million, from the Foundation Treasury Locked wallet and may be planning a market dump. Following such transactions, it is no surprise that IMX soon experienced a price decline of about 13.33% a few hours after its boost.
In other news, IMX has also been listed on the Japanese exchange Coincheck. According to a blog post by the crypto exchange on Thursday, IMX will now be eligible for its various services, including Coincheck NFT and Coincheck crypto lending service.
In addition to IMX, Coincheck also announced listing other cryptocurrencies, namely Apecoin (APE) and AXS, the governance token of the Axie Infinity gaming metaverse.
At the time of writing, the IMX trades at around $0.64, with a price loss of 1.8% in the last hour. Based on more data from Coingecko, the token’s daily trading volume rose by 238.20%, valued at $808.50 million.
Celo, a blockchain platform, is exploring migrating from its standalone blockchain to an Ethereum (ETH) Layer-2 (L2) network. Originally, Celo had planned to utilize Optimism’s OP Stack, a customizable toolkit similar to Polygon (MATIC) but based on Optimism’s technology.
However, Sandeep Nailwal, co-founder of Polygon Labs, has proposed an alternative solution to the Celo community. Nailwal suggests leveraging Polygon’s Chain Development Kit (CDK), an open-source toolset that enables the creation of customizable Layer-2 chains powered by zero-knowledge (ZK) technology.
In a recent blog post, Polygon Labs suggested Celo could consider deploying an Ethereum Layer-2 solution using Polygon CDK.
According to Polygon Labs co-founder Nailwal, this strategy would allow Celo to leverage the benefits of being an Ethereum Layer-2 platform while preserving the characteristics that have contributed to its success.
The proposal emphasizes several key advantages of adopting Polygon CDK. Firstly, it enables cross-community collaboration by integrating with an ecosystem of Layer-2 solutions powered by zero-knowledge technology.
Polygon CDK enhances compatibility with Ethereum by providing an environment equivalent to the Ethereum Virtual Machine (EVM). This alignment ensures a seamless transition for Celo, closely matching Ethereum’s technical infrastructure and tooling.
Furthermore, according to Nailwal, deploying with the protocol’s CDK offers increased security for Celo. It allows Celo to leverage Ethereum’s proven consensus layer while incorporating the security benefits of zero-knowledge proofs.
Regarding fees and scalability, Celo can benefit from low fees by utilizing the zkEVM validium architecture and off-chain data availability supported by Polygon CDK. These features contribute to cost-efficient transactions while enabling scalability for Celo’s network.
Moreover, according to Nailwal, Celo gains access to a unified Layer-2 economy by becoming a part of the Polygon ecosystem by combining Ethereum’s mainnet with Polygon’s ecosystem. This integration creates a seamless experience for developers and users, facilitating interaction with both networks.
With zero-knowledge technology, Celo users can enjoy near-instant withdrawals, faster finality times, and instant cross-chain interactivity.
According to the blog post, these features enhance the speed, efficiency, and security of transactions, ultimately improving the user experience.
Through Polygon CDK, chains can achieve near-instant cross-chain interactivity with Ethereum, leveraging the power of ZK proofs to establish a secure and interconnected network.
Overall, the proposed migration to Polygon CDK represents an opportunity for Celo to transition to an Ethereum Layer-2 solution while harnessing the advantages offered by Polygon’s ZK-powered technology. The proposal aims to initiate discussions between the Celo and Polygon communities to explore the potential benefits for all stakeholders involved.
It is important to note that no final decision has been made at this stage, and the proposal signifies the beginning of discussions between the Celo and Polygon communities.
Featured image from iStock, chart from TradingView.com

“No sugar coating this, it’s been a challenging few months,” said Truffle in a social media post on Sept. 22.

Binance Holdings and its CEO Changpeng Zhao have filed a petition seeking to have the lawsuit made against them by the US Securities and Exchange Commission (SEC) dismissed.
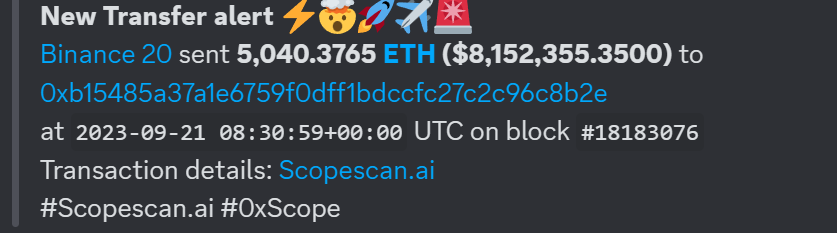
Ethereum is under pressure and has just dropped below $1,600. However, on-chain data shows that a crypto whale, “0xb154”, has moved more coins from Binance, a cryptocurrency exchange, to a non-custodial wallet.
On September 21, the ETH whale transferred over $8.1 million of the coin.
When crypto prices contract, outflows from non-custodial wallets to centralized ramps, including Binance and Coinbase, tend to rise. This is because centralized exchanges supporting stablecoins or fiat, including the Euro or JPY, offer an interface where they can easily swap for the “safety” of the less volatile fiat currencies or tokens designed to mirror them, including USDT.
That the holder is shifting tokens away from Binance regardless of the heightened volatility can signal confidence for ETH and the broader Ethereum ecosystem. It is not immediately clear what could have motivated the whale to move coins away from the exchange at this point.
However, what’s evident is that ETH is down roughly 4% from September 21’s peak and moving further away from April 2023 highs when it rose to over $2,100.
Records show this is not the first time the whale moved funds. On September 6, the investor withdrew 9,688 ETH worth $15.8 million from Binance. Less than two weeks earlier, the whale notably transferred 22,340 ETH, worth $41.2 million, to Binance.
A closer examination of the same address shows it has 24,556.59 ETH worth over $38.8 million at spot rates. Besides ETH, the address controls dust amounts of other periphery altcoins, including ZUM and SWISE.
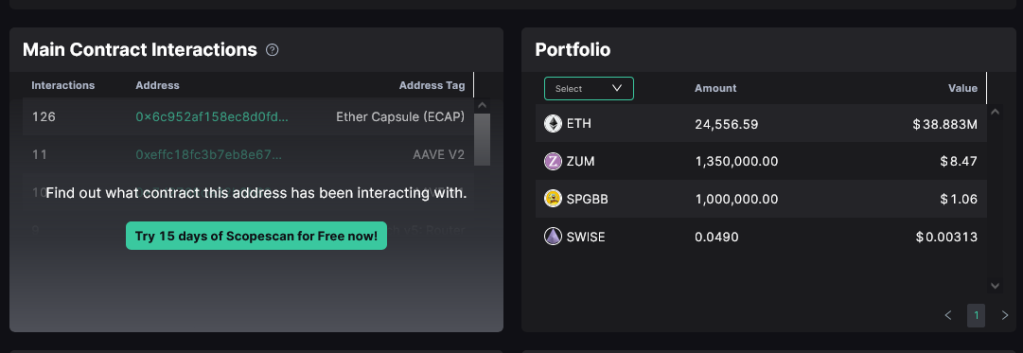
Apart from simply HODLing ETH, the whale has also been active on the non-fungible token (NFT) scene, looking at historical purchases. Over time, the investor has held over 100 NFTs where, on average, spent 0.2641 ETH; the latest purchase was on September 21.
The investor has been actively accumulating NFTs since early April 2023 and has spent over 35 ETH.
The whale has accumulated more ETH and NFTs when the crypto market is fragile. To illustrate, NFT trading volume is over 90% down from 2021 peaks.
Presently, ETH prices are down 25% from April 2023 peaks. When writing, bears have successfully forced the coin below June 2023 lows as the coin moves further away from the psychological $2,000 level. Candlestick arrangement points to weakness, suggesting that ETH could dump even lower to $1,400—or March 2023 lows, if sellers press on.
Binance, Binance.US and Changpeng Zhao filed to dismiss a Securities and Exchange Commission (SEC) lawsuit Thursday, claiming the regulator hadn’t “plausibly alleged” various securities-related violations.
A cryptocurrency wallet associated with the prominent trading platform, Binance, has seen massive activity in the last 24 hours, leading to abnormally high transaction fees on the Ethereum network.
A crypto wallet labeled “Binance 14” witnessed a significant transaction surge on September 21, rising above 140,000. As a result of this activity surge, transactions of the Binance-owned wallet consistently incurred gas fees of over 300 gwei, even though the network’s average fee was around 10 gwei.
This gas fee jump and significant wallet activity have resulted in around 530 ETH (equivalent to nearly $850,000) in gas used on the Binance 14 address today.
The increase in transactions on the Binance wallet had a broader, albeit temporary, impact on the Ethereum network. Gas fees on the blockchain momentarily jumped from less than 10 gwei to above 330 gwei per transaction, according to blockchain data tracker Etherscan.
Gas fees refer to the cost blockchain users incur or pay validators to conduct transactions or execute contracts on the Ethereum network. Fees depend on the blockchain’s demand and supply of processing power. This means when a network has many transactions, there is often a high demand for processing power, which increases gas fees.
In the wake of this incident, Wu Blockchain reported that Binance said it was carrying out its wallet aggregation process when the gas fees were low to facilitate withdrawals and ensure the safety of user funds. Nonetheless, some prominent crypto community members have weighed in on the situation, offering possible explanations for the gas fee spike.
Martin Koppelmann, cofounder of the Gnosis chain, said on the X (formerly Twitter) platform that Binance might be using a “really inefficient script” to consolidate, leading to high transaction costs.
Gas prizes spiking because of a ton of regular ETH transfers related to Binance.a) they are using a really inefficient script to consolidate funds and are massively overpaying transaction costsb) something fishy is going on
— Martin Köppelmann
(@koeppelmann) September 21, 2023
Blockchain analysts at Scopescan gave a similar prognosis on the gas incident. The on-chain analytics platform said:
Due to Binance consolidating funds from long-inactive deposit addresses, the Ethereum network is experiencing congestion, causing Gas fees to surge to 300 gwei.
Adam Cochran, a popular crypto investor, suggested that the abnormally high transaction fees might have been due to Binance’s subpar APIs. In his X post, Cochran criticized the exchange’s technological infrastructure while casting doubts on its capacity to safe-keep “hundreds of billions in coins across multiple protocols.”
According to CoinGecko data, the price of Ethereum currently sits below $1,600, reflecting a 2.8% decline in the past 24 hours. Nevertheless, Ether maintains its position as the second-largest cryptocurrency, with a market capitalization of over $190 billion.

JPEX staff forced to flee Token2049 after execs arrested, Mt Gox repayment delay stretches 10 years, Diners Club goes Web3 in Singapore.
Over the years, Cardano (ADA) has grown to be one of the most beloved cryptocurrencies, securing its spot as one of the top 10 largest cryptocurrencies by market cap in the process. However, while the Cardano network has grown tremendously, investors in its native ADA token have not been as lucky with profitability levels plummeting over the last two years.
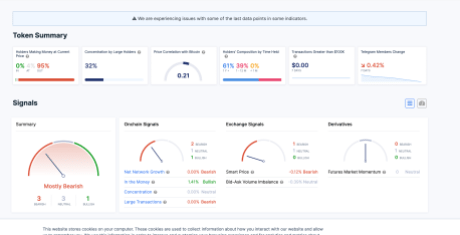
Data from the on-chain tracking website IntoTheBlock shows that ADA might be the worst performer of the top 10 in terms of profitability. While the other assets in the top 10 have managed to maintain a reasonable profitability level for holders during the bear market, ADA has been in free fall.
As a result of this, the tracker shows that the percentage of ADA investors seeing any kind of profit at this time has fallen to 0%. An alarming 95% of holders are reported to be seeing losses while 4% are sitting in neutral territory, meaning the prices at which these tokens were last moved correlate with the current price of the altcoin.
To put this in perspective, Bitcoin, the largest cryptocurrency in the market, is sitting at 64% of holders in profit. Ethereum, the second-largest cryptocurrency, is at 52% of holders in profit. Dogecoin, which is one spot ahead of Cardano on the list, is at 41% of holders sitting in profit.
Mid to long-term traders also completely dominate the ADA holder base. According to IntoTheBlock, 39% of all holders have held their coins between 1-12 months, while 61% of all holders have held for more than one year.
Despite the low profitability of the coin, investors seem to be looking toward ADA’s current price level as a good entry. This is evident in the CoinShares Digital Asset Fund Flows Weekly report that showed that despite massive outflows from digital asset products, Cardano held strong. The altcoin was able to maintain its inflow trend with another $0.43 million flowing from institutional investors into the asset.
Crypto analysts are also very bullish on the coin’s potential. One analyst, Kara Szabo, predicted that the price of ADA would rise as high as $5 in the next bull market, saying that the altcoin is in a prime price range for accumulation.
Another analyst Hashtoshi, also said in an interview that he expects the altcoin to exceed its previous all-time high price marked in 2021. Hashtoshi attributes this expected rise to the network’s design and strong community backing the token.
Since its inception, Bitcoin, the preeminent cryptocurrency, has witnessed several market cycles, each with its highs and lows. Its volatile nature has recently tested investors’ mettle, especially those who ventured into Bitcoin in the past three months.
New findings from analytics firm Glassnode have painted a detailed picture of the current scenario, revealing the challenges faced by short-term holders (STHs) of the premier cryptocurrency.
STHs, defined by Glassnode as entities holding Bitcoin for 155 days or less, have recently felt the heat. The firm’s research disclosed that roughly 97.5% of these investors grapple with unrealized losses.
To put it in perspective, as of September 17, Glassnode reveals the cost basis (or average purchase price) for those refraining from selling their BTC stands at $28,000, precariously hovering around 5% above the prevailing market rate.

This situation stresses those new to the crypto ecosystem, causing many to reconsider their potential investment strategies.
Delving deeper, Glassnode’s “The Week On-Chain” report highlights a marked change in sentiment among Bitcoin’s short-term holders. The firm identified a distinction between STHs based on their activity – those who spend their Bitcoin and those who hold.
An interesting trend emerged from this classification. The cost basis of the spenders dipped below that of the holders during the market’s descent from $29,000 to $26,000 in mid-August. This shift indicates a sentiment of concern and pessimism among the STH community.
Glassnode introduced a ‘trend confidence metric to quantify this sentiment further.’ This metric is derived by deducting the spender’s cost from the holder’s cost basis and dividing the resultant value by Bitcoin’s current price.

A pivotal takeaway from this metric was the evident negative shift in market sentiment. As stated in Glassnode’s conclusion:
The Bitcoin market is experiencing a non-trivial shift in sentiment, with almost all Short-Term Holders now underwater on their supply.
The firm noted that the current atmosphere of unease has been “unparalleled” since the FTX debacle. Glassnode noted:
This has resulted in a negative shift in sentiment, with investors spending now having a lower cost basis than the rest of the cohort. This suggests a degree of panic is dominating this group, which is the first time since FTX collapsed.
Meanwhile, although Bitcoin’s short-term holders are grappling with steep losses, the asset experienced a slight uptick yesterday, pushing its price above $27,000. However, this gain was short-lived as Bitcoin quickly retraced its steps, trading at $26,605 at the time of writing, with a 2.1% decline in the last 24 hours.
Featured image from iStock, Chart from TradingView
An appeals court rejected his attorneys’ attempt to free him in the run-up to the trial.
It wasn’t only the $90,000 spent on naming rights for a rare Ecuadorian frog species that turned off members of this decentralized blockchain-powered community project; some savvy arbitrageurs just wanted their share of the project’s treasury.


