A lack of network activity and ground lost to competitors could eventually play a role in ETH losing the $1,600 support.
Cryptocurrency Financial News
A lack of network activity and ground lost to competitors could eventually play a role in ETH losing the $1,600 support.
There’s a high probability of approval on or before the SEC’s final deadline in mid-October for a decision on the first ether futures ETF in the U.S.
Cross-chain bridge Synapse has seen the value of its native token SYN plummet after a liquidity provider (LP) dumped all their tokens. According to data from CoinGecko, the token’s price declined by nearly 25% a few hours after the sell-off.
On Tuesday, 5th of August, Synapse Labs announced – via a post on X (formerly Twitter) – that one of the liquidity providers sold their SYN tokens and removed liquidity from the Synapse protocol.
Lookonchain reported a whale dumping 9 million SYN tokens an hour after this disclosure. According to the on-chain analytics platform, the whale sold the tokens for roughly 2.35 million USDC in two separate transactions at $0.26.
Additionally, Lookonchain revealed that the whale received these offloaded funds from the “Synapse: Executor 2” wallet, establishing a link with Synapse Labs’ recent announcement.
Meanwhile, Colin Wu’s report corroborated this on-chain discovery while adding that $37.537 million in stablecoin liquidity was removed from the Synapse protocol.
Various reports have emerged in the last few hours, speculating on the identity of the liquidity provider responsible for the 9 million token sell-off and liquidity removal. Crypto researcher Wazz claims that Nima Capital is the LP behind these actions and has broken its liquidity-provisioning agreement eight months early.
Even VCs are rugging now @NimaCapital dumped 9M $SYN and removed all stablecoin liquidity 8 months before the agreed gov proposal
Their site went offline and twitter protected too https://t.co/ShlYcZhFbz pic.twitter.com/1ncxP13XYV
— Wazz (@WazzCrypto) September 4, 2023
In March, Nima Capital, a crypto venture capital firm, was designated Synapse’s first liquidity provider. According to the proposal, the firm committed to providing $40 million in actively managed stablecoin liquidity over twelve months while receiving 33% of bridge and swap fees.
Nima Capital appears to have limited its digital presence. As of this writing, the company’s website is offline and inaccessible to the public. Meanwhile, access to the firm’s X account has been restricted and is only available to confirmed followers.
It is worth noting that Synapse Labs didn’t reveal the identity of the liquidity provider in its announcement, and the team has yet to provide any further updates on the situation.
The liquidity removal and token sell-off have also impacted Synapse’s total value locked (TVL). According to DefiLlama data, the cross-chain protocol’s TVL has dipped by nearly 20% in the past day.
As noted earlier, the value of SYN suffered an almost 25% decline after the liquidity provider dumped its holdings. The token’s price crashed from $0.401 to $0.309 in hours.
SYN has since been showing glimpses of recovery, as it now trades above $0.35. According to CoinGecko data, the token is valued at 0.356092, with a 0.5% price increase in the past hour.
A broader look at its price performance shows that the SYN token has struggled in the last few months. After notching a yearly high of $1.59 in late February, the cryptocurrency has reversed all its gains, trading 77% beneath the 2023 peak.
The SEC was last week ordered to review its prior rejection of the conversion of the Grayscale Bitcoin Trust (GBTC), though not necessarily to approve it.
Coinbase (COIN) raised $57 million for the platform as of Sept. 1, according to an SEC filing.

The first-of-its-kind architecture gives up to a 7x speedup over traditional training methods.

Bitcoin’s failed breakout to the upside hints that range-bound price action could be set to continue. Meanwhile, TON, LINK, MKR and XTZ begin to perk up.
On-chain data shows that 44.2% of all Ethereum investors are now carrying their coins at a loss, a sign that the bottom may be close for the asset.
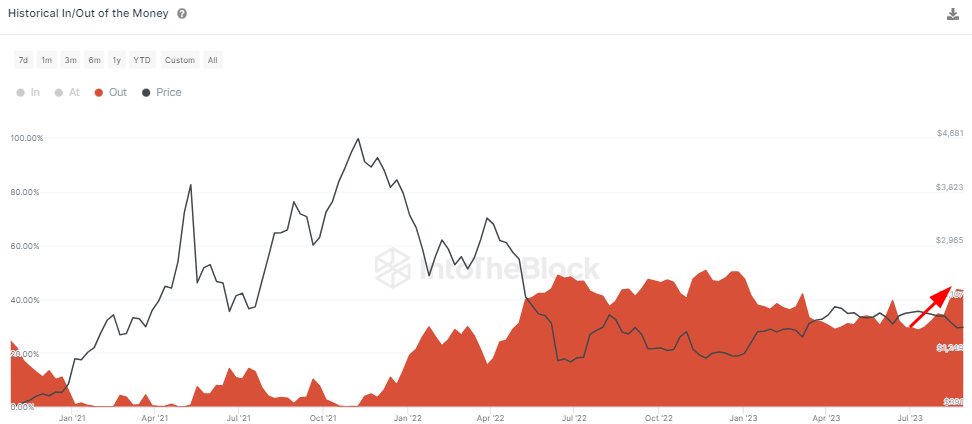
According to data from the market intelligence platform IntoTheBlock, the percentage of ETH investors in loss has grown sharply since early July. The relevant indicator here is the firm’s “Historical In/Out of the Money,” which tells us about the percentage of Ethereum investors in profits and losses and those that are just breaking even.
The metric determines whether an investor is in profit or loss by looking at their address history to check for the average price at which they acquired their coins. Naturally, if the asset’s current spot price is less than a holder’s cost basis, then that particular holder is carrying their coins at a net profit.
Similarly, the cost basis being equal to and less than the spot price would imply that the investor is breaking even on their investment and holding at a loss, respectively.
Now, here is a chart that shows the trend in the Historical In/Out of the Money indicator for Ethereum over the past few years:
IntoTheBlock has only listed the data for the Ethereum investors in losses, as this is the number of interest in the current discussion. The combined percentage of the investors breaking even and carrying profits can also be deduced from this value, as the total percentage must add up to 100%.
In early July, Ethereum holders underwater were at about 27%. It’s visible in the graph, however, that the indicator has observed a notable uplift since then, as the price of the cryptocurrency has registered a drawdown.
Today, the indicator’s value is at 44.2%, meaning that almost half of the Ethereum user base is holding their coins at losses. Generally, the more the investors get into profits, the more likely they become to sell to harvest those gains.
Due to this reason, corrections in the asset become more probable to form whenever an extreme majority of the market is enjoying profits. A large percentage of the holders being in losses instead, however, can have the opposite effect on the price since they can lead towards bottoms as profit sellers become exhausted.
Related Reading: This Could Be The Metric To Watch For A Bitcoin Bounce: Santiment
Since the start of the bear market last year, the highest the metric’s value has gone is 50%, implying that exactly half of the investors had been in losses back then. This value isn’t too far off from the current one, suggesting that Ethereum may be close to forming a bottom.
If a similar loss percentage is hit with the bottom this time, ETH would first suffer from some more downtrend so that enough investors drop underwater.
Ethereum has continued to move flat recently; as of this writing, it trades at about $1,600.

The RLN, which places tokenized assets and liabilities on the same ledger, was tested with simulated cross-border CBDC transactions in a previous project.
A proposal from Matter Labs co-founder Alex Gluchowski would see a “hierarchical system of on-chain courts” arbitrate on-chain disputes.
The XRP price has been showing promises of a price spike since Ripple’s victory against the US SEC. Many community members are currently keeping a close eye on the cryptocurrency, and hoping for a significant price increase. One crypto analyst, in particular, has predicted a massive run for the altcoin that could see its price hit triple-digits.
Following its partial victory against the United States Securities and Exchange Commission (SEC) in July after Judge Analisa Torres ruled in favor of Ripple labs, XRP, the native token of Ripple, has fluctuated heavily despite the positive sentiment surrounding it. Nevertheless, an analyst sees a potential bull run for the altcoin.
Crypto analyst and XRP influencer, XRP Captain, has predicted a significant price jump for the XRP token on an X (formerly Twitter) post. XRP Captain shared a chart with a symmetrical triangle pattern which he used to predict XRP’s $130 future price movement.
Apparently, XRP has a history of symmetrical triangle patterns. In 2017, the cryptocurrency broke out of a similar symmetrical triangle pattern which pushed the token to new all-time highs. As for when this will happen, the analyst points toward the expected 2024 bull run.
Can You Imagine The Magnitude When This Breakout Happens
?? I Won’t Be Surprised If #XRP Hit 100$ To 130$ In Next Bullrun
. #XRP Consolidation 2014 To 2017 VS 2018 To 2024. Full Throttle #XRPHolders #XRPCommunity pic.twitter.com/gm9hLiqh6M
— XRP CAPTAIN (@UniverseTwenty) September 3, 2023
The analyst is not the only one who has predicted a bull run for the altcoins. Earlier in August, a pseudonymous analyst also predicted a massive rally for XRP that could see the token reaching its previous all-time high of $3.
In this case, the analyst highlighted that the XRP/BTC pair had finally reclaimed the 20-day and 50-day moving averages, and the last time this had happened had also been back in 2017. This led to an over 500% increase in the price of the altcoin at the time.
This is the first time we have seen this for $XRP in 5 years!
$XRP / $BTC on the monthly timeframe has reclaimed the 20 and 50 SMA.
Not only this, but it has also wicked back to the 50 SMA to test it as support (if we continue to hold out the month).
The last time we… pic.twitter.com/d5zjzwcTvm
— Cryptoinsightuk (@Cryptoinsightuk) August 13, 2023
Following XRP Captain’s prediction of XRP’s possible bull run, other crypto analysts have also shared their thoughts on the sheer incredulity of the prediction.
Another crypto trader and chartist, JD was enthusiastic about the technical patterns XRP price charts were displaying. He explained that the symmetrical triangle was accurately represented. However, he could not see the price of XRP reaching three digits.
“I just can’t see that 3 digit target. $20s are still in the cards though,” he stated.
XRP price has also been notably down. However, XRP Whales are not deterred as these large investors are taking advantage of the market downturns and buying up hundreds of millions worth of tokens.
XRP is currently looking toward a reversal with its price seeing meager gains of 0.02% in the last day. However, it is still struggling on the weekly chart with losses of 2.61%.

The sell feature on MetaMask Portfolio came roughly five months after the wallet allowed users to purchase crypto using fiat from bank accounts, PayPal, and debit and credit cards.
Prominent crypto research firm Kaiko reports that the XRP token recorded impressive trade volume strides across August 2023. This development comes amidst the token poor price performance in the said month.
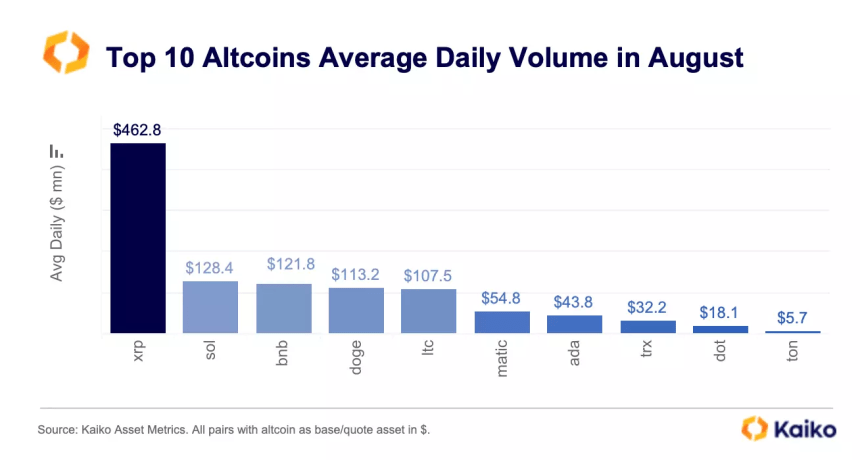
According to the latest Data Debrief by Kaiko on September 4, the market research firm notes that XRP recorded an average daily trade volume of $462.8 million in August, representing the highest value of that metric in the altcoin market.
Solana (SOL) followed in second place, with a trade volume of $128.4 million. Other altcoins that also experienced a significant average daily trade volume in August included Binance Coin (BNB), Dogecoin (DOGE), and Litecoin (LTC), among others.
As earlier stated, XRP’s surge in trading volume was accompanied by underwhelming market performance. Kaiko notes that the altcoin experienced a 25% price decline in August.
This negative price performance was in much contrast to July, during which XRP had recorded lofty gains following Ripple’s partial victory over the United States Securities and Exchange Commission (SEC).
To explain the contrast between XRP’s negative price performance and its surging trade volume, Kaiko has provided some interesting, in-depth analysis.
According to the research firm, the court ruling in July led to a large demand for XRP by US traders, as was seen in the token’s price movement. Kaiko noted that the XRP average trade size on Coinbase, the largest US crypto exchange, experienced a significant boost, surpassing all top ten altcoins.
However, this massive XRP demand was only present in the US. Kaiko states there was high selling pressure on foreign exchanges, indicating that most investors sold off their tokens to capitalize on XRP’s gains from its court victory.
In particular, Kaiko reported that the South Korean exchanges Upbit and OKX recorded the strongest XRP selling pressure for August.
Kaiko notes that the XRP’s trading volume is higher on foreign markets than on US exchanges. The research firm reported:
Overall, the share of XRP traded on U.S. markets remains lower than on offshore exchanges. XRP is only the sixth most traded altcoin in the U.S. by cumulative trade volume, while it tops the list on offshore markets.
Therefore, the high demand for XRP in the US was overwhelmed by higher selling pressure on the global market, which explains why the XRP market price took a nosedive in August.
At the time of writing, XRP trades at $0.503, having gone up by 0.17% in the last day based on data from CoinMarketCap. However, the fifth-largest cryptocurrency is still in the red zone and is down by 2.28% and 19.70% on the weekly and monthly charts.

According to the 215 computer science professors surveyed, AI might not be as big of a displacer as the C-suite claims.

Bitcoin SLRV Ratio data performs a moving average crossover absent since before the FTX implosion hit the market.
Solana is one of the fastest growing cryptocurrency platforms thanks to its high speed and low costs. Launched in 2020, its native SOL token has seen massive appreciation.
Here we analyze Solana’s price outlook for the future using technical analysis to provide an evidence-based Solana price prediction guide.
Solana is a highly scalable decentralized blockchain created by Anatoly Yakovenko in 2017. It uses a unique proof-of-history consensus mechanism to achieve high transaction speeds and low fees while maintaining security.
The native cryptocurrency of the Solana network is SOL. It is used to pay for executing transactions, interacting with smart contracts, and staking on the blockchain.
Some key aspects of Solana include:
Speed
Solana can process over 50,000 transactions per second, significantly faster than Bitcoin or Ethereum.
Low fees
With high speed, Solana offers transaction costs as low as $0.00025 making it ideal for DeFi.
Proof-of-History
This novel consensus mechanism coordinates timeline between nodes without slowing things down.
Programming
Solana supports programming languages like Rust and C++ to develop dApps.
Staking
SOL holders can stake tokens to help validate transactions while earning staking rewards.
Solana’s powerful performance makes it a leading choice for developing fast, scalable DeFi applications and services.
Several core factors determine the price movement and growth potential of SOL:
Cryptocurrency Market Conditions
Like most altcoins, Solana’s price depends significantly on Bitcoin and overall crypto market trends. A rising market lifts SOL.
Adoption by Developers
As more projects build DEXs, NFT marketplaces, Web3 applications etc on Solana, demand for SOL increases.
Competition From Rival Networks
Alternative scalability solutions like Avalanche, Polkadot or Cardano could fragment developer interest and diminish Solana’s growth potential if they gain traction.
Network Upgrades and Innovation
Upgrades to further boost Solana’s speed and capabilities can augment developer demand, boosting SOL’s value.
Staking Trends
Higher staking activity reduces available SOL supply which may lead to appreciation in token price.
Network outages or vulnerabilities could damage confidence in Solana and depress SOL price. Smooth performance boosts its reputation.
SOL’s price has seen huge growth since launching, but also periods of instability. Let’s look at key highlights:
2020 – Minimal Trading After Launch
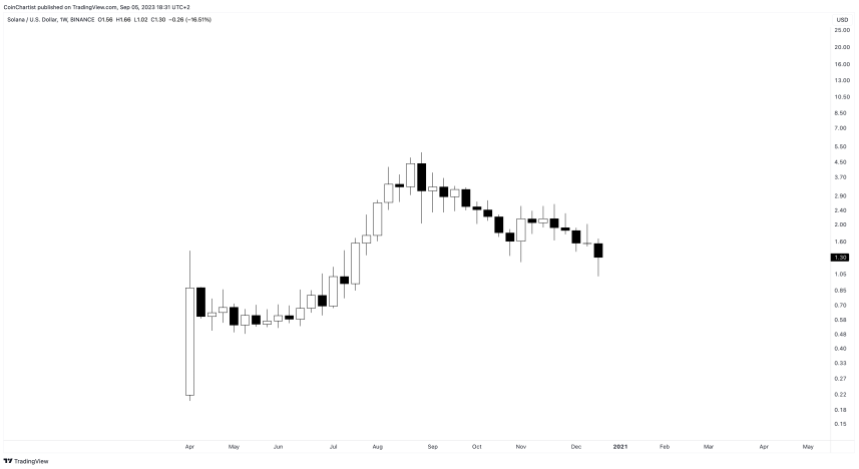
Solana launched the mainnet in March 2020 with SOL starting off around $0.50 initially with minimal exchange availability and trading. By December 2020, it reached $1.52 as trading volumes gradually picked up.
2021 – Massive Breakout
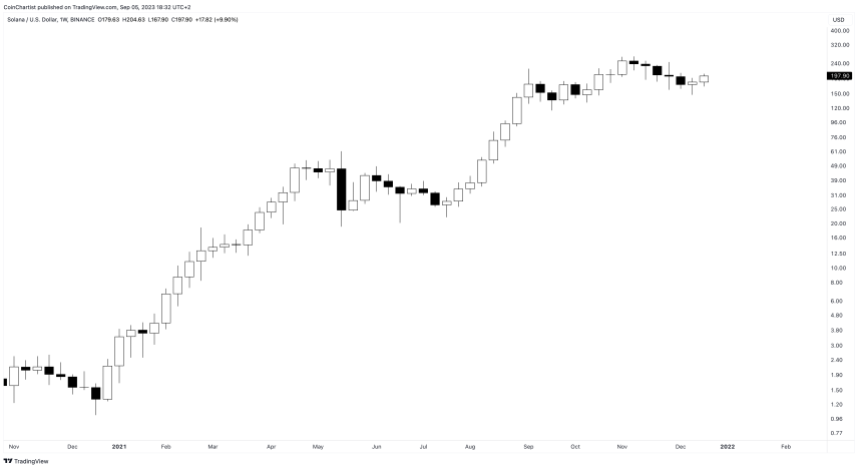
The 2021 crypto bull run catapulted Solana into the limelight with SOL surging exponentially from $3 in January 2021 to a peak of $260 by November 2021 – an unbelievable 8700% return within 10 months!
Driving this were:
This established Solana as a leading Ethereum competitor. But lack of maturity showed…
2022 – Crash and Outages
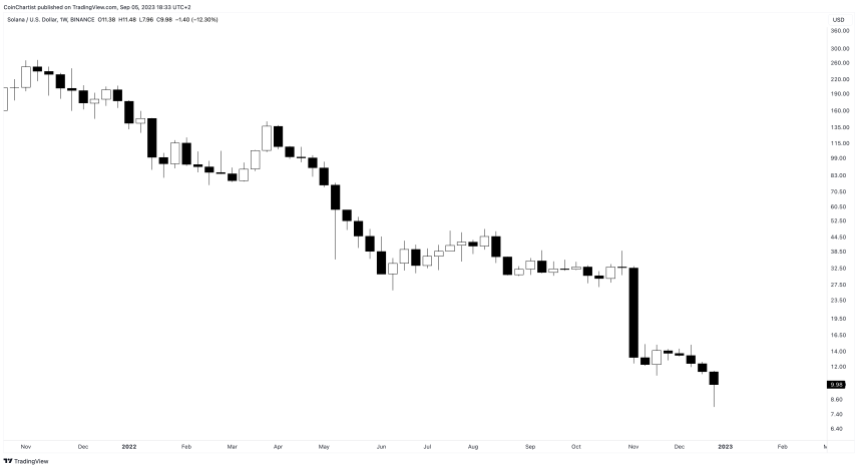
In 2022, the crypto downturn brought SOL back down below $40 from its highs. More damaging were network outages in 2022 that dented confidence in Solana’s stability. The final days surrounding the FTX collapse, Solana also suffered, taking the cryptocurrency to a 2022 low of $8.
While still early days for such a nascent project, Solana needs to improve reliability to gain institutional trust. But its developer momentum continues unabated, with over 4000 projects built on Solana so far.
Recent SOL Price Analysis
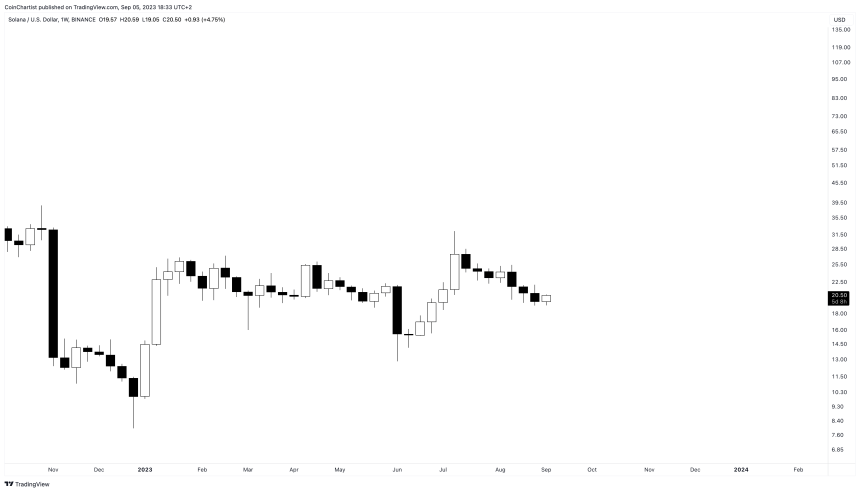
Solana has been recovering throughout 2023, but the US SEC hasn’t made it easy, attacking altcoins around every turn. Each time altcoins like SOL attempt to gain momentum, the SEC files another case against a crypto exchange. Past filings include naming Solana as a possible unregistered security.
However, it continues to be the choice for big institutions such as VISA, which is launching a stable coin payment system on Solana.
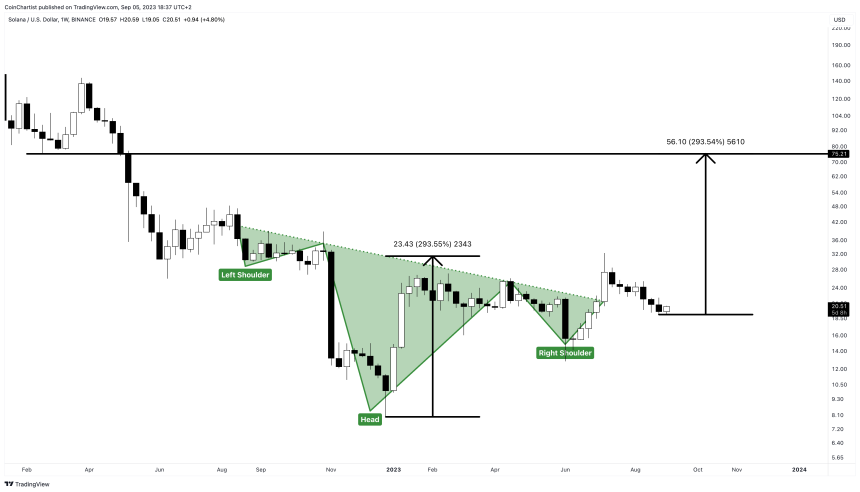
The latest bullish news that VISA is using Solana for its stable coin payments could propel SOL higher and reach the target of this inverse head and shoulders pattern, with a target of $75 per token.
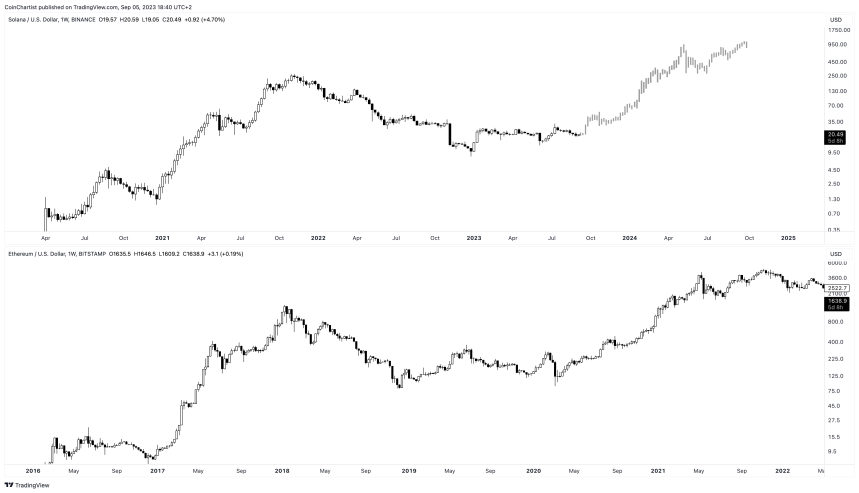
Solana very closely mimics the price action of 2016 through 2020 Ethereum. If another similar rally follows in Solana like it did in Ethereum, SOL could approach upwards of $1,000 per token.
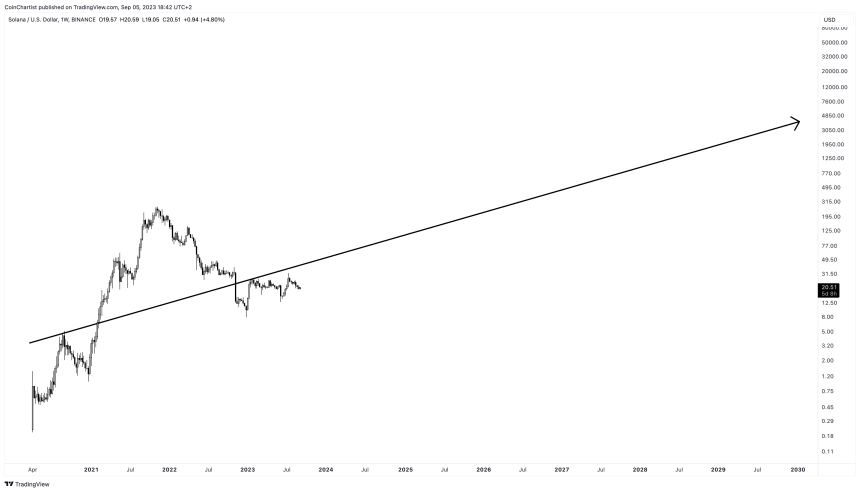
In the longest term outlook, it becomes much more challenging to properly predict what SOL might do. It very much depends on adoption of the SOL token, the Solana blockchain, and crypto itself. If SOL can maintain its current mean trajectory, then it is possible Solana could be priced around $3,000 to $4,000 by the year 2030 or beyond.
Solana has demonstrated immense potential with its blazing fast speeds at low costs. But it still has much to prove regarding stability and institutional-grade security.
If Solana can build on its developer momentum and rapidly evolving ecosystem while improving reliability, its long-term growth upside is immense. But execution risks remain for this ambitious project aiming to reshape decentralized finance.
Let’s look at some common questions crypto investors have about SOL price analysis:
What was Solana’s lowest ever price?
SOL sank to as low as $0.50 in the early days after its mainnet launch in 2020. Its 2022 low was around $8 amidst broader crypto market weakness.
What was the highest price for Solana?
Solana’s all-time high price stands at $260 reached in November 2021 during strong bullish momentum carrying crypto markets higher.
Is $500 realistic for Solana?
SOL reaching $500 is achievable this decade if Solana fulfills its technological promise and sees high adoption as the leading DeFi blockchain.
Can Solana crash to zero?
A complete collapse is unlikely given Solana’s strong fundamentals unless critical flaws emerge in its core protocol. But extended weakness could sink SOL below $10 until a recovery.
Why is SOL price volatile?
As a relatively new asset with limited liquidity, Solana experiences high volatility from speculative trading and sentiment shifts. As adoption increases, volatility should stabilize.
When will Solana’s price stabilize?
Solana price swings may start normalizing once it builds a large user base and matures technically. But as a crypto asset, some volatility will always remain.
On-chain data suggests the $33,700 level could be a very significant level to break for Bitcoin if the historical pattern is anything to go by.
In a new post on X, Ali, an analyst, has shared a chart that could shed light on the path that BTC may end up taking. The relevant indicator here is the “realized price,” which tells us about the price at which the average investor in the Bitcoin market acquired their coins.
Related Reading: Bitcoin Exchanges See Three Straight Months Of Withdrawals For First Time Ever
When the spot price of the asset exceeds this line, it means that the holders as a whole are currently carrying a net amount of profit on their coins. On the other hand, BTC being below the level suggests the average investor is underwater right now.
In the context of the current discussion, the cost basis of the entire market isn’t of relevance, but of only a specific segment: the holders who acquired their coins at least six months and at most three years ago.
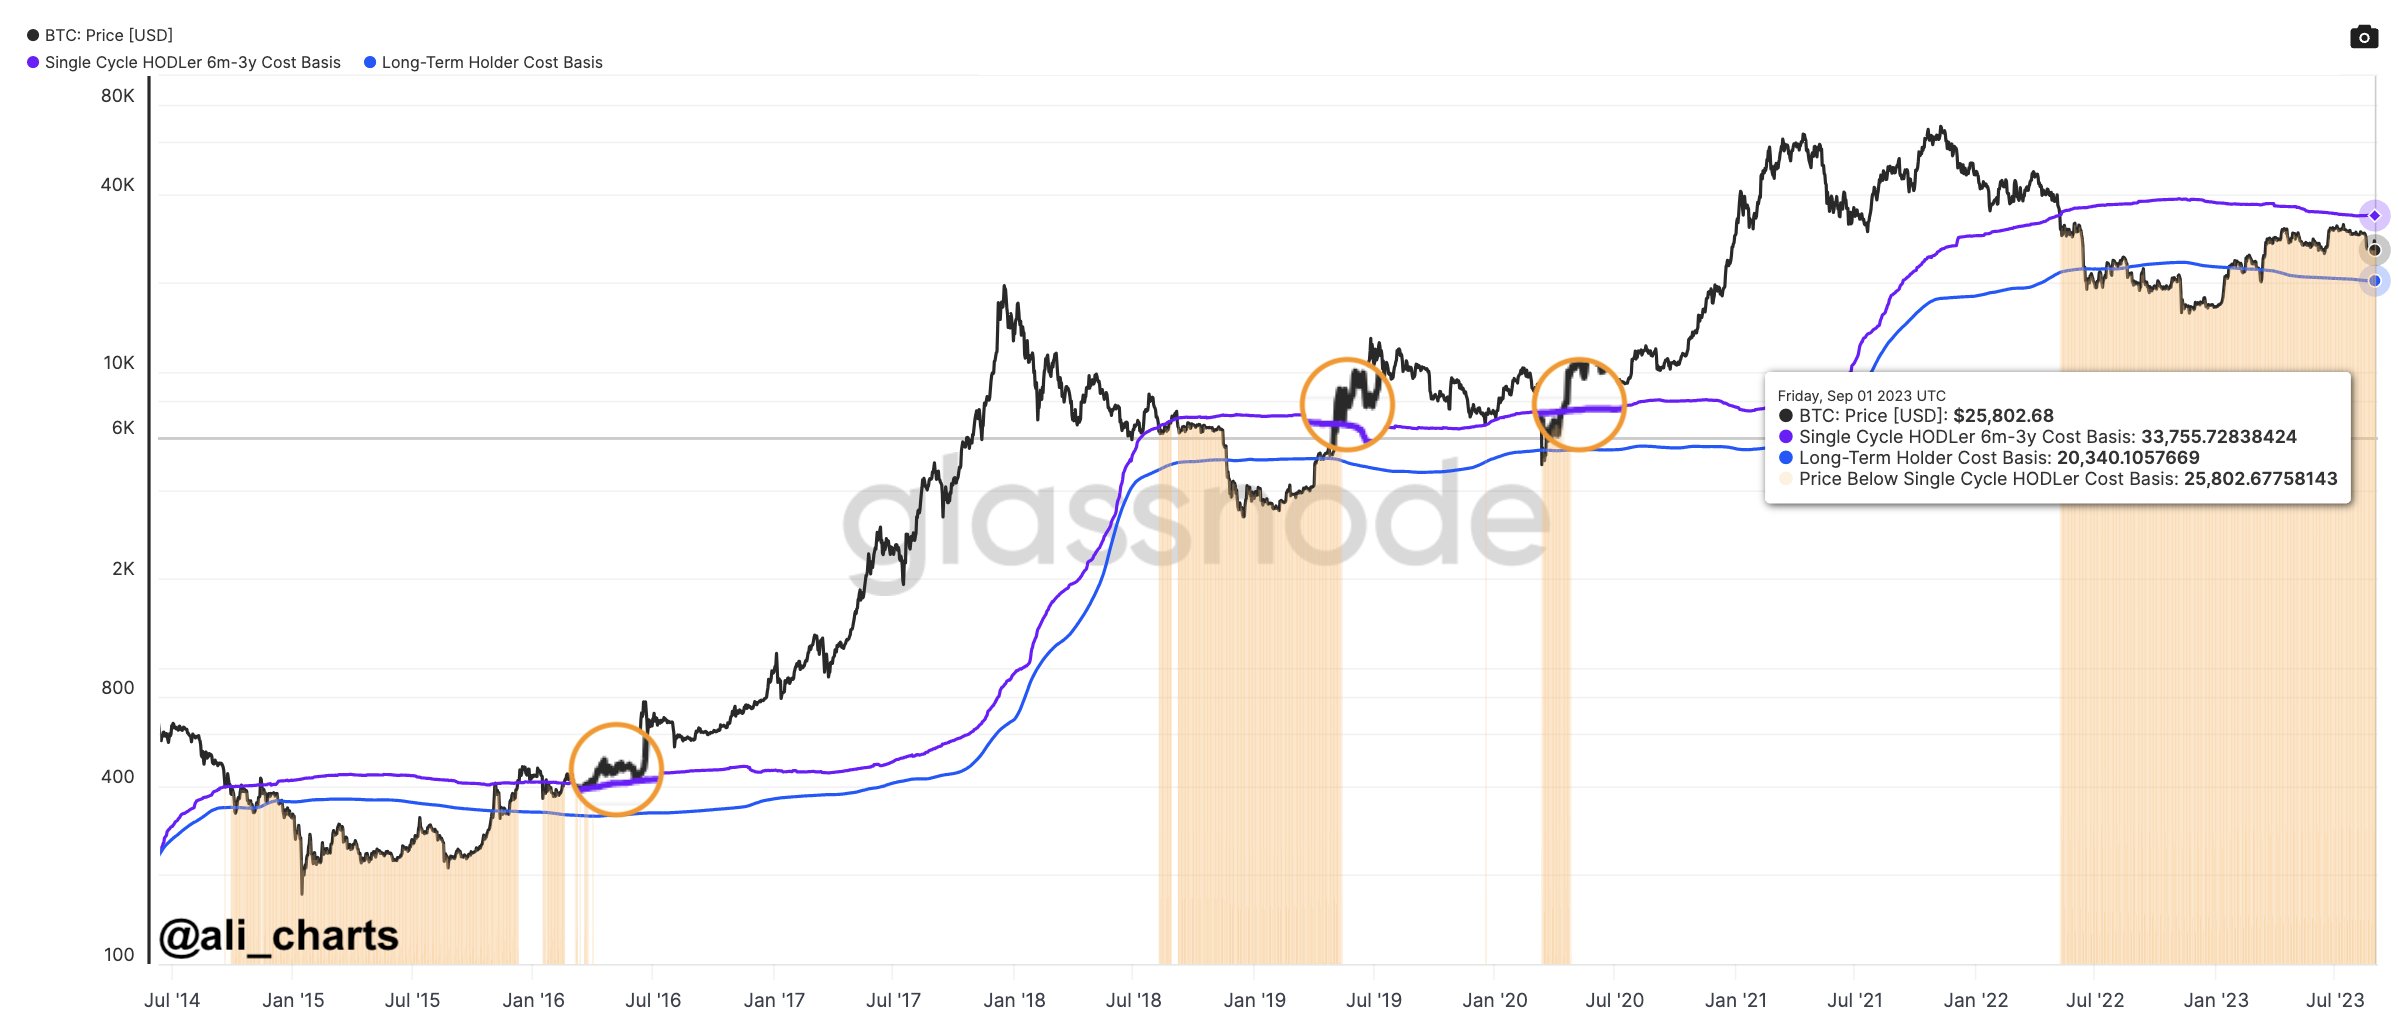
Here is a chart that shows how the cost basis of these Bitcoin investors has changed over the years:
The six months to three years old investors are actually a part of the larger “long-term holder” (LTH) group. And the LTHs are simply the investors who bought their coins at least six months ago.
In the chart, the analyst has also attached the data for the cost basis of the entire LTH group and it’s visible that this metric currently has a value of about $20,300, meaning that the spot price is currently a decent distance above this line.
The realized price of the six months to three years old holders, however, is above the spot price right now, as it’s valued at about $33,755. Naturally, this means that this segment of the LTHs is currently firmly in the red.
From the graph, it’s also apparent that the Bitcoin price has not touched this level since early 2022, when the bear market first kicked off. If the cryptocurrency can surge towards the level and finally make a retest of it, then its fate might change for the better.
This is because, as Ali has pointed out, BTC has observed a significant rally whenever the asset has crossed this mark and these HODLers have gotten back into profits.
Three instances of this pattern are clearly visible in the chart. The 2017 bull run, the April 2019 rally, and the 2021 bull run all emerged from successful breaks of the cost basis of the six months to three years old LTHs.
If this historical pattern holds any weight at all, then a Bitcoin break above the $33,700 level in the near future could become the starting point of the next major bull run.
At present, Bitcoin is quite a bit below the cost basis of these LTHs, as its price is trading just under the $25,800 level.

Circle’s USDC is now available natively on Base and Optimism, and Coinbase accounts can transfer the stablecoin to Base for the first time.