New Bull Run For Bitcoin If It Breaks This Level, Expert Addresses Elephant In The Room

The Bitcoin price is on the move as bulls take over the market and reclaim previously lost territory. While the rally signals potential, BTC still needs to overcome significant resistance at higher levels.  

As of this writing, Bitcoin (BTC) trades at $27,300 with a 5% profit in the last 24 hours. In the previous seven days, BTC recorded similar profits as other cryptocurrencies in the top 10 see gains for the first time in over two weeks.

Bitcoin price BTC BTCUSDT

$30,000 Are The $12,000, A Bitcoin Bull Run In The Making

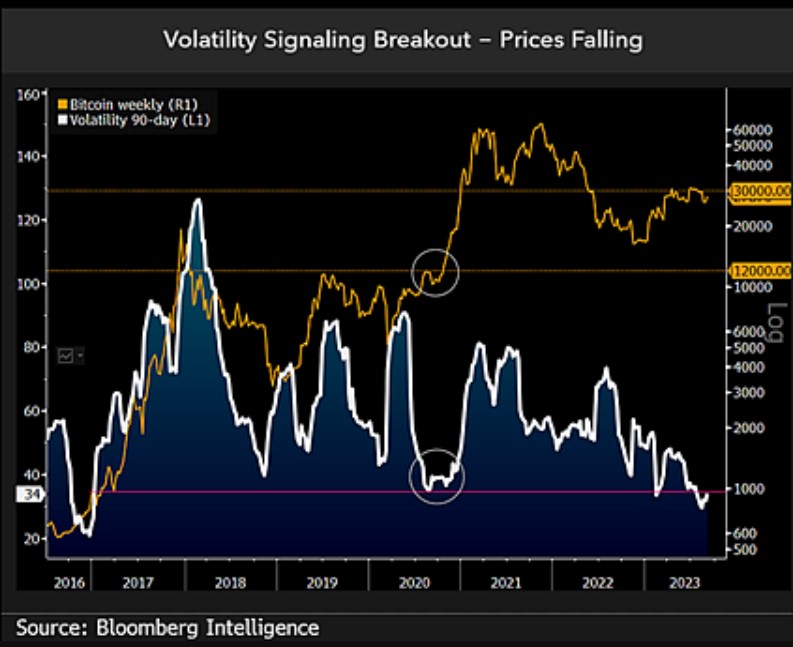
According to Bloomberg Intelligence’s Mike McGlone, the current Bitcoin price action is akin to that display before the 2020 bull run. At that time, macroeconomic forces influenced the crypto market as BTC prepared for a Halving event.

The cryptocurrency also struggled to reclaim a critical level of around $12,000. McGlone believes that $30,000 is similar to that level and that breaching it would open the door for further gains, but are the conditions given for such an event?

NewsBTC has reported that the biggest catalyzer for a Bitcoin bull run lies with the US Securities Exchange Commission (SEC). The cryptocurrency might have a massive capital inflow if the regulator approves a spot BTC Exchange Traded Fund (ETF).

Yesterday, asset manager Grayscale scored a victory against the Commission, and a US judge ruled in favor of the company in their Bitcoin ETF lawsuit. The expert commented the following on this development and how it can pave the way for a BTC rally:

The inevitable approval of Bitcoin exchange traded funds in the US is moving closer, but the elephant in the room for all risk assets remains – the Fed is still tightening (…). Sustaining back above $30,000 would indicate a reversal upwards akin to a similar pattern around $12,000 in 2H20.

Of course, McGlone doubts the cryptocurrency can push above $30,000 in the short term. Despite the similarities between the current price action and 2020, there are two significant obstacles: the Fed’s monetary policy and the low liquidity in the financial markets.

As a result of these conditions, the chart below shows the BTC price trending to the downside, with volatility moving in the opposite direction. The expert believes this dynamic potentially sets the stage for Bitcoin to drop into the $12,000 region.

Bitcoin price chart 2 BTC BTCUSDT

While these factors remain, Bitcoin will likely move sideways around its current levels, but the cryptocurrency will keep its bullish structure even if this scenario plays out.

Cover image from Unsplash, chart from Tradingview

Shibarium Reaches Key Goals: Is SHIB Poised For New Heights?

In a surprising turn of events, Shiba Inu (SHIB) experienced a brief consolidation break, reaching a 10-day high of $0.00000850, following the overall market uptrend on Tuesday. 

This upswing was further fueled by Grayscale’s legal victory against the US Securities and Exchange Commission (SEC). However, Shibarium, the Ethereum layer-2 network backed by SHIB tokens, was the most significant catalyst for the newfound optimism. 

Shibarium’s Resurgence Fuels Bullish Sentiment For SHIB Price

Shibarium, the layer-2 blockchain explicitly designed for the Shiba Inu token SHIB, has achieved a significant milestone with a remarkable surge in wallet count, reaching 337,100.

This surge in new wallet addresses indicates renewed interest and heightened expectations, following recent challenges faced by the SHIB-backed layer-2 platform.

SHIB

The surge in wallet activity clearly demonstrates restored confidence in Shibarium and its potential to provide an “enhanced user experience.” Moreover, the transaction count has rebounded significantly, recovering from a dip that saw daily transactions drop to 40,000 on August 27, after peaking at 132,000 on August 25.

The resurgence, growing confidence, and surge in new wallets and daily transactions have made Shibarium an attractive option for retail investors seeking faster, more cost-effective, and private off-chain transactions while benefiting from the underlying security of the blockchain.

After a difficult start, Shiba Inu delivered positive news by announcing the successful functionality of the highly anticipated Shibarium Bridge on August 28, 2023. This bridge facilitates seamless movement of funds from the Ethereum Layer-1 to the Layer-2 Shibarium platform, improving transaction speed and reducing fees.

Shibarium initially encountered challenges upon its launch, experiencing significant user and transaction volumes that caused an “outage.” 

To tackle this issue, according to crypto influencer Keyur Rohit, Shytoshi Kusama, co-founder of SHIB, sought assistance from Sandeep Nailwal, co-founder of Polygon Labs. Together, they resolved the problems, ensuring the safety of funds. Kusama expressed gratitude to Sandeep for his help.

Notably, in the aftermath of the initial challenges, Shibarium undertook significant improvements. The team expanded their server infrastructure by an impressive 1500% to “better handle” on-chain congestion. 

These corrective measures have resulted in rapid growth of the user base and an increase in the price of the SHIB token.

Additionally, Shibarium has achieved a notable Total Value Locked (TVL) of $1.42 million. This achievement signifies a significant milestone and reflects the increasing enthusiasm within the Shiba Inu network.

SHIB’s Uptrend At Risk? 

SHIB’s recent recovery and positive developments within its native ecosystem have failed to sustain the initial excitement, as the token’s price action has experienced a sharp decline. Over the past 24 hours, SHIB has lost more than 3% of its value, currently trading at $0.00000813.

SHIB

Adding to the concern is the token’s inability to surpass its 50-day Moving Average, as depicted by the brown line on the daily chart above. Since July 2023, when SHIB briefly surged to the $0.000001137 mark, it has struggled to break above this key moving average.

However, there is a glimmer of hope if the overall market, particularly the flagship cryptocurrency, Bitcoin (BTC), paves the way for improved liquidity in the emerging sector. 

If SHIB manages to surpass this significant moving average, it could signal the potential for another strong uptrend, similar to the ones witnessed in July and January, during which the token reached its yearly high.

Featured image from iStock, chart from TradingView.com

Cardano HODLing: Long-Term Holders See 170% Rise In Past Year

On-chain data shows the number of Cardano (ADA) long-term holders has increased by 170% during the past twelve months.

Cardano & Litecoin Have Seen Most Growth In Long-Term Holders

In a new post on X, the market intelligence platform IntoTheBlock has revealed data related to the long-term holders of the various assets in the sector. The “long-term holders” (LTHs) here refer to all those investors who bought their coins at least one year ago.

These HODLers are generally the most committed hands in the market, as they rarely participate in any selling. This cohort doesn’t usually budge even when FUD has taken over the market or an enticing profit-taking opportunity has appeared.

Because they keep their coins locked away for long periods, the LTHs can naturally affect the economics of any cryptocurrency (although their effects don’t appear during the short term).

Now, here is an infographic from IntoTheBlock that shows the total number of LTH addresses present on the networks of some of the top assets in the sector, as well as their percentage changes during the past year:

Cardano Long-Term Holders

As displayed above, the number one ranked cryptocurrency, Bitcoin (BTC), currently has 33.6 million LTH addresses, reflecting an increase of 17.6% during the past twelve months.

Despite its lower market cap, Ethereum (ETH) has BTC beat in this metric, as the number of LTHs on the chain is, interestingly, around 73.9 million, more than double what BTC has. The network has also observed a sharper growth in this indicator at about 44.2%.

This is also even though Bitcoin is also much older, meaning that it would have been able to accumulate more LTHs over the years in the form of lost coins, as such addresses would also fall under this category (although they certainly don’t carry the same meaning as an investor willingly choosing to HODL).

While these largest coins have seen some decent increases in the number of LTHs, Litecoin (LTC) has them very easily beaten with its 100% growth, implying that HODLers on the blockchain have doubled during the past year. LTC is still far behind in terms of the pure number of LTHs, as the network hosts just 4.9 million.

Cardano, however, has complete victory over even LTC’s rapid growth, as the coin has seen LTHs go up by more than 170% in this period. This astonishing rise has taken ADA’s total HODLer count to 2.65 million.

Chainlink (LINK) appears to be the only cryptocurrency in the table that has seen an adverse change in its number of LTHs, as the asset’s HODLers have decreased by about 3%.

The strong increases in the indicator for Cardano and Litecoin can naturally be constructive signs for their prices, as it shows an increasing tendency among the investors to hold onto their tokens for extended periods.

ADA Price

Cardano has failed to hold onto its gains from the latest rally, as the asset’s price has already fallen towards the $0.26 level.

Cardano Price Chart

XRP Poised For Bullish Breakout: Inverted Hammer Formation Signals Rise Above $0.8 Resistance

After the initial excitement surrounding Ripple Lab’s partial legal victory against the US Securities and Exchange Commission (SEC) subsided, XRP experienced a decline that led it to test its 4-month support line at $0.4240. 

However, the cryptocurrency has demonstrated resilience by reclaiming its important psychological level of $0.50 and reentering its previous consolidation or accumulation zone. This renewed stability has sparked optimism among bullish investors, indicating a potential rebound for XRP.

Presently, XRP is trading at $0.5295 with a 24-hour trade volume of $1,419,623,015.56. This reflects a 1.89% increase in price over the last 24 hours and a 1.60% increase over the past 7 days. 

These gains and a promising chart formation suggest that XRP may be poised for further growth in the days and months ahead.

Potential XRP Breakout As 2-Month Candle Nears Conclusion

Crypto analyst Egrag Crypto, known for insightful market analysis, recently took to the social media platform X (formerly Twitter) to highlight an intriguing development in the XRP market. 

As the two-month candle for XRP draws to a close, it displays the potential formation of an inverted hammer pattern.

For further context, the inverted hammer is a technical analysis candlestick pattern that typically appears at the end of a downtrend. It is characterized by a small body at the candle’s upper end, with a long upper shadow and little to no lower shadow.

The inverted hammer pattern suggests a potential reversal in price direction. It indicates that buyers have stepped in after a period of selling pressure, causing the price to bounce back from its lows. 

XRP

As seen in Egrag’s chart above, throughout 426 days, XRP has demonstrated remarkable resilience, maintaining its market structure and solidifying its foundation amidst market fluctuations. On this note, Egrag further claimed:

The chart unequivocally illustrates this trend, consistent with my earlier analyses wherein I underlined the significance of the 0.80c mark as a pivotal macro resistance level. Establishing this price range as a foundation marks a highly bullish macro stance. 

Notably, per the information compiled by the analyst, this consolidation around the mentioned price range indicates a highly bullish macro stance for XRP

Egrag Crypto predicts a scenario where the upcoming candle could propel XRP towards the $2.3 range. However, this achievement would merely serve as a stepping stone within a larger macro range of $3.3 to $5.5, signaling a seamless continuation of XRP’s upward trajectory.

Egrag Crypto’s symbolic reference to Valhalla beyond the $5.5 threshold reflects the analyst’s belief in the substantial potential for XRP’s future growth. While these words evoke a sense of grandeur, they emphasize the possibility of XRP reaching unprecedented heights in the market.

XRP

Amidst growing anticipation within the crypto community, all eyes are on the impending conclusion of the two-month candle, which holds the key to a potential breakout indicated by the inverted hammer formation. 

This pivotal moment raises questions about whether the cryptocurrency and the broader market are on the cusp of another upward trend, supported by favorable macro conditions, or if they will face a test of lower resistance levels again.

Featured image from iStock, chart from TradingView.com

GBTC Shares See Volumes Climb To 2-Year High Amid Grayscale’s Victory Lap

On August 29, the US Court of Appeals ruled in favor of Grayscale in its legal battle against the US Securities and Exchange Commission (SEC). Following this, Grayscale’s GBTC shares trading volume significantly increased, climbing to a 2-year high in the process.

GBTC Shares See 17% Increase

According to data from Yahoo Finance, GBTC’s share price had opened at $17.66 on the day and closed at $20.56, rising by almost 17% from the previous day. Furthermore, the fund saw its busiest day in over a year, with over 19 million GBTC shares changing hands. This volume jump marked the fund’s highest in over two years.

These figures aren’t surprising, considering that Grayscale’s victory presents a bullish outlook for the fund. Furthermore, Grayscale’s GBTC is one step closer to being converted into a Spot Bitcoin ETF, so many investors may want to get in on the fund at a discounted price.

GBTC currently operates as a closed-end fund and has seen a discount as high as 48.89% of its net asset value (NAV) in December 2022. This discount has been reduced to about 18% following the court’s ruling in favor of Grayscale. However, some still believe this gap could close further, especially if Grayscale’s ETF application were approved.

Grayscale Bitcoin Trust (GBTC) share price chart from Tradingview.com

Big Win For The Crypto Community

Grayscale had filed a lawsuit following the SEC’s refusal to grant its application to convert its GBTC fund into a Spot Bitcoin ETF. 

Grayscale argued that the SEC acted arbitrarily and capriciously by not giving it the same regulatory treatment the Commission did to the Teucrium Bitcoin Futures Fund and the Valkyrie XBTO Bitcoin Futures Fund.

The fund stated that it deserved the same treatment as the Bitcoin futures fund because the prices of both Spot and Futures Bitcoin ETFs were “99.9%” correlated, so they posed the same risk regarding fraud and manipulation. 

The court adopted Grayscale’s argument and agreed that the SEC had not provided sufficient reason for denying Grayscale’s application while approving the Bitcoin futures funds.

With this ruling, the SEC’s primary reason for not approving a Spot Bitcoin no longer carries weight, as the Commission can no longer deny applications solely because the Spot Bitcoin market has no regulated market of significant size. 

The court already found both funds (spot and futures) to be similar, so these exchanges’ surveillance sharing agreements with the Chicago Mercantile Exchange (CME) should be sufficient to deter manipulation in either the spot or futures market. 

While it remains to be seen what step the SEC will take regarding the Court of Appeal’s ruling, there is an increased likelihood that the Commission will have to approve the pending Spot Bitcoin ETF applications except if it can find another reason to deny these proposals.