The buzzy blockchain project’s SEI token saw a flurry of trading as it debuted on several crypto exchanges Wednesday, but there was much confusion over the status of a promised token “airdrop” to early adopters of the network.
Vitalik Buterin calls X’s Community Notes an example of ‘crypto values’

The Ethereum co-founder said the algorithm behind X’s tool to rate content as helpful and provide context was “surprisingly close to satisfying the ideal of credible neutrality.”
Executives Of Crypto-Friendly Bank Silvergate Step Down As Lawsuits, Liquidation Rages On
In a recent turn of events, multiple executives of the embattled California-based cryptocurrency bank Silvergate Capital have announced that they will be stepping away from their roles at the bank.
The announcement comes as the bank remains deep in the throes of liquidation while battling multiple lawsuits linked to its demise.
Top Executives Set to Step Down
Silvergate Capital Corp announced on Tuesday, August 16, the departure of some of its primary employees working in executive leadership positions in its company. The executives leaving include Chief Financial Officer, Antonia Martino, Chief Legal Officer, John Bonino, and CEO, Alan Lane.
Lane and the company’s Chief Legal Officer will be departing on Tuesday, August 16, and according to a financial filing delivered to the United States Securities and Exchange Commission (SEC), Silvergate’s Chief Legal Officer is set to step down on September 30.
The executives’ decision to depart from Silvergate follows the bank’s announcement in March to shut down operations and liquidate its assets. Lane has served as the CEO of Silver Capital Corp and Silvergate Bank since 2008 and played a pivotal role in Silvergate’s development and growth.
In the absence of a CEO, Silvergate has replaced Lane with Silvergate’s Chief Transition Officer, Kathleen M. Fraher. It has also made Andrew Surry, Silvergate’s Accounting Officer, the principal financial offer in the absence of Martino.
Silvergate stated in the filing to the SEC that it will provide each executive severance benefits previously offered to employees laid off through the bank’s liquidation process.
Earlier this year in January, Silvergate laid off over 180 employees, cutting its workforce by 40%. Again, in May, the bank laid off over 250 workers, leaving a group of about 80 to oversee its liquidation and termination process.
The San-Diego-based bank said in a report that it plans to significantly reduce the number of employees in its company and manage its operations using a skeleton crew.
Silvergate Enveloped in Lawsuits and Liquidations
In November 2022, Silvergate collapsed following the FTX failure and embroilment in fraud. Silvergate, which served as one of the two major banks for cryptocurrency companies in the industry, decided to officially shut down all operations and start a liquidation process.
As a result, stocks plunged by 36% and the bank suffered massive customer withdrawals. Toward the end of Q3, Silvergate’s total deposits from crypto customers plummeted by 68%, declining to $3.8 billion from an astonishing $11.9 billion.
According to reports, FTX was one of Silvergate’s major customers and it was revealed that Silvergate held about $1 billion in deposits from FTX at the time of its failure. Silvergate’s affiliation with FTX has caused severe financial damage to the bank’s reputation and put it on the radar of the regulatory authorities in the United States.
Silvergate was also mentioned in multiple lawsuits due to its association with the bankrupt FTX and allegations of participation in FTX’s fraudulent activities.
Breaking: Valkyrie files for Ether futures ETF with the SEC

Asset management firm Valkyrie has filed for an Ether futures ETF with the U.S. Securities and Exchange Commission on August 16.
PayPal to Stop Crypto Purchases in UK Until 2024
Payments giant PayPal will temporarily pause crypto purchases in the United Kingdom until early 2024, the company said Wednesday, citing new rules by the country’s financial regulator.
The End of the End of Crypto
Bitcoin & Top Assets See High Loss Taking, Is This Bullish?
On-chain data shows Bitcoin and the other top assets are observing a high amount of loss-taking currently. Here’s what this could mean.
Investors Of Bitcoin & Other Top Coins Are Capitulating Currently
According to data from the on-chain analytics firm Santiment, the current trader capitulation that the largest assets in the market are seeing may be a bottom signal.
The indicator of interest here is the “ratio of daily on-chain transaction volume in profit to loss,” which, as its name already implies, tells us how the profit-taking volume for any given coin compares with its loss-taking volume right now.
When this metric has a positive value, it means that the profit-taking volume is higher than the loss-taking volume currently. Thus, such a trend implies that the market as a whole is harvesting profits at the moment.
On the other hand, the indicator having negative values suggests loss taking is the dominant behavior among the traders of the cryptocurrency in question right now.
In the context of the current discussion, the assets of relevance are Bitcoin (BTC), Ethereum (ETH), XRP (XRP), Litecoin (LTC), and Cardano (ADA).
Here is a chart that shows the trend in the ratio of transaction volume in profit to loss for these assets over the last few months:
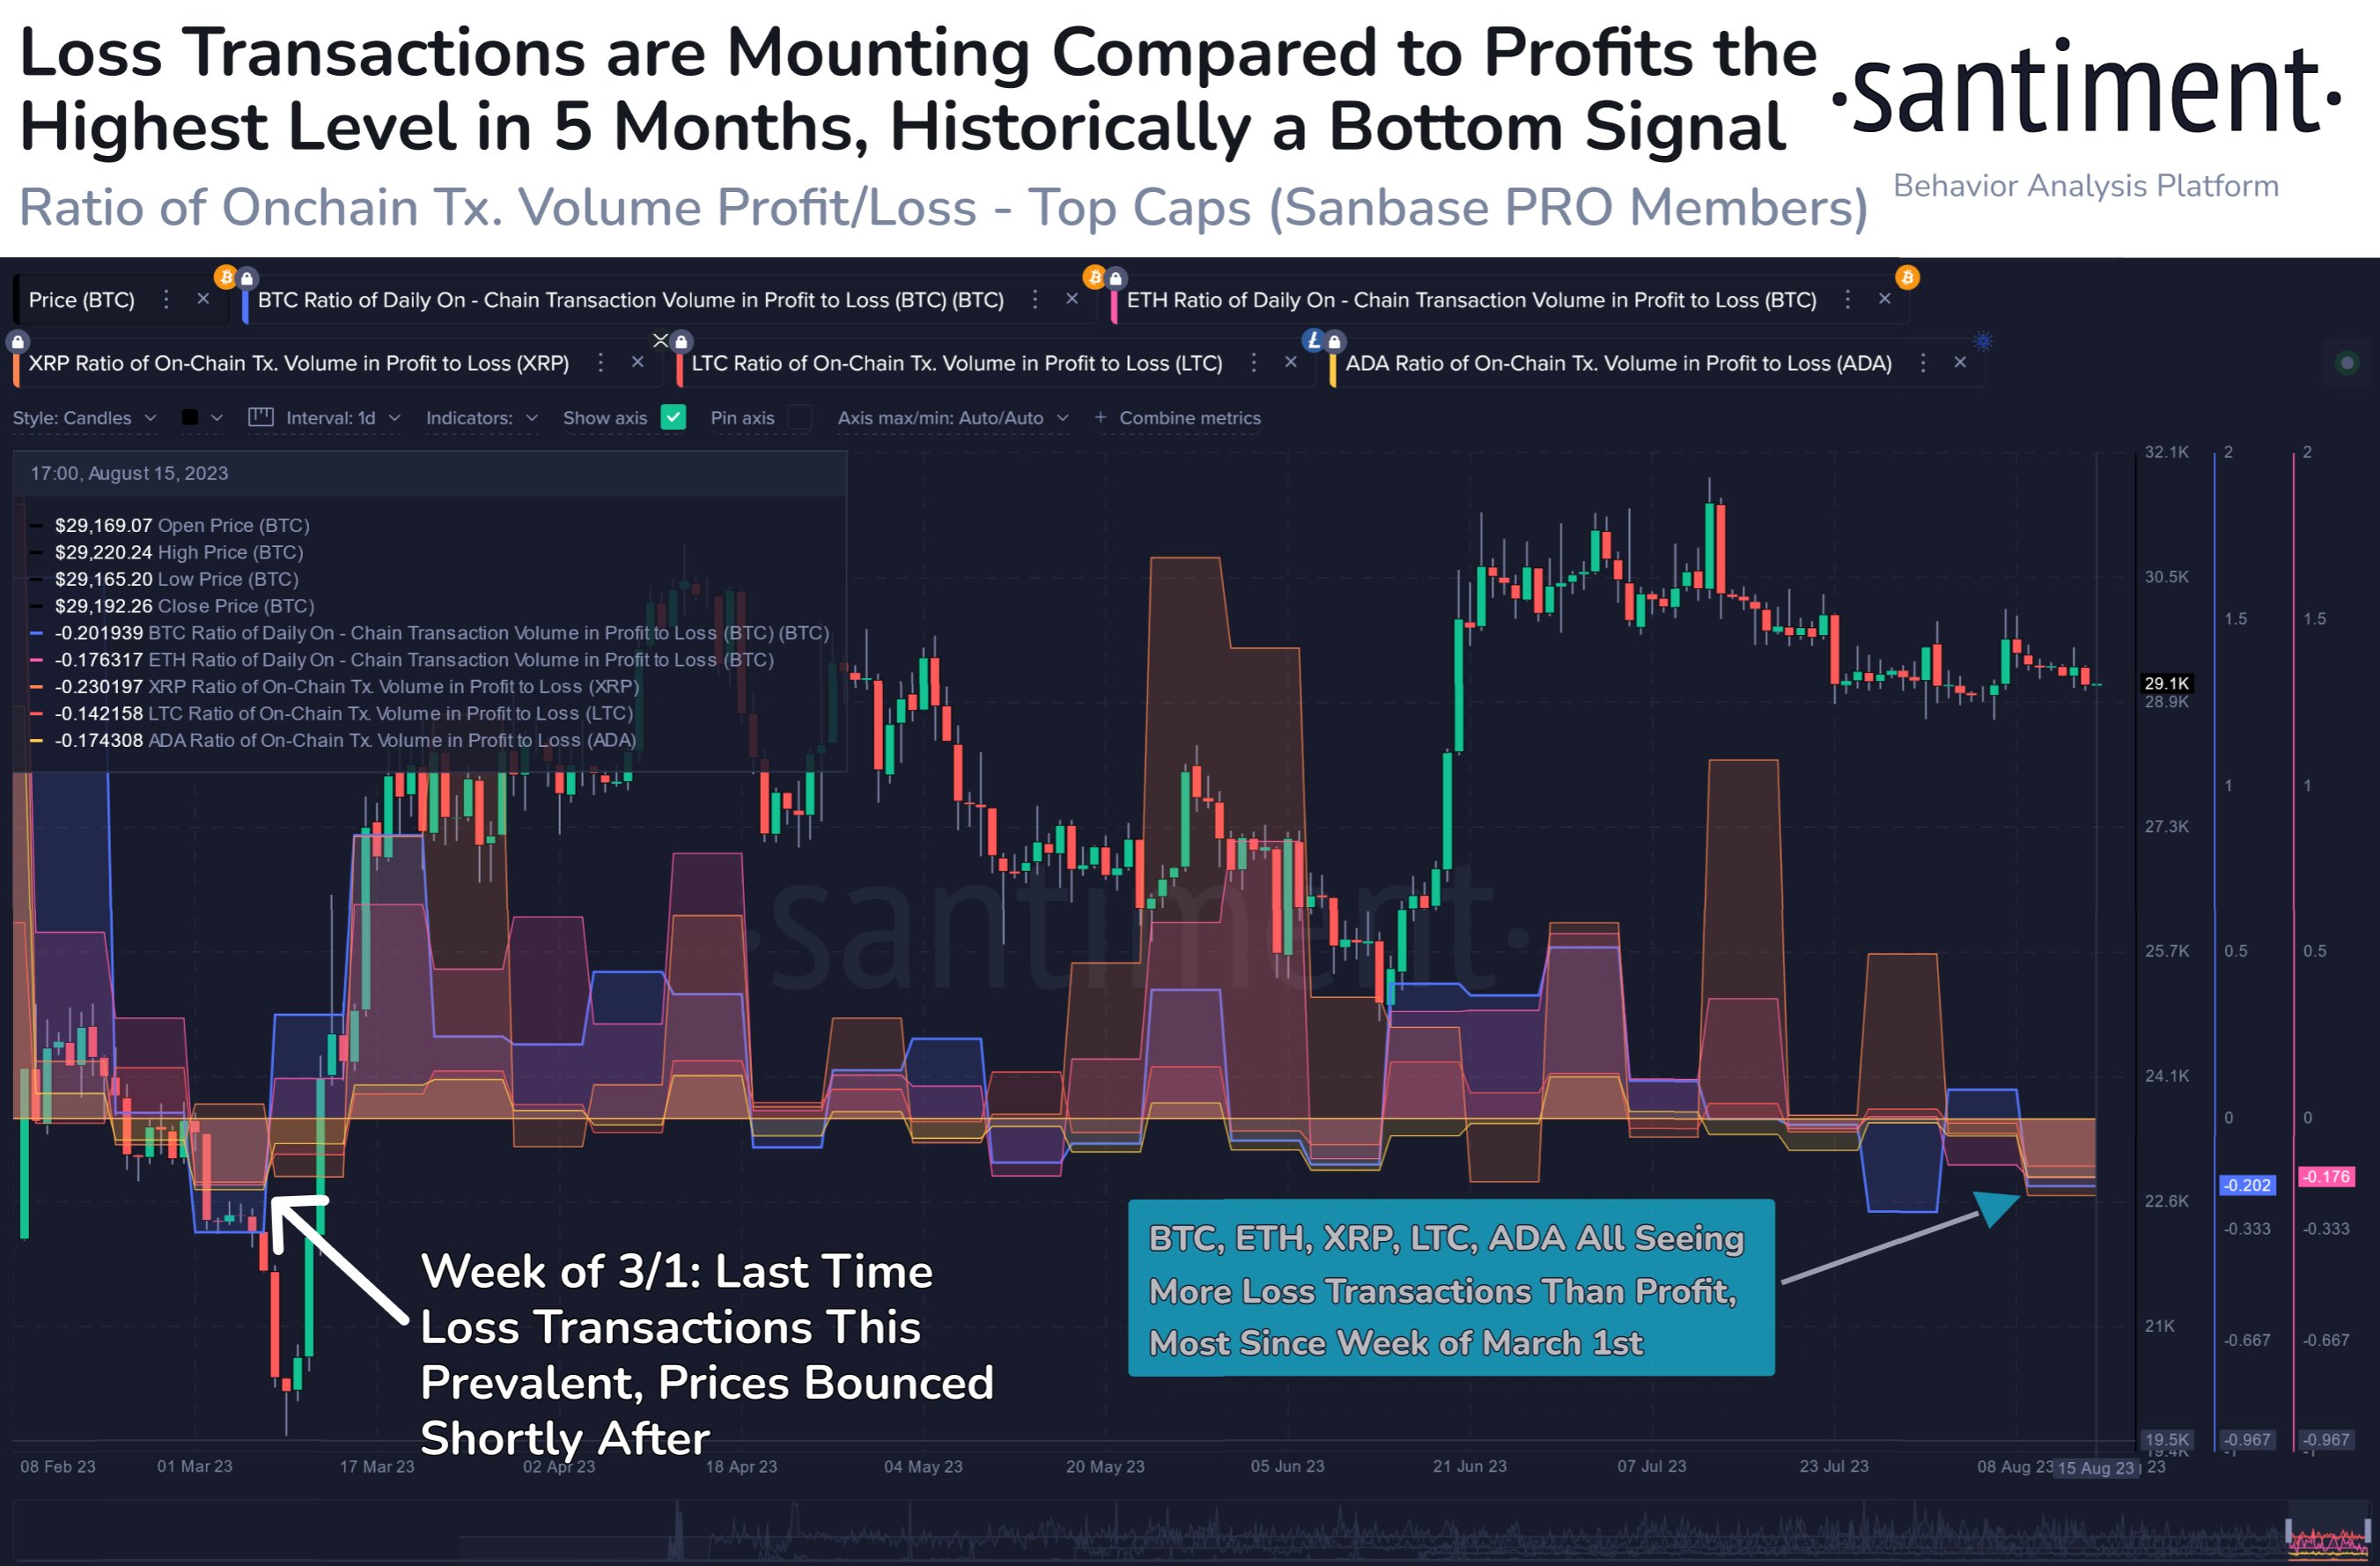
As displayed in the above graph, the indicator’s value for all these top assets has dipped inside the negative territory recently. This high loss realization from the investors has come as the market as a whole has been unable to amass together any significant rally.
From the chart, it’s visible that these assets have seen the investors capitulate at different points throughout the year, but the current capitulation event has an interesting feature that was missing from these previous instances: the loss-taking is currently happening for all these large cryptocurrencies.
It would appear that traders as a whole have finally started to give up on the market after experiencing endless consolidation, as they are ready to take losses in order to make their exit.
The scale of the loss-taking itself is also extraordinary, as the only other time this year that the loss volume overtook the profit volume to this degree was way back in March.
Historically, capitulation from investors has made bottoms more probable to form. And from the above chart, it’s visible that the March capitulation also leads to Bitcoin hitting a bottom.
The likely reason behind this pattern is that the investors who exit in losses are generally the weak hands, who had a low conviction in the asset, to begin with. In capitulation events, the coins that they sell at losses are picked up by the more resolute investors, and hence, the market gains a stronger foundation for building up rallies.
It’s possible that the high loss taking that Bitcoin and the others are experiencing currently may also lead to a bottom, if the historical precedence is anything to consider.
BTC Price
At the time of writing, Bitcoin is trading around $29,100, down 2% in the last week.
Bitcoin Slips to $29K, but Fundstrat’s Tom Lee Sees $150K on ETF Approval
Altcoins are leading declines, with majors like DOGE, SOL and MATIC shedding 6-7% in the past 24 hours.
In Canada, Spot Bitcoin ETFs Have Been Working for Years
Gorast Tasevski and Haan Palcu-Chang of Purpose Investments share thoughts about bitcoin ETFs – and Canada.
Why Crypto Investors Should Care About Tokenomics: Crypto Long & Short
Perceptions of token issuance by projects have changed dramatically during the crypto winter.
Is An XRP Spot ETF Coming To The US Soon? Bloomberg Analyst Answers
Ripple has continued to revel in the glow of Judge Analisa Torres’ ruling in favor of the crypto company, with many use cases being touted for its native token XRP. The most recent use case to surface is a Spot XRP ETF, and Bloomberg analyst James Seyffart has quickly weighed in on the possibility of this happening.
How Possible Is A Spot XRP ETF?
Seyffart, during an appearance on Tony Edward’s Thinking Crypto Podcast, explained that XRP would need to be listed on the Chicago Mercantile Exchange (CME) before the SEC can approve a Spot XRP ETF.
This argument stems from the SEC’s requirement for a regulated market of significant size in the underlying asset. Relatively, exchanges looking to list a Spot Bitcoin ETF are, in hopes of gaining approval, relying on the fact that the CME Bitcoin futures, which happen to be a regulated market, provide significant size to provide necessary data and insights for any spot market.
So Seyffart also believes that any Spot XRP ETF application will also need to fulfill the requirement of the token having a significant market size that can be used to provide any data and insights needed to prevent fraud and market manipulation. To achieve this and easily get the SEC’s approval, listing XRP futures on a prominent derivative exchange like CME would be the way to go, in his opinion.
Despite his remarks, Seyffart isn’t so optimistic about a Spot XRP ETF launching anytime as, according to him, this isn’t something he sees “materializing in the foreseeable future.”
Little Or No Demand Is A Hindrance
Another notable highlight from Seyffart’s remarks was when he suggested that there was little or no demand for an XRP ETF, something which he believes is integral if we are to see any ETF application.
However, there is reason to believe this assumption may not be outrightly correct, as certain figures suggest an increasing demand for XRP, notably among institutional investors.
Last month, a report stated how XRP’s sales had jumped significantly this year, with over 2.22 billion XRP sold since the beginning of the year. Furthermore, according to a more recent report, the token recorded an institutional inflow of $0.5 million two weeks ago.
Ripple’s XRP Ledger is also going head to head with the foremost Bitcoin and Ethereum networks, as it has recorded an increase in daily transactions since the beginning of August. This record has seen it surpass market leader Ethereum in terms of daily transactions conducted on both networks.
The Machine Economy and the Convergence of Web3, AI and Fintech
Fintech, Web3, and artificial intelligence are one economic whole, and our ability to grow each relies on their deep synthesis, says Lex Sokolin, founder of Web3 investment fund Generative Ventures.
Satoshi-era Bitcoin awakens – 1005 BTC mined in 2010 on the move

1,005 BTC valued at $29 million have been moved from an old Bitcoin wallet after 13 years, drawing parallels to recent dormant BTC movements.
Bitcoin Speculators Retreat As Long-Term Holders Double Down Since $69,000 Peak
The Bitcoin market continues to reveal trends and patterns, vital for both long-term holders and short-term speculators. Notably, since Bitcoin reached its all-time high of $69,000, speculators, who play a pivotal role in the market, now hold less of the cryptocurrency.
This insight comes from prominent analytics firm Glassnode in its “The Week On-Chain” newsletter, which delves into the market’s dynamics and potential implications.
Bitcoin Stagnation And Role Of Short-Term Holders
The Bitcoin market has witnessed a prolonged period marked by relatively steady BTC price action. This phase has sown seeds of discontent among market participants, prompting speculation about potential downside risks.
Related Reading: Bernstein Predicts Spot ETFs Could Claim 10% Of Bitcoin’s Market If Greenlit
So far, the asset only hovers between $29,000 and $25,000 price points creating a tug-of-war between the bulls and bears in that price zones.
A noteworthy shift in the Bitcoin market is the dwindling enthusiasm of its short-term traders, commonly referred to as speculators. This group, typically driven by the prospects of swift gains, seems to be re-evaluating its stance, perhaps deterred by the recent lack of significant price movement.
Glassnode points out that the market share of these short-term holders has ebbed to a mere 2.56 million BTC. This stands in stark contrast to their presence in October 2021, right before Bitcoin soared to its record high.
Yet, while these speculators recede, long-term holders, often viewed as the bedrock of the Bitcoin community, are seemingly undeterred. Their stronghold over the currency is tightening, with a current hold of 14.6M BTC, the highest ever recorded.
The report noted:
Overall, this suggests that conviction of Bitcoin investors does remain impressively high, and very few are willing to liquidate their holdings.

A Market Teetering On Decisions
The distinction in purchase prices between the two investor classes has been highlighted as a potential concern. According to the newsletter, Short-term speculators, having bought at a higher average price of $28,600, might be more susceptible to incurring losses with even a modest dip in Bitcoin’s price.
On the other hand, long-term investors, with an aggregate purchase price substantially lower at around $20,300, seem more cushioned against market volatility.

This variance in purchasing prices, combined with the contrasting reactions of the two investor groups, paints a picture of a market in flux, divided between those who believe in Bitcoin’s long-term value and those swayed by its immediate price trajectories.
Glassnode believes that “The separation between these two cost basis is an indicator that many recent buyers have a relatively elevated acquisition price.”
Despite the current market uncertainty, an underlying sentiment that remains clear is the confidence of Bitcoin’s stalwarts. Their increasing hold suggests a steadfast belief in Bitcoin’s potential, even as speculators seem to waver amid its current price downturn.
Featured image from Unsplash, Chart from TradingView
Banning ransomware payments: An attractive but dangerous idea

The U.S. and Australia are considering banning ransomware payments, but will it solve the problem, or harm people and destroy businesses?
First Mover Americas: Coinbase Secures NFA Approval to Offer Crypto Futures
The latest price moves in bitcoin (BTC) and crypto markets in context for August 16, 2023. First Mover is CoinDesk’s daily newsletter that contextualizes the latest actions in the crypto markets.
ZetaChain raises $27M in equity round to enable chain-agnostic interoperability

Participants in the round include Blockchain.com, Sky9 Capital, Jane Street Capital, VistaLabs, Human Capital, VY Capital, CMT Digital, among other investors.
3AC founders fined by Dubai regulator over OPNX exchange

OPNX CEO Leslie Lamb and executives Kyle Davies, Su Zhu and Mark Lamb were all issued a $58,000 fine for violating marketing regulations in the emirate.
BitGo raises $100M after losing lawsuit against Galaxy

BitGo’s Series C funding featured entirely new investors based in the United States and Asia, CEO Mike Belshe said.
From the U.S. to Japan, regulators are beginning to embrace crypto

Switzerland, Singapore and the EU have taken the early regulatory lead, but Japan and the UAE are coming on now. Even the U.S. may be awakening.


