Bitcoin Price Back To Square One, Why This Could Be A Bearish Signal

Bitcoin price trimmed all gains and tested the $25,650 zone. BTC is now at risk of a fresh decline toward the $24,500 level in the near term.

  • Bitcoin started a fresh decline below the $26,500 and $26,200 levels.
  • The price is trading below $26,600 and the 100 hourly Simple moving average.
  • There is a key bearish trend line forming with resistance near $26,750 on the hourly chart of the BTC/USD pair (data feed from Kraken).
  • The pair could extend its decline toward $24,500 in the coming sessions.

Bitcoin Price Starts Fresh Decline

Bitcoin price failed to climb again above the $27,000 resistance zone. BTC started a fresh decline and gained bearish momentum below the $26,500 level.

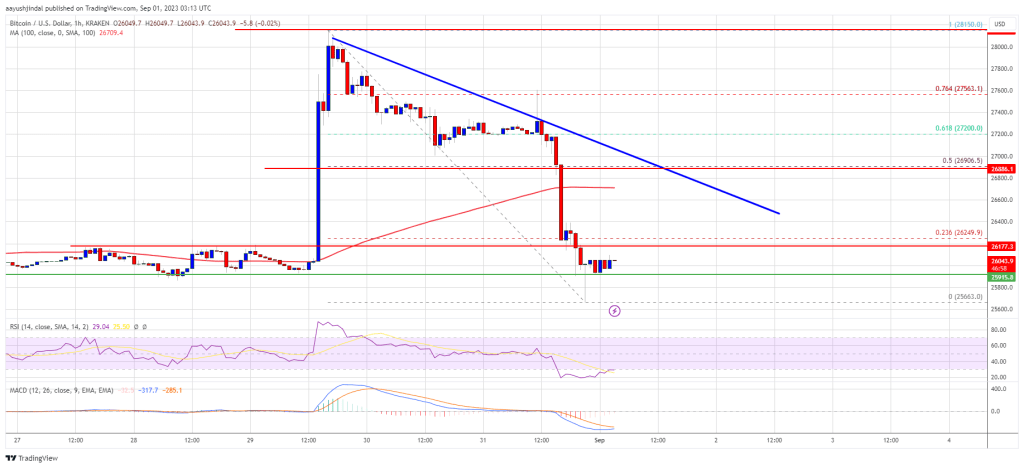
There was a clear move below the $26,200 level. The price even spiked below the $26,000 level. A low is formed near $25,663 and the price is now consolidating losses. Bitcoin is now trading below $26,600 and the 100 hourly Simple moving average.

Besides, there is a key bearish trend line forming with resistance near $26,750 on the hourly chart of the BTC/USD pair. Immediate resistance on the upside is near the $26,250 level. It is close to the 23.6% Fib retracement level of the recent decline from the $28,150 swing high to the $25,663 low.

The first major resistance is near the $26,650 level or the trend line region. The trend line is also close to the 50% Fib retracement level of the recent decline from the $28,150 swing high to the $25,663 low. The main resistance is now forming near the $27,000 level.
Bitcoin Price

Source: BTCUSD on TradingView.com

A clear move above the $27,000 level might send the price toward $27,400. The next major resistance is near $28,000, above which there could be a sustained increase. In the stated case, the price could test the $29,200 level.

More Losses In BTC?

If Bitcoin fails to clear the $26,750 resistance, it could continue to move down. Immediate support on the downside is near the $25,800 level.

The next major support is near the $25,650 level. A downside break below the $25,650 level might put a lot of pressure on the bulls. In the stated case, the price could drop toward $24,500.

Technical indicators:

Hourly MACD – The MACD is now losing pace in the bearish zone.

Hourly RSI (Relative Strength Index) – The RSI for BTC/USD is now below the 50 level.

Major Support Levels – $25,800, followed by $25,650.

Major Resistance Levels – $26,250, $26,750, and $27,000.

Base TVL Surges By 76% Amidst New DeFi Protocol Hype

Base, an Ethereum layer 2 (L2) network developed by prominent cryptocurrency exchange Coinbase, has seen its total value locked (TVL) soar to new heights on Friday, August 31. This surge was triggered by the recent launch and growing hype around the decentralized exchange (DEX) platform Aerodrome.

Total Value Locked on Base Reach $333 Million

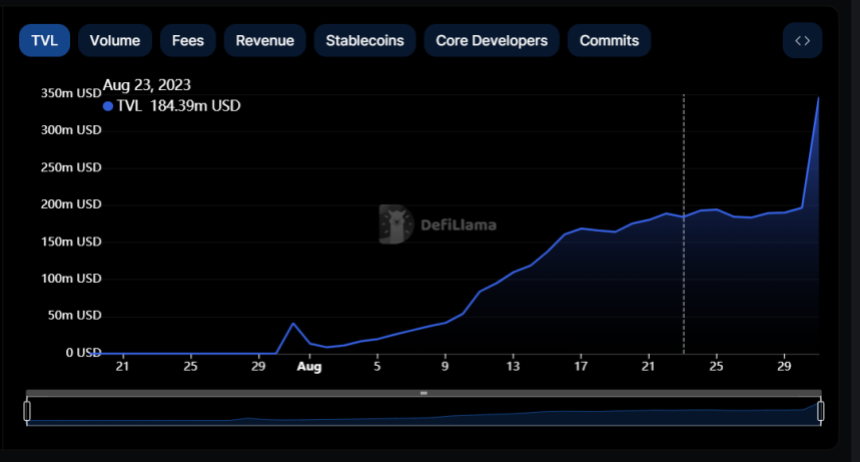
The total decentralized finance (DeFi) deposits on Base have hit a new all-time high following a nearly 76% spurt in the past 24 hours. According to data from DefiLlama, the network’s TVL currently stands at $346.39 million, jumping from $196.8 million a day ago.

Base

This sharp rise has seen Base leap into the top ten blockchains with the largest TVL, sitting above Solana in ninth position. However, Ethereum remains the dominant network in the decentralized finance space, with a total value of roughly $22.1 billion.

Interestingly, this latest feat only underscores the overall progress of Base since opening its doors to the public on August 9, 2023. The Coinbase-incubated network’s TVL has swelled more than 733% since the public mainnet launch. 

One of the notable catalysts of the Base’s growth was the short-lived hype of the social media platform Friend.tech. However, activity on the decentralized app has since hit a snag, with trading fees dipping by more than 94%. 

Aerodrome Drives An Inflow Of $170 Million To Base

As earlier mentioned, the latest resurgence in Base’s DeFi deposits was triggered by the growing interest in the Aerodrome protocol, which recently launched on the blockchain.

Aerodrome is a decentralized exchange developed by the team behind Velodrome, a popular DEX on the Optimism chain. The platform rewards users who provide liquidity and participate in protocol governance with its native token, AERO.

Thanks to the AERO emissions, which began on August 30, Aerodrome has attracted more than $170 million in value to the Base network. Meanwhile, this has reflected a significant 6,000% rise in the protocol’s TVL in the past 24 hours. 

Despite the initial negative sentiment brewing around Base due to the BALD rug pull, and various DeFi protocol exploits, it appears that major cryptocurrency projects are continuing to expand to the layer 2 network. 

PancakeSwap, the second-largest decentralized exchange, is one of the protocols to have recently joined the trend. The DeFi platform went live on the Base network on Thursday, 30th of August.

Base

Bitcoin Cash Traders Move Into Profit, But Can The Rally Continue?

As the price of Bitcoin and the general crypto market has rallied, leading to a much-needed increase in price, Bitcoin Cash (BCH) investors are once again on a profitable path. The majority of investors are now in the green following its double-digit surge in the last week. But now the question posed is, will the price of BCH continue to maintain this surge?

Bitcoin Cash Short And Long-Term Holders Enjoy Profits

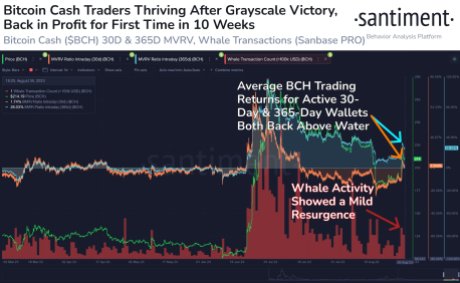
In a Thursday post, on-chain data tracking platform Santiment revealed that both short and long-term holders of Bitcoin Cash are doing quite well right now. The chart shared by the tracker showed that the average returns for 30-day and 365-day holders have risen above their average cost price.

This means that investors who got into the digital asset in the last month, as well as those who have been holding for a year, are the ones doing well right now. It is also the first time in 10 weeks that this cohort of BCH investors is seeing profit.

Santiment BCH

The data from Santiment is also backed up by that from another on-chain tracker IntoTheBlock. According to the latter’s data on its website, 59% of all BCH investors are seeing green compared to 38% sitting in the red and 3% in neutral territory. Furthermore, IntoTheBlock shows that 96% of holders have held for more than one year, with 3% holding between 1-12 months, and 1% holding for less than one month.

Combining the data from both trackers tells us that there are more long-term investors in profit compared to short-term investors. This fact reinforces the long-standing belief that buying and holding is usually the best way to invest in cryptocurrencies.

But Can BCH Hold Its Gains?

The fact that so many short and long-term holders are currently in profit can be attributed to the digital asset’s spike in the last week. Following the Grayscale ruling that saw the market surge, BCH’s price rose over 14%, bringing its value to the $220 level before the retracement. Most of these gains have been sustained so far, as evidenced by the high percentage of holders in profit.

However, Santiment points out in its report that for Bitcoin Cash to continue to rise, it would be up to the whales. This is because, during the price spike, there was an increase in whale activity in relation to the BCH token. So they likely played a part in the asset’s rise.

If the whales continue to be active and put buying pressure on the coin, then the price of BCH could continue to appreciate. However, a turn from buy to sell among these large holders would quickly crash the price, especially since the market is already feeling the euphoria felt earlier this week start to recede.

Presently, data from Coinmarketcap shows that Bitcoin Cash is trading at $219, a 14.57% increase in the last week.

Bitcoin Cash price chart from Tradingview.com

Bitcoin Unveiled Trail: Q4 Tumble, ETF Battles, Mt. Gox Drama, And Economic Shivers Await

In a recent legal win for Grayscale against the US Securities and Exchange Commission (SEC), Bitcoin (BTC) soared to $27,000. However, the bullish sentiment seems to have waned as the cryptocurrency has retraced to $26,000. 

QCP Capital, a cryptocurrency analysis firm, has provided valuable insights into the implications of this ruling and the overall market outlook.

BTC’s Short-Term Challenges Persist

According to QCP, while the ruling is a positive outcome for the industry, the firm notes that its near-term impact on spot prices is “inconsequential.” 

The firm cautions against getting caught up in the short-term “knee-jerk pump” in spot prices and volatility, suggesting it may present an opportunity to fade such fluctuations.

It is important to note that the ruling does not equate to approval of Grayscale’s application nor guarantees approval for the refilling of GBTC. The SEC still holds the authority to reject the refilling on new grounds. 

However, QCP Capital believes that the ruling solidifies the likelihood of an eventual approval for a Bitcoin spot exchange-traded Fund (ETF) while increasing the probability that the SEC will defer the decision to the March 2023 final deadline.

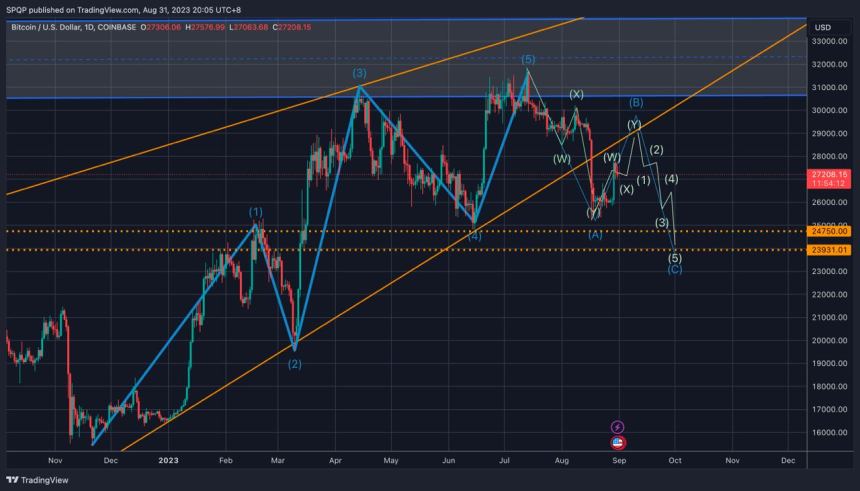
What’s concerning, is that QCP Capital’s wave count analysis, previously shared in their update two weeks ago, suggests that a final push higher to conclude the B wave correction is probable in the coming weeks. 

Bitcoin

This, coupled with positive developments in the Artificial Intelligence (AI) sector led by companies like NVIDIA and recent strength in traditional proxies such as Gold and Rates, creates a more favorable environment for cryptocurrencies.

Despite these positive factors, QCP Capital anticipates a potential Q4 2023 start near the market lows. They attribute this to fading optimism surrounding the spot ETF due to SEC delays and a perceived lack of innovation within the cryptocurrency sector compared to other technology sectors. 

Additionally, the upcoming Mt. Gox payout is expected to exert short-term bearish pressure on the market.

However, QCP Capital remains optimistic about a significant rally in Q1 of 2024. They anticipate the likely approval of the ETF in March, coinciding with the upcoming Bitcoin halving in April, and a potential US economic slowdown in Q2. 

To capitalize on this outlook, the firm suggests considering a topside end March 2024 option structure, which offers limited loss and the potential for a substantial payout if the bullish scenario unfolds.

Bitcoin Faces Downside Pressure

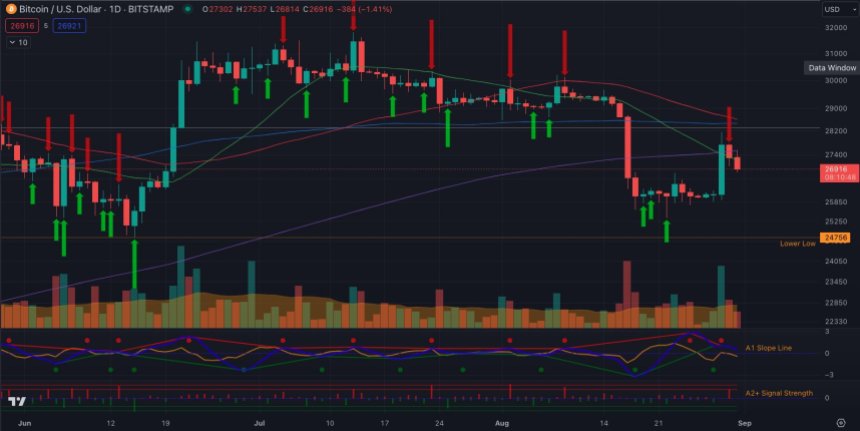
According to Material Indicators, a prominent analysis firm’s algorithmic models, called Trend Precognition, indicate a downside trend on multiple timeframes for Bitcoin (BTC). 

Bitcoin

The Daily chart, which closes in less than 9 hours, the Weekly chart, which closes in 3 days, and the Monthly chart, which closes in less than 9 hours, all point towards a potential test of support shortly.

Per the firm’s analysis, the Weekly signal would be invalidated if BTC’s price moves and holds below the $25,350 level. However, if support holds above the lower low (LL) at $24,750, it would provide a solid foundation for a potential rally and a retest of resistance.

Bitcoin

Overall, both QCP Capital and Material Indicators concur that the analysis points towards continuing Bitcoin’s current downtrend in the short term. 

Presently, Bitcoin is trading at $26,100, reflecting a 3% decline over the past 24 hours. The upcoming days will reveal whether these projected scenarios materialize or if the cryptocurrency manages to consolidate at its current level, resulting in sideways price action.

Featured image from iStock, chart from TradingView.com

Bitcoin Rollercoaster: Analyst Forecasts $8,000 Dip Before Skyrocketing To $200,000

In his recent interview, Mike McGlone, Bloomberg Intelligence’s Senior Commodity Strategist, predicted Bitcoin’s potential fall amid the ongoing market downturn. However, it wasn’t all gloom from the seasoned analyst, as he also touched upon the longer-term prospects of the flagship cryptocurrency.

Will Bitcoin Touch $8,000?

It is worth noting that Bitcoin has undergone a fair share of price fluctuations since its inception. In the interview, McGlone compared Bitcoin’s volatile nature to the days of the stock market. His predictions, grounded in his analytical observations, also prompted apprehension and agreement.

Mike McGlone’s interview was rife with insights into the cryptocurrency market, but one statement stood out: his belief that Bitcoin could plunge to a low of $8,000 in the current bear market.

McGlone emphasized that despite the potential for such a drastic drop. Bitcoin remains the world’s top-performing asset.  McGlone stated that Bitcoin hasn’t exhibited deflationary characteristics like Treasury bills and gold.

Instead, he pointed out that macroeconomic elements, particularly the Federal Reserve’s ongoing tightening policies, continue to have a pronounced effect on Bitcoin’s price.

Institutional Influence: Not the Immediate Boost Many Anticipate?

Another popular belief within the crypto community is that spot ETF approvals, and an influx of institutional investors would catapult Bitcoin’s price to new heights.

McGlone, however, expressed skepticism regarding this sentiment. In his view, while a spot ETF approval may sway market sentiment, it might not substantially impact Bitcoin’s price trajectory. McGlone suggested that the earliest spot ETF might not see daylight until next year.

On which spot ETF could potentially make the first move, McGlone’s bet is on BlackRock. Citing the institution’s commanding presence in the market and its reputation as the world’s leading asset manager, he believes BlackRock might lead the pack in the spot ETF space.

McGlone maintained confidence in Bitcoin’s long-term bullish prospects despite these short-term projections. He reaffirmed his vision of the crypto giant eventually reaching a value of $200,000.

Meanwhile, following the announcement of Grayscale’s legal victory against the US Securities Exchange and Commission (SEC), Bitcoin has retraced noticeably from its Tuesday peak of $27,974, dropping to $26,885 at the time of writing.

Bitcoin’s (BTC) price chart on TradingView

Bitcoin’s daily trading volume has also dipped along with its price, dropping from last Thursday’s peak of $12 billion to $10 billion in the past 24 hours. Notably, Bitcoin’s market cap currently sits at $523 billion when writing.

Featured image from Unsplash, Chart from TradingView

Ethereum Traders Capitulate As Rally Slows Down: Why This Is Good

On-chain data shows that Ethereum traders are capitulating following the slowdown of the rally, something that may turn out to be positive.

Ethereum Traders Are Selling At A Loss Right Now

According to data from the on-chain analytics firm Santiment, ETH investors are getting increasingly frustrated as they are now participating in significant loss-taking.

The relevant indicator here is the “ratio of daily on-chain transaction volume in profit to loss,” which, as its name already implies, compares the profit-taking volume to the loss-taking volume for any given cryptocurrency.

This metric works by going through the on-chain history of each coin being sold/transferred to see the price at which it was previously moved. If this last selling price for any coin was less than the current spot price, then that particular token is now being sold at a profit.

Naturally, the sale of this coin would count under the profit-taking volume. Similarly, the opposite type of coins would contribute towards the loss-taking volume.

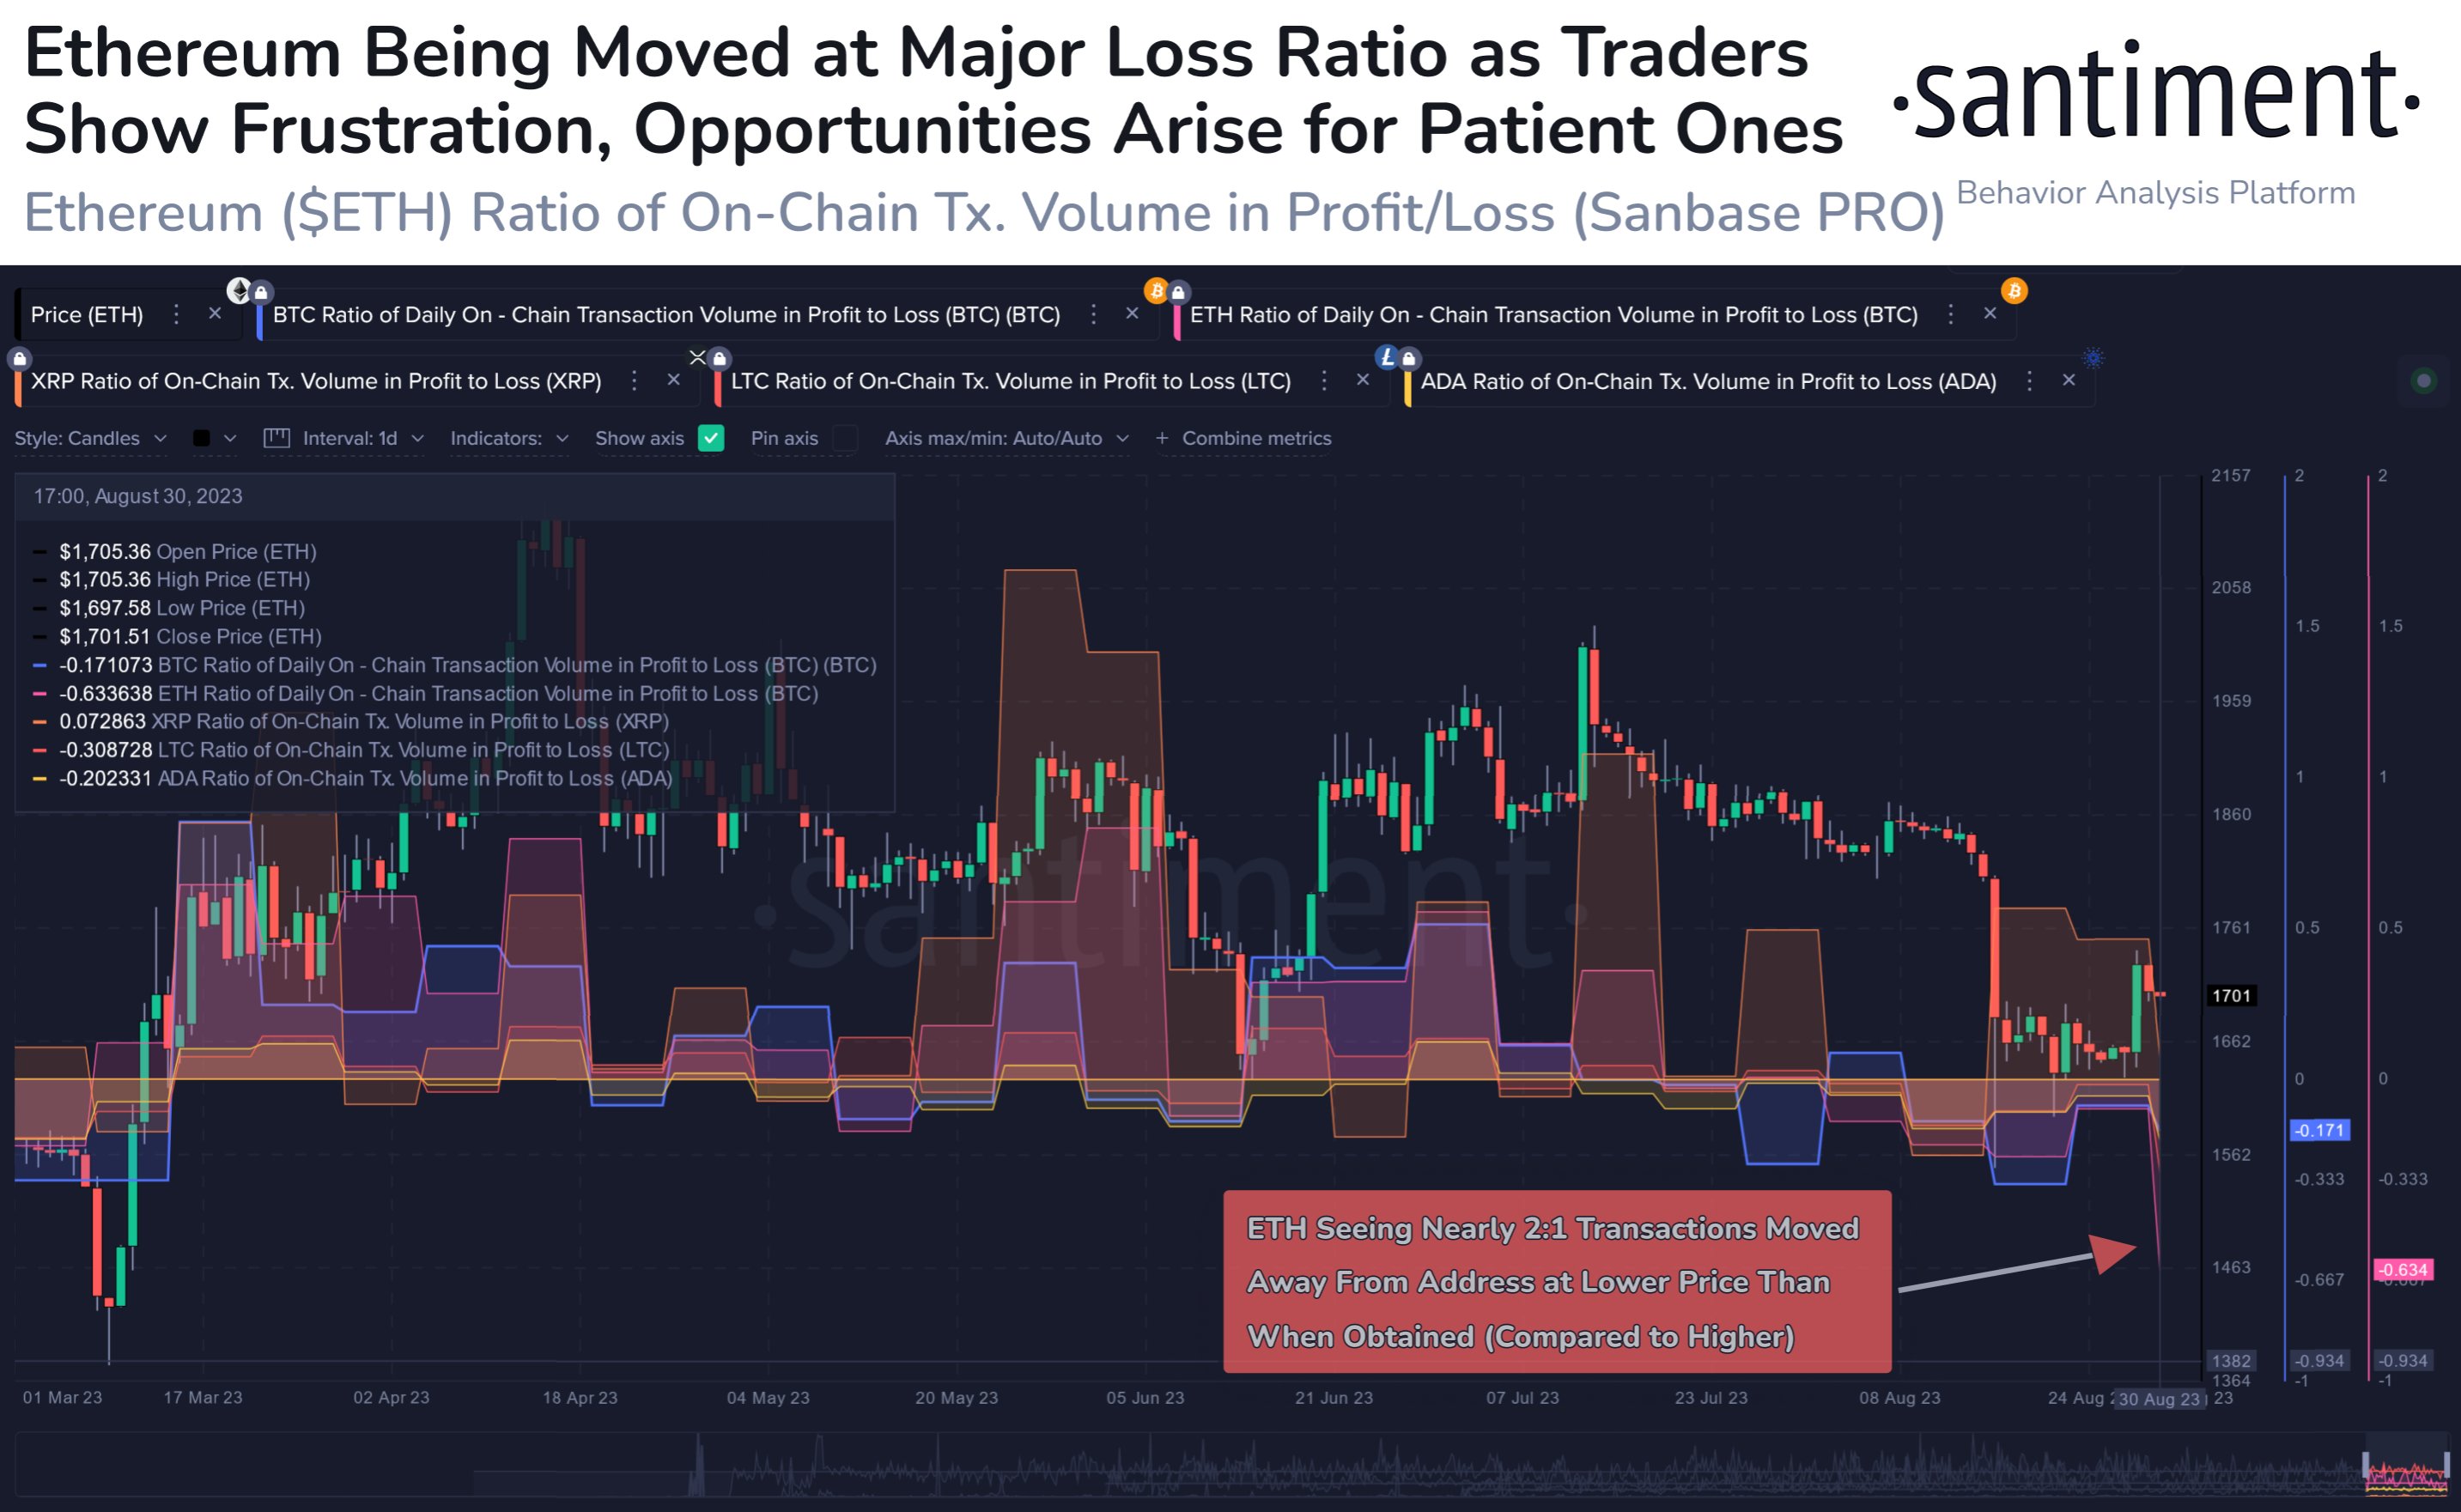
Now, here is a chart that shows the trend in this ratio for some of the top assets in the cryptocurrency sector over the past few months:

Ethereum Loss-Taking

When the value of this metric is positive, it means that the profit-taking volume outweighs the loss-taking volume right now. On the other hand, negative values suggest the dominance of loss-taking in the market.

From the chart, it’s visible that many of these top assets have seen negative values of the indicator recently as the rally that began following the Grayscale news has slowed down.

Ethereum, however, stands out among these coins as the indicator’s value for the asset is significantly more negative than the likes of Bitcoin and Cardano, who are observing loss-taking volumes that are only mildly more than the profit-taking ones.

At the metric’s current value, the Ethereum investors are making loss-taking transactions at a rate nearly double that of the profit-taking ones. This difference between ETH and the other top assets would suggest that the coin traders are showing the least amount of patience.

This could be because they don’t think the cryptocurrency would continue its rally anymore, or if it does, the profits wouldn’t be as large as for some of the other altcoins, so they may be exiting here at losses to go to greener pastures.

This high amount of loss-taking could, however, actually turn out to be beneficial for Ethereum. Historically, whenever investors have participated in capitulation, rebounds in the price have become more probable.

The likely explanation behind this pattern may be the fact that investors pick up the coins that these relatively weak hands sell with a stronger conviction, who provide a better foundation for a sustainable price surge.

It remains to be seen whether Ethereum can use this capitulation to bounce off towards higher levels or if the rally will remain muted for a while longer.

ETH Price

At the time of writing, Ethereum is trading around $1,700, up 3% in the last week.

Ethereum Price Chart

Maker (MKR) Unleashed: Price Soars 12% In One Day – What’s Behind The Surge?

In anticipation of the announcements made by the Ethereum-based Decentralized Finance (DeFi) lending platform team, the price of Maker (MKR) has experienced a remarkable surge of over 12% within hours. Now, what do these developments entail, and how will they impact the future of Maker?

Maker Empowers SubDAOs?

On August 28th, the Maker team made a significant announcement regarding their plans to introduce SubDAOs in South Korea. This move represents a critical evolution for MakerDAO, marking the “final effort” to unlock the potential of Decentralized Autonomous Organizations (DAOs). 

According to the announcements made on August 28th, introducing SubDAOs is expected to streamline, innovate, and strengthen the Maker ecosystem, paving the way for increased opportunity and growth.

SubDAOs, which stands for Subsidiary Decentralized Autonomous Organizations, are expected to play a pivotal role in the next phase of MakerDAO’s development. These entities will leverage liquidity allocation from the Maker Protocol, exploring various yield opportunities across the financial landscape. 

From decentralized finance protocols to real-world asset solutions, SubDAOs aim to harness the potential of diversified investment strategies.

Per the announcement, this presents a unique opportunity for Korean crypto leaders to engage with the forefront of DeFi developments. Participants will have the chance to be part of forming their own SubDAO or contribute to existing ones. 

This involvement offers insights into the success story of Spark Protocol, the first yield product incubated by a future SubDAO. Spark Protocol has demonstrated significant achievements, such as boasting high liquidity, industry-leading borrowing fees, and managing hundreds of millions in liquidity.

Additionally, the event encourages forging connections between leaders in centralized finance (CeFi) and decentralized finance. These connections are expected to help bridge the South Korean community to SubDAO token acquisition and farming opportunities, fostering collaboration and growth within the ecosystem.

The move into SubDAOs signifies MakerDAO’s commitment to cultivating innovation across the industry. Participants can explore “cutting-edge” decentralized finance protocols and real-world asset solutions. 

The MRK Rally, How Close To A New Annual High?

The recent announcements have sparked a surge in MKR’s price, following a decline that began on August 2nd, which coincided with the token reaching its yearly high of $1,371. 

Subsequently, MKR experienced a drop, reaching a low of $984 and breaching the significant psychological level of $1,000 and its 50-day Moving Average (MA), which had previously provided substantial support for the token.

However, with the recent announcements and the excitement surrounding the protocol’s new phase and increased liquidity entering its ecosystem, MKR has surged by an impressive 12% within 24 hours. 

Currently, MKR is trading at $1,170, surpassing and regaining its 50-day MA, which has played a pivotal role in driving Maker’s rallies throughout the year. Moreover, according to Token Terminal data, MakerDAO’s Total Value Locked has reached $5.16 billion, indicating a 3.03% uptrend in recent days.

Considering these developments, the question arises: Is MKR poised to reach a new yearly high? 

During MRK’s rally, the token reached as high as $1,230 but encountered a strong resistance wall at that level. However, suppose the protocol’s developments continue to attract liquidity, and MKR bulls can defend its 50-day MA as support, while further consolidating above the $1,260 level.

In that case, there is a possibility that, in the coming months, MRK could achieve a new yearly high above $1,375 and even touch the $1,400 level, a threshold not reached since May 2022.

Maker

Featured image from iStock, chart from TradingView.com