Solana Can Rally Over 20% If It Breaches This Level

Over the past few trading sessions, the Solana price has been lacking direction. It is currently showing a bearish trend. The daily chart indicates that SOL has lost almost 4% of its value. Over the past week, it has fallen by 5%, erasing most of its gains due to the recent decline in price.

Additionally, the technical outlook for Solana is bearish. Demand has been falling as buyers have stayed away. SOL also depicted negative accumulation at the time of writing. Although SOL is currently heading in a bearish direction, there is still potential for a rally if it breaks through its overhead resistance level.

However, this will require a return of demand for the altcoin and consistent trading of Bitcoin above the $28,000 mark. Continued consolidation for SOL could lead to a loss of its current support and a subsequent drop in value over future trading sessions. The market capitalization of Solana has also decreased, indicating increased selling pressure on the daily chart.

Solana Price Analysis: One-Day Chart

Solana

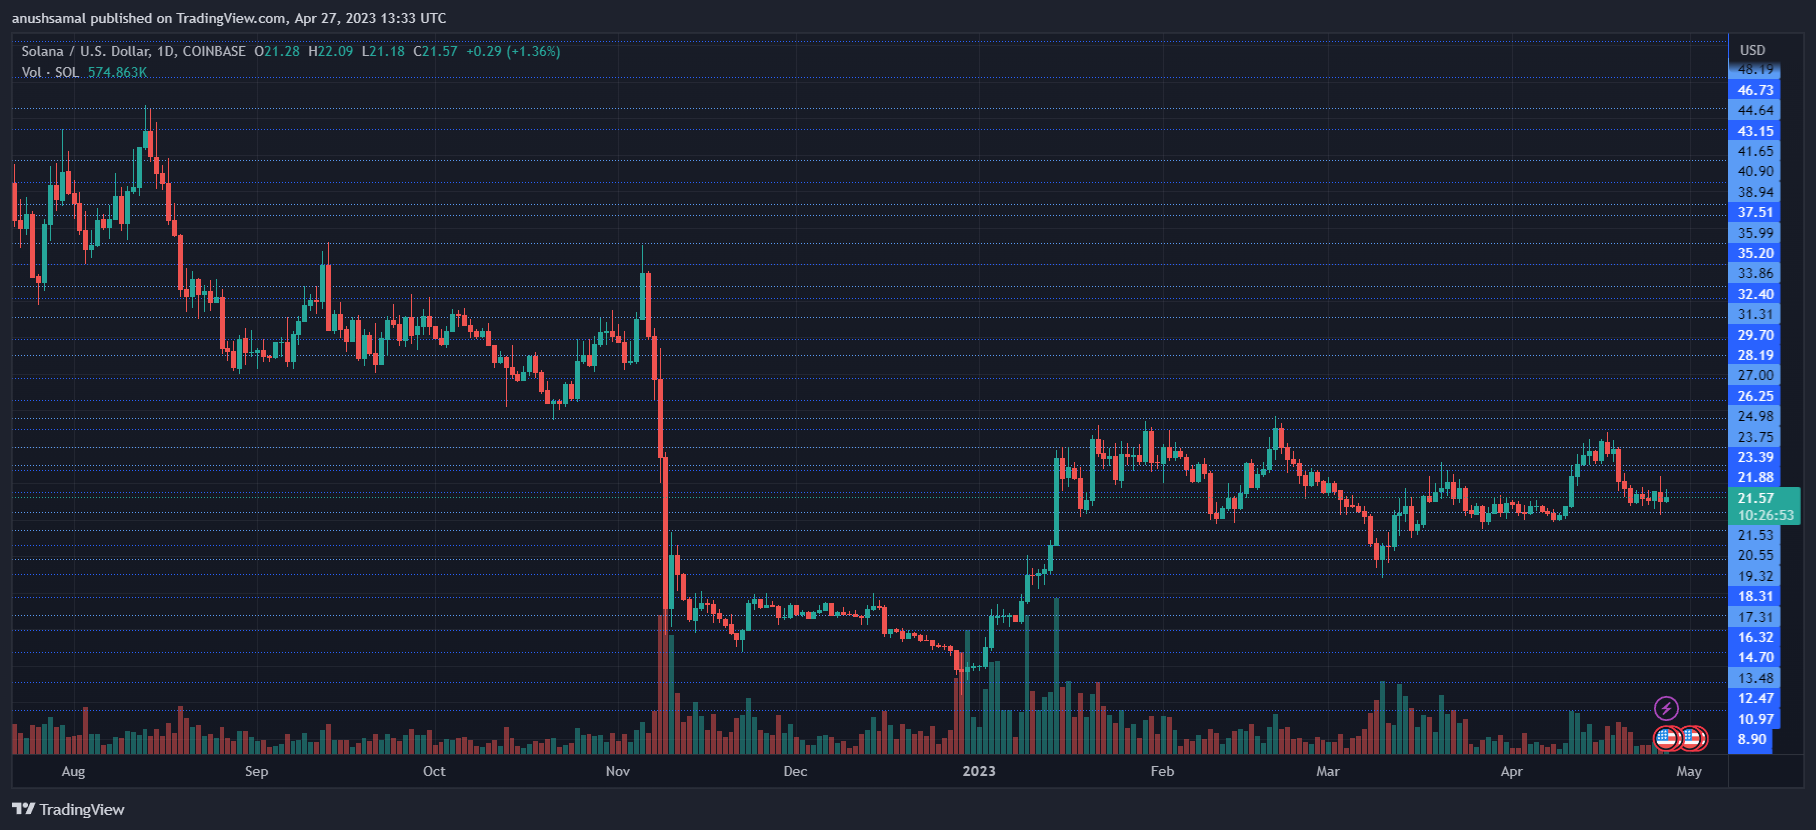
At the time of writing, Solana was priced at $21.57. Its overhead resistance level was identified at $23.30, which also serves as crucial as it has previously acted as a sell zone for the coin.

If SOL manages to surpass this resistance level, it could potentially reach $26. This will result in a price appreciation of almost 22%. Conversely, a decline from the current price level would push Solana down to $20 and eventually $18.

The trading volume of Solana in the last session decreased, indicating a drop in demand for the altcoin at the time of writing. It is important to note that breaching the $23.30 resistance level would require a resurgence of demand for SOL.

Technical Analysis

Solana

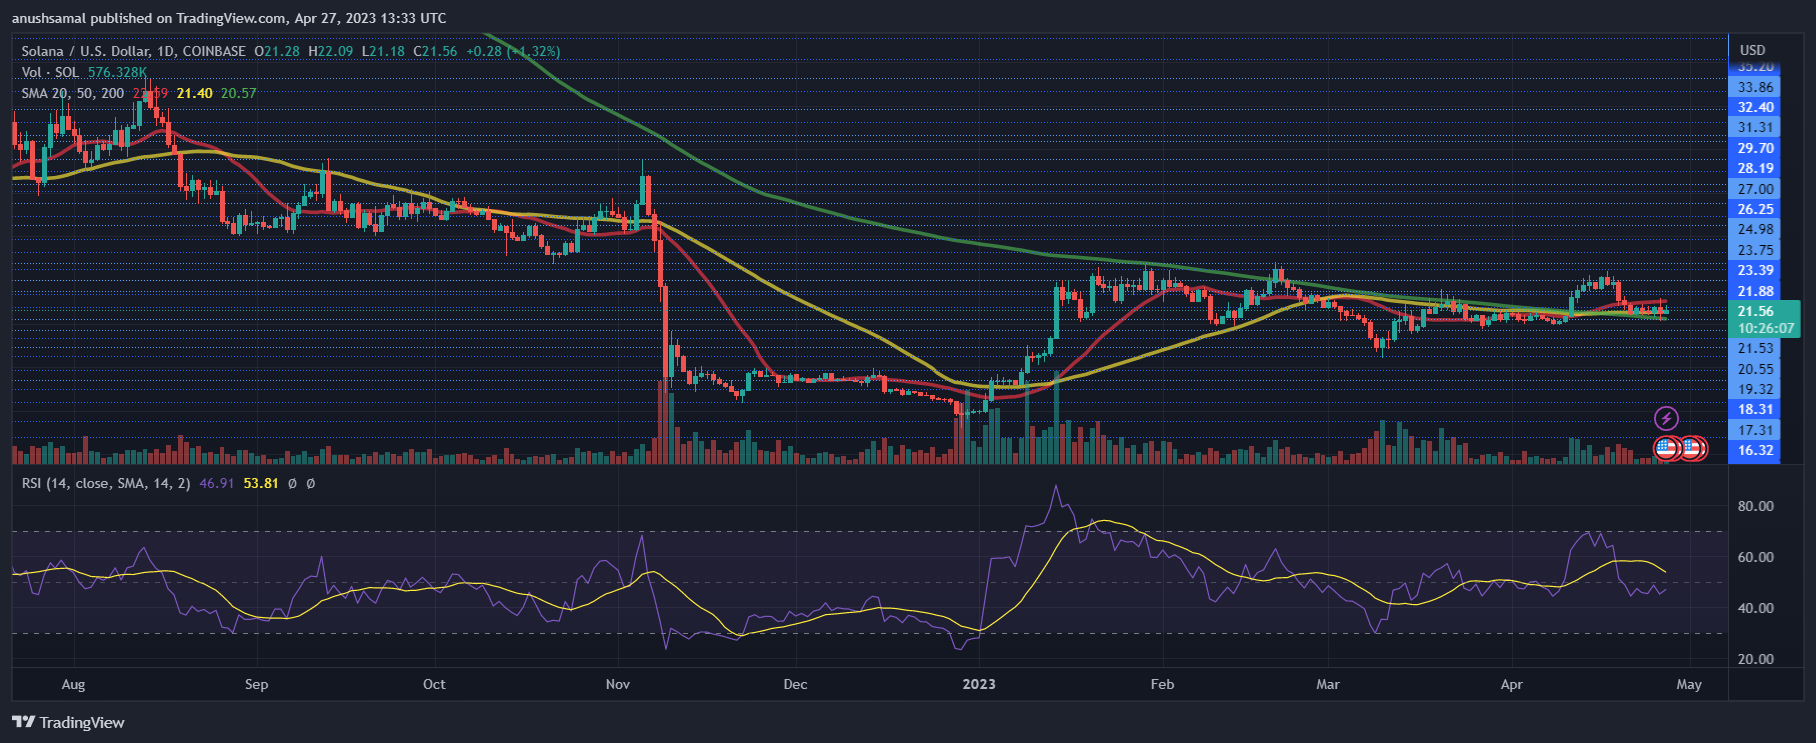
Over the past week, demand for the altcoin has remained low, causing buyers to lose confidence, especially after its fall from the $23 level. At the time of writing, the Relative Strength Index indicated that selling strength had surpassed buying strength, as it was below the 50 mark.

Additionally, SOL dropped below the 20-SMA line, signaling that sellers had taken control of the market. However, there is still a possibility for a bullish market if buyers make a slight push, allowing Solana to rise above the 50-SMA line. This move could attract more buyers and revive confidence in the altcoin.

Solana

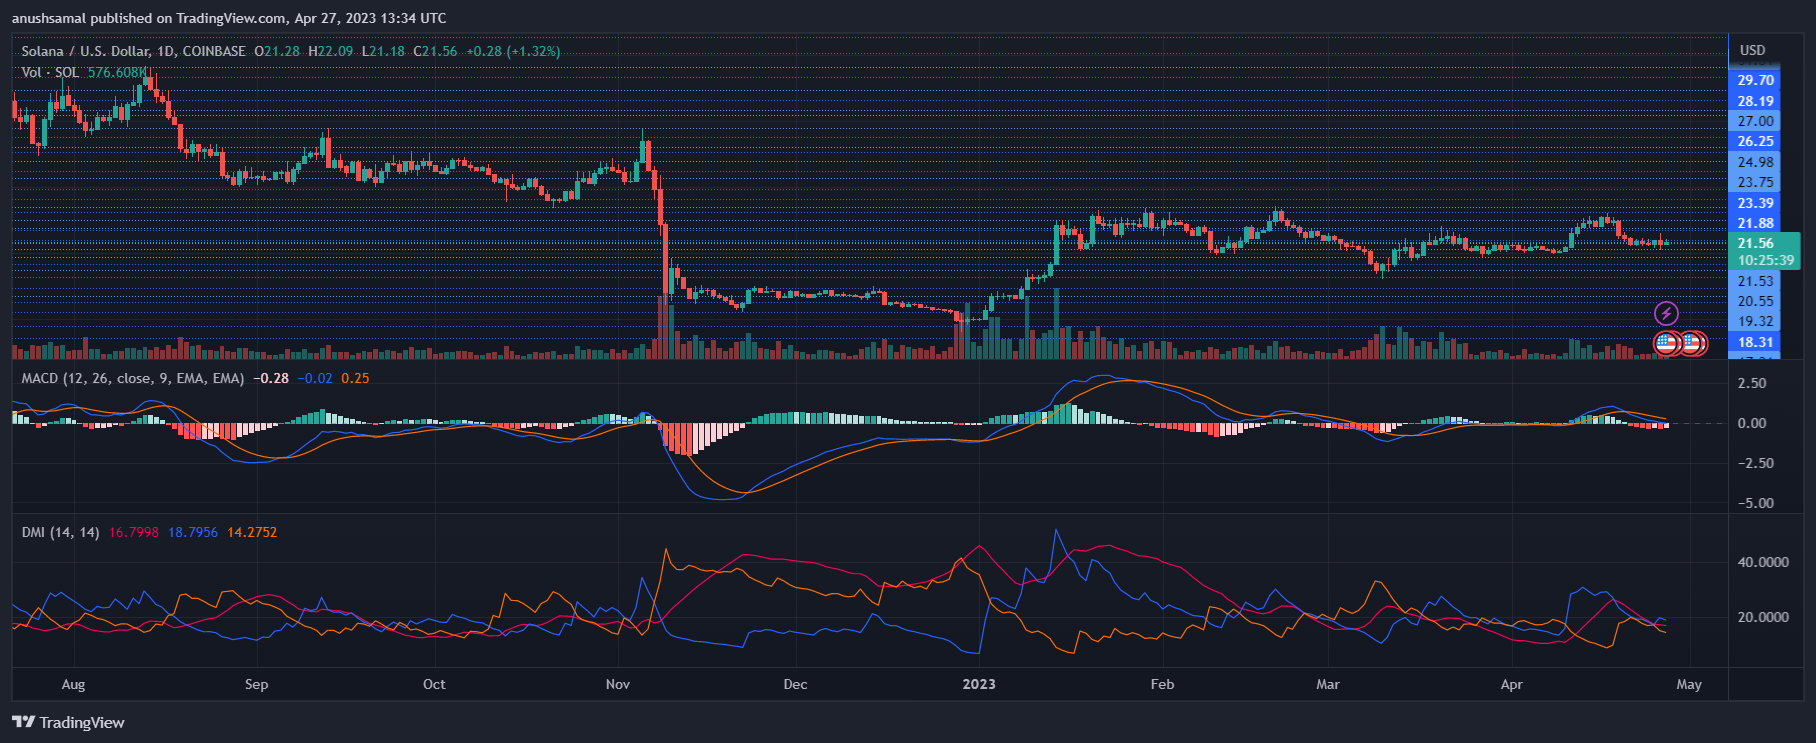
On the one-day chart, SOL showed sell signals that are consistent with other technical indicators. The Moving Average Convergence Divergence, which reflects price momentum, has formed red histograms that indicate sell signals for the altcoin. This signals a bearish price trend.

Furthermore, the Directional Movement Index (DMI) is negative, with the -DI line (orange) positioned above the +DI line (blue). Additionally, the Average Directional Index (red) has fallen below 20, indicating a weakening direction in the current price.

Avalanche Remains Under Pressure Despite Circle’s CCTP Effort

The native currency of Avalanche, AVAX, remains under pressure despite Circle’s effort to launch a facility that will enable the direct transfer of USDC between Ethereum and Avalanche blockchains. 

Avalanche (AVAX) Is Down 18% From April 2023 Peaks

Avalanche is a smart contracting platform with sub-second transaction finality and a rival of Ethereum. However, considering the first-mover advantage of Ethereum and the activity level on the pioneer smart contracting platform, Avalanche lags even though it offers high scalability translating to relatively low trading fees.

Despite the launch of the Cross-Chain Transfer Protocol (CCTP) by Circle, the team behind USDC, a stablecoin; AVAX remains under trading range and has been unable to move higher, reversing recent losses.

When writing on April 27, AVAX is down 18% from April 2023 highs of around $20 and down roughly 10% in the last trading week, according to CoinMarketCap data.

Although the market uptrend of April 26 temporarily forced AVAX higher, buyers on April 27 didn’t follow through. AVAX remains below the local resistance at $18 but above last week’s support at around $16. 

Avalanche Price On April 27| Source: AVAXUSDT On Binance, TradingView

However, from a broader perspective, AVAX is up 25% from March 2023 lows and has gained 65% from December 2022 lows. The impressive performance was a huge boost for AVAX, a coin that plunged 88% from November 2021 peaks when it was changing hands at around $145. 

Based on the current AVAX formation, it is yet to be seen whether fundamental events will trigger demand and push the coin above $20, reversing this week’s losses. 

Circle Launches Cross-Chain Transfer Protocol For USDC Transfer

The decision by Circle to develop and launch a mainnet protocol for bidirectional cross-chain transfers between Ethereum and Avalanche will be convenient for users.

It could also boost decentralized finance (DeFi) activities in Avalanche since users don’t have to use a third party, effectively eradicating the need for bridges and helping consolidate the web3 ecosystem. This would also have a significant effect on general liquidity on the Avalanche blockchain.

Avalanche is suited for the development of decentralized finance (DeFi) dapps and as of April 27, the blockchain managed over $798 million as measured by the total value locked (TVL), according to DeFiLlama. Aave, a lending protocol available in, among other chains, Ethereum, is the largest DeFi dapp by TVL, managing $262 million.

Besides liquidity, considering the mega hacks of 2022, for example, the Ronin and BNB Chain Bridge hacks, the Cross-Chain Transfer Protocol (CCTP) also boosts security for users and DeFi protocols.

Circle said several firms, including MetaMask, Celer, and Wormhole, have pledged to use the CCTP.

Filecoin Price Struggles To Move, Will It Surpass The $6 Barrier?

The 30th largest cryptocurrency Filecoin (FIL) has recorded an increase in its 24-hour trading volume. This recent trend has attracted investors and traders closely monitoring its price movement. However, the coin struggles to break through the important $6 resistance.

The question now is, will Filecoin be able to break the $6 barrier? What’s the future potential of Filecoin? Notably, FIL trading volume surged significantly in 24 hours. This volume indicates increased network activity which might later push FIL price if the crypto market breaks from the current downtrend.    

Filecoin Recorded Price Dips, What’s The Current Sentiment?

Filecoin is a peer-to-peer network created by Protocol Labs. Users pay storage miners to guarantee that their files are correctly and securely preserved over time. The Filecoin blockchain keeps track of transactions to verify file storage.

The cryptocurrency market is known for its volatility. Sudden swings in the value of digital assets occur frequently. Being a player in this market, Filecoin has seen increased selling momentum and downward movement.

Related Reading: MATIC Price Prediction: Polygon Recovery Faces Many Hurdles

FIL has experienced some significant drop in price over the past few days, affecting its overall market sentiment and current price movement. But with the Fear & Greed Index of 61 (Greed), the current sentiment is positive. 

However, given that the price is in a zone where investors are likely to want to sell down, this suggests that there might be a potential price reversal.

The trend reversed due to a shift in direction in the 50-day simple moving average (SMA) on 17 April 2023, and this may continue if bullish momentum remains weak. The SMA indicator is frequently used to spot trends, resistance and support levels, and probable buy/sell signals.

By crossing below the 200-day SMA, the 50-day SMA has also formed a death cross, which might be a bearish signal and suggest a potential selling opportunity. The RSI is closely below the neutral zone, indicating the selling momentum is still high. However, the buyers are trying to build strength. Watch closely for a possible trend revisal.

Filecoin Key Support And Resistance Zones

On 23 April 2023, the Filecoin price dropped by 17.35%, making the coin fall to a support level of $5.117. The banking crisis’s impact on the financial market also affected the price movement of altcoins.

Related Reading: Polygon Exchange Supply Spikes, More Downtrend Incoming?

FIL could drop another 15%, reaching a month-long low of $4.79, if the panic persists and the altcoin breaches the crucial support level at $4.990.

Filecoin Price Struggles To Surge, Will It Surpass The $6 Barrier?

Filecoin trades between support and resistance levels of $5.46 and $5.8. The first significant resistance level for FIL is $6.388. If the price moves above the current point, the coin will reach the next resistance levels, at $8.34 and $9.24.

Featured image from Pixabay and chart from Tradingview

Chainlink Pushes Above $7, Will The Short-Term Recovery Hold?

The price of Chainlink had been in a period of consolidation over the past few sessions. However, the bulls were recently able to break above an important resistance level. Despite this recent bullish action, the daily chart showed a 6% depreciation and on the weekly chart, LINK had a 9% loss.

The technical outlook looked bleak with fading demand and low accumulation. Nevertheless, if LINK can remain above the $7 mark, another rebound may be possible. As Bitcoin displayed mild bullish sentiment after reclaiming the $28,000 mark, most altcoins exhibited similar behaviors.

If BTC retraces in the next trading sessions, LINK is expected to move closer to its immediate support level. Maintaining buying strength is crucial for the asset to stay above its local price floor. The market capitalization of LINK had fallen, indicating that sellers were more active.

Chainlink Price Analysis: One-Day Chart

Chainlink

At the time of writing, Chainlink was trading at $7.02, with its immediate resistance at $7.40. If the altcoin manages to surpass this resistance, it will encounter a tough price ceiling of $7.70, and reaching that level may revive the bulls.

Conversely, failing to stay above the $7 mark will pull Chainlink down to $6.80. If this happens, LINK may decline by up to 15%, nearing the $5.80 mark. The last session saw a decrease in the amount of LINK traded, and indicators suggested that buying strength was weakening.

Technical Analysis

Chainlink

Chainlink had experienced a sharp drop in buyers’ interest after encountering significant resistance at $7.70. However, demand for the altcoin could partially return if it moves above the $7.00 price mark. The Relative Strength Index was below the half-line, hovering around 40, indicating that sellers had taken control of the market.

Additionally, LINK had fallen below the 20-Simple Moving Average line, signaling that sellers were driving the price momentum at press time. If demand picks up, LINK could rise above the 50-SMA line (yellow), providing some relief to the bulls.

Chainlink

In line with the other technical indicators, LINK displayed sell signals, indicating a bearish turn in price. The Moving Average Convergence Divergence (MACD) demonstrates an asset’s price momentum and trend reversals as well. The MACD formed red histograms below the half-line, signaling a sell signal for the asset.

The Parabolic SAR reads the price direction and changes in the same. The indicator formed dotted lines above the price candlesticks, suggesting a downtrend in the price.

For LINK to maintain its price above the $7 mark, buying strength needs to resurface over the immediate trading sessions, and broader market strength has to remain consistent.