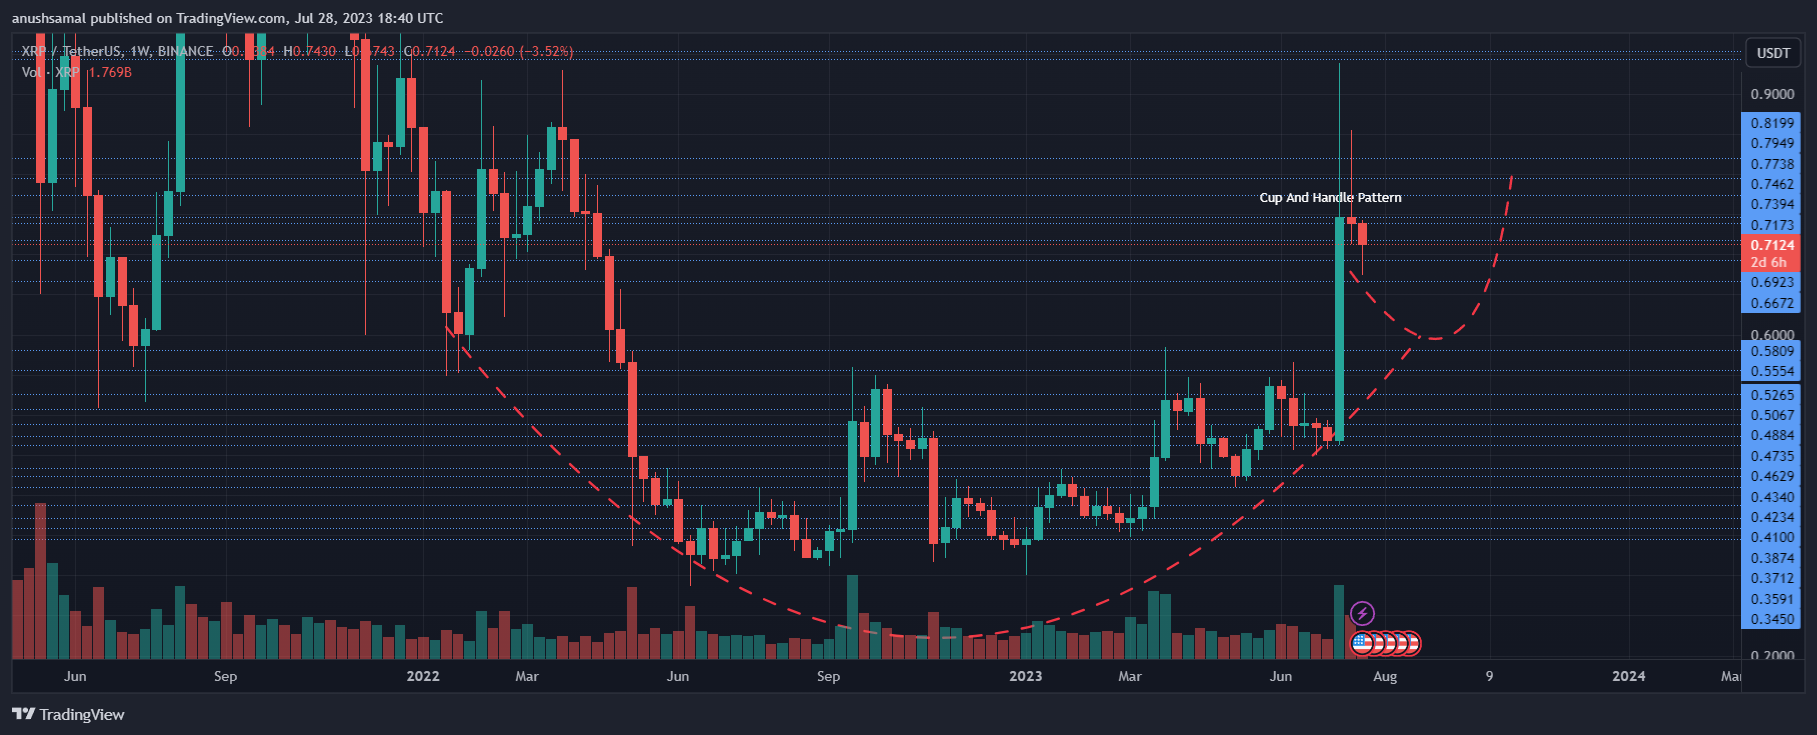
XRP has halted its decline by rising above the $0.60 price level. In the past 24 hours, its value increased by nearly 6%. However, XRP hasn’t yet shown significant gains on the weekly chart.
The technical analysis suggests a positive trend for XRP, but there’s a chance that the coin could face more downward movement in the upcoming trading sessions.
If buyers push the price higher, XRP might maintain its position above the current price level. Moreover, breaking through two crucial resistance levels could lead to a potential surge of over 9%. For XRP to keep rising, the broader market must provide support, particularly Bitcoin’s movement beyond the $30,000 zone.
If buying momentum doesn’t recover, XRP might experience a decline and drop below its local support line. The increasing market capitalization of XRP indicates active buyer participation at the present moment.
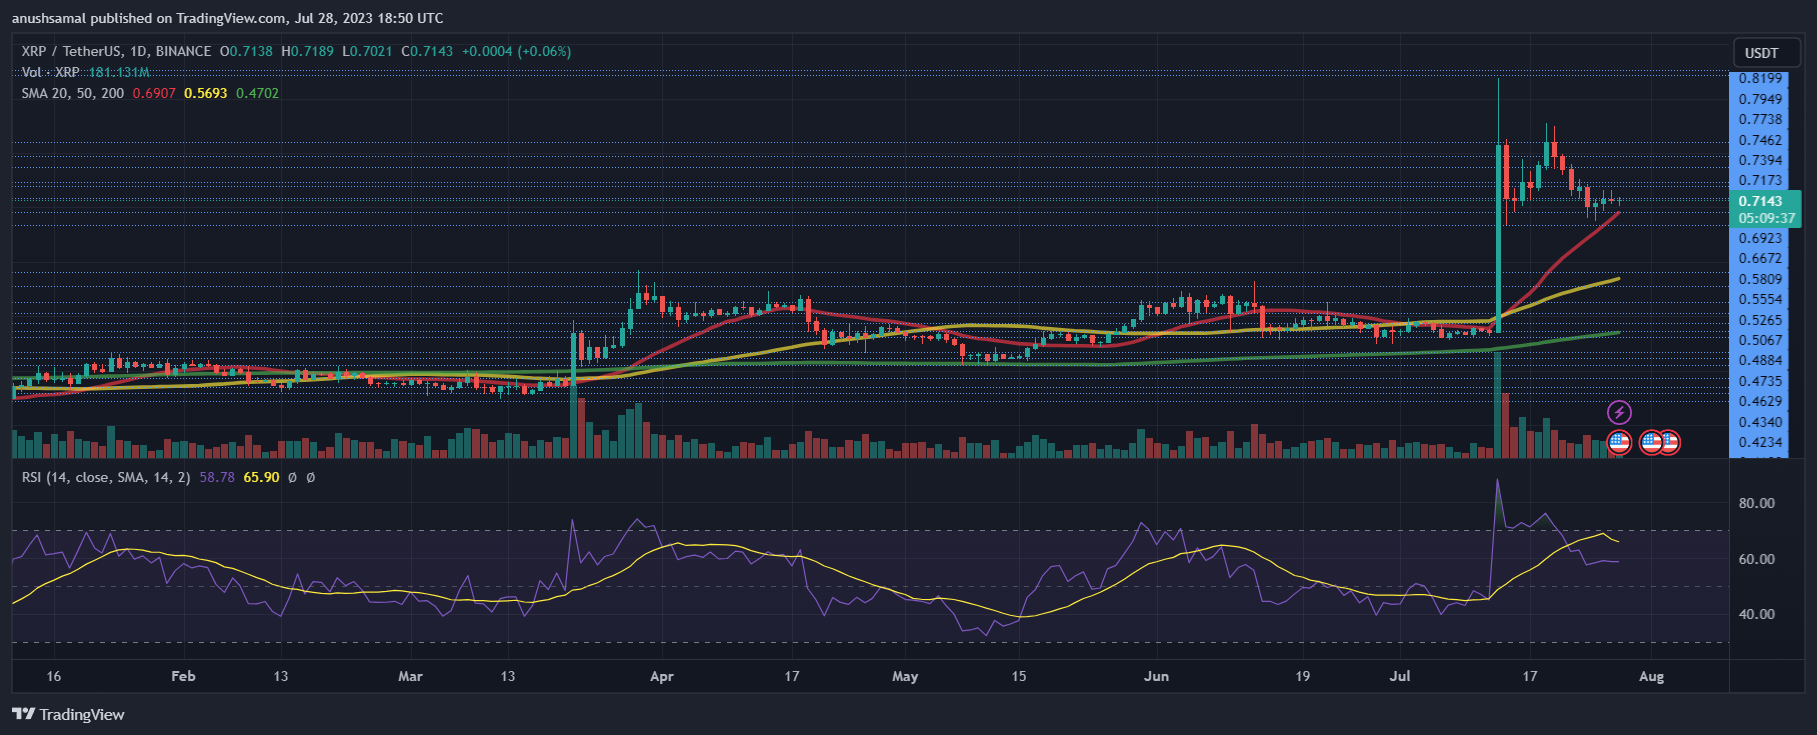
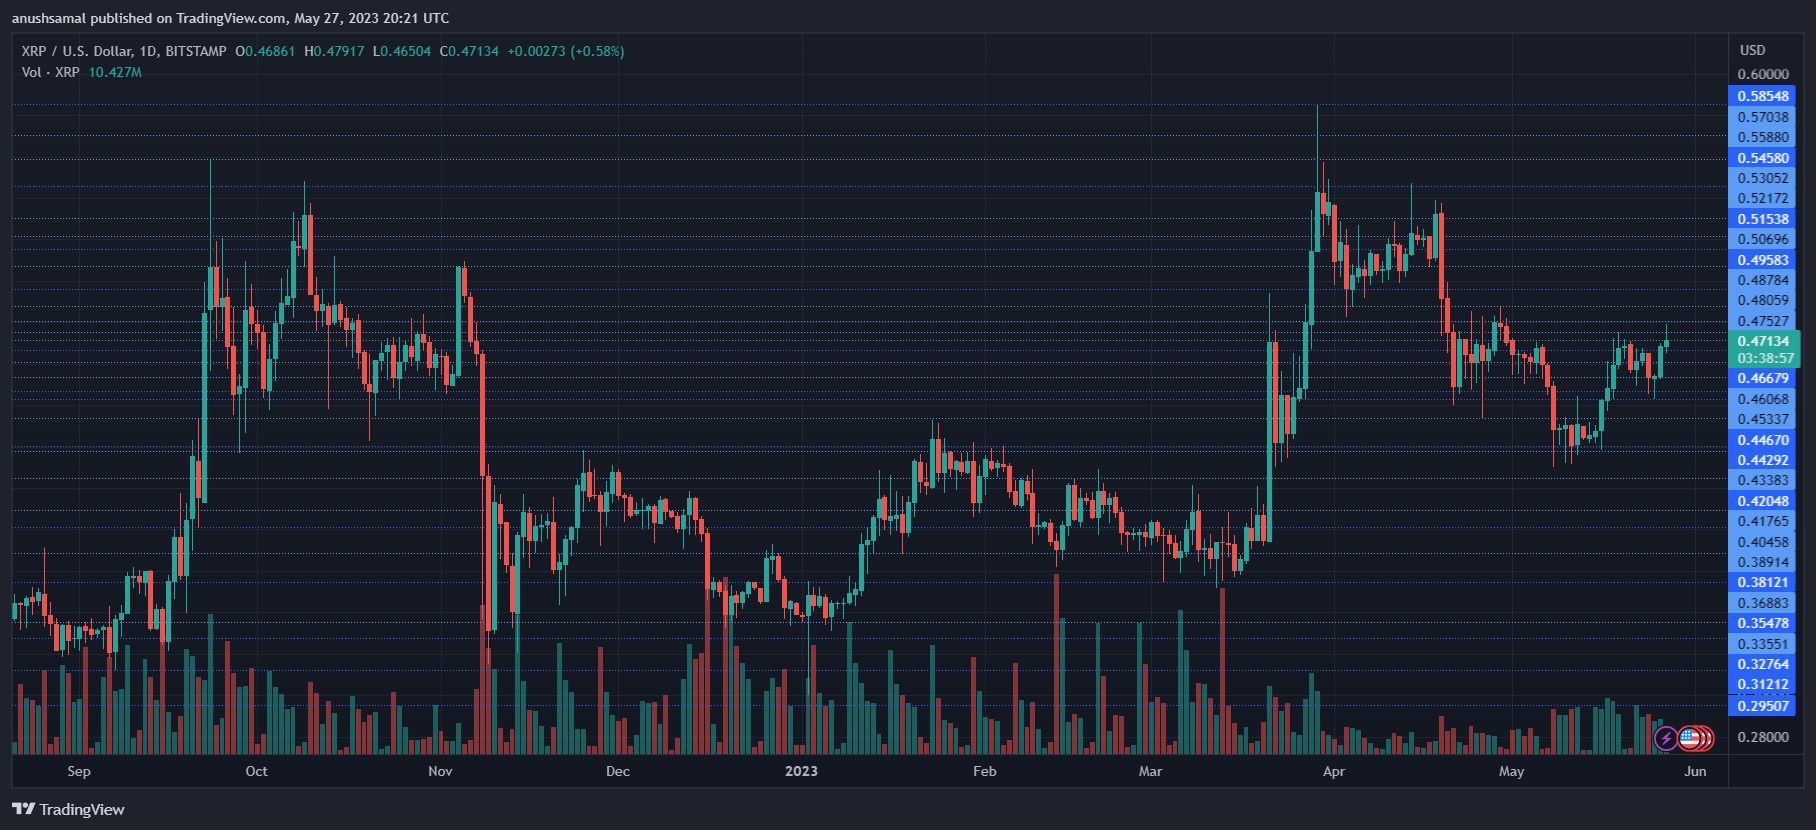
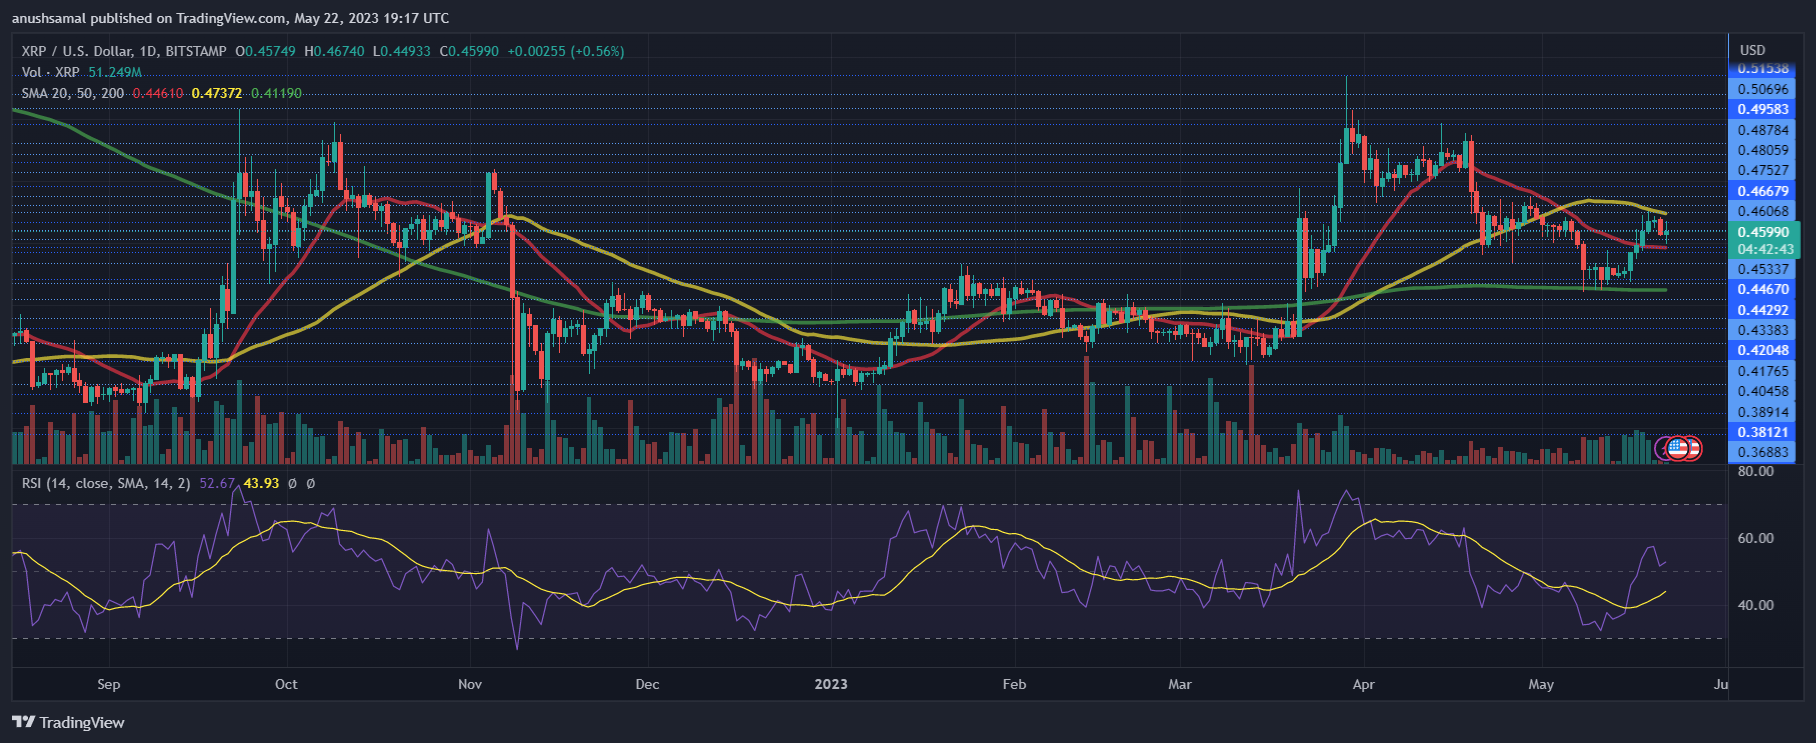
XRP Price Analysis: One-Day Chart
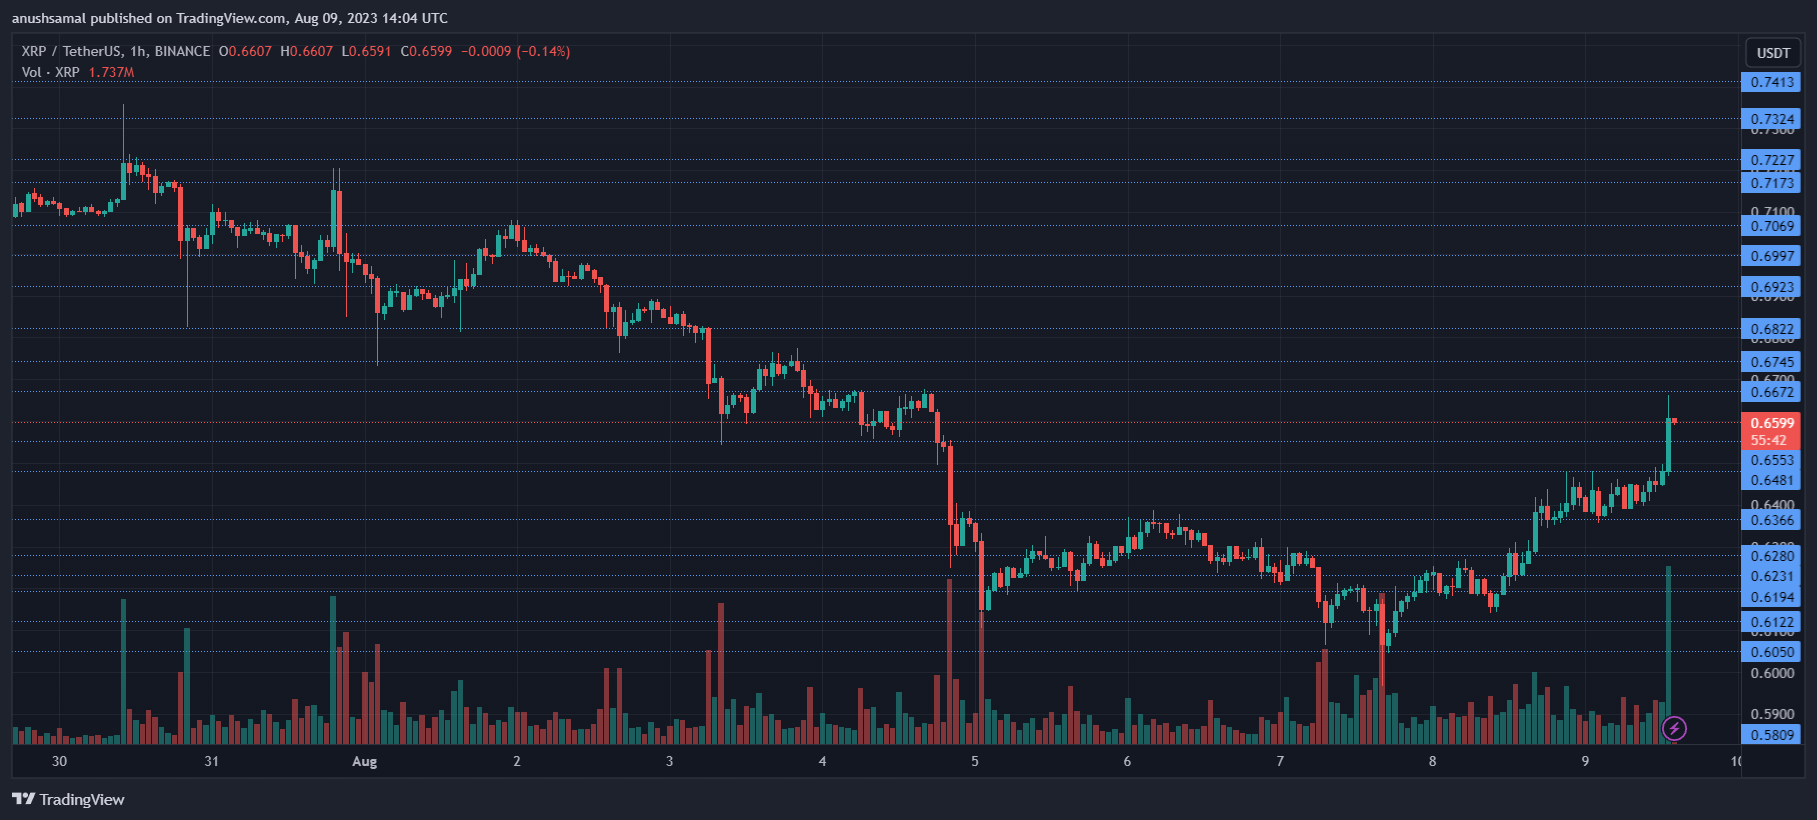
At the time of writing, the altcoin was priced at $0.65. This value has presented significant resistance for the altcoin in recent weeks. The upcoming trading sessions hold critical importance as XRP must effectively surpass this level.
Failing to achieve this could trigger a subsequent decline in the price. Furthermore, overhead resistance levels are $0.67, followed by $0.69. Should XRP successfully breach the $0.69 mark, the altcoin might trade around the $0.72 range. Conversely, a local support level is positioned at $0.63.
Should the price dip below this threshold, it could potentially descend to $0.60, ultimately pausing the overall bullish sentiment.
Technical Analysis
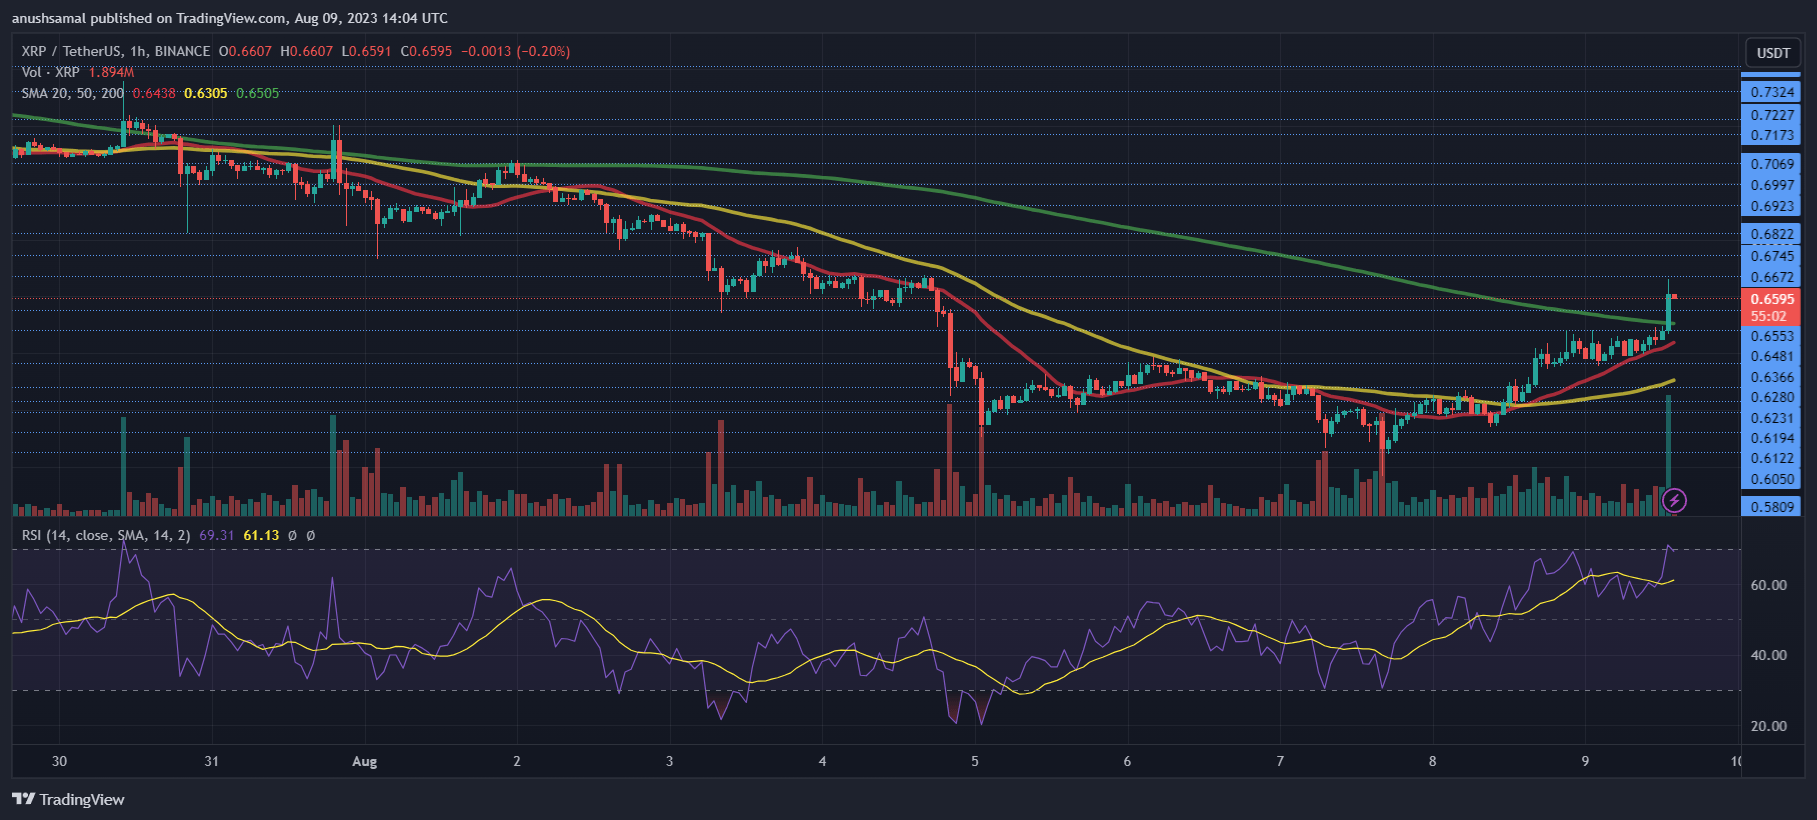
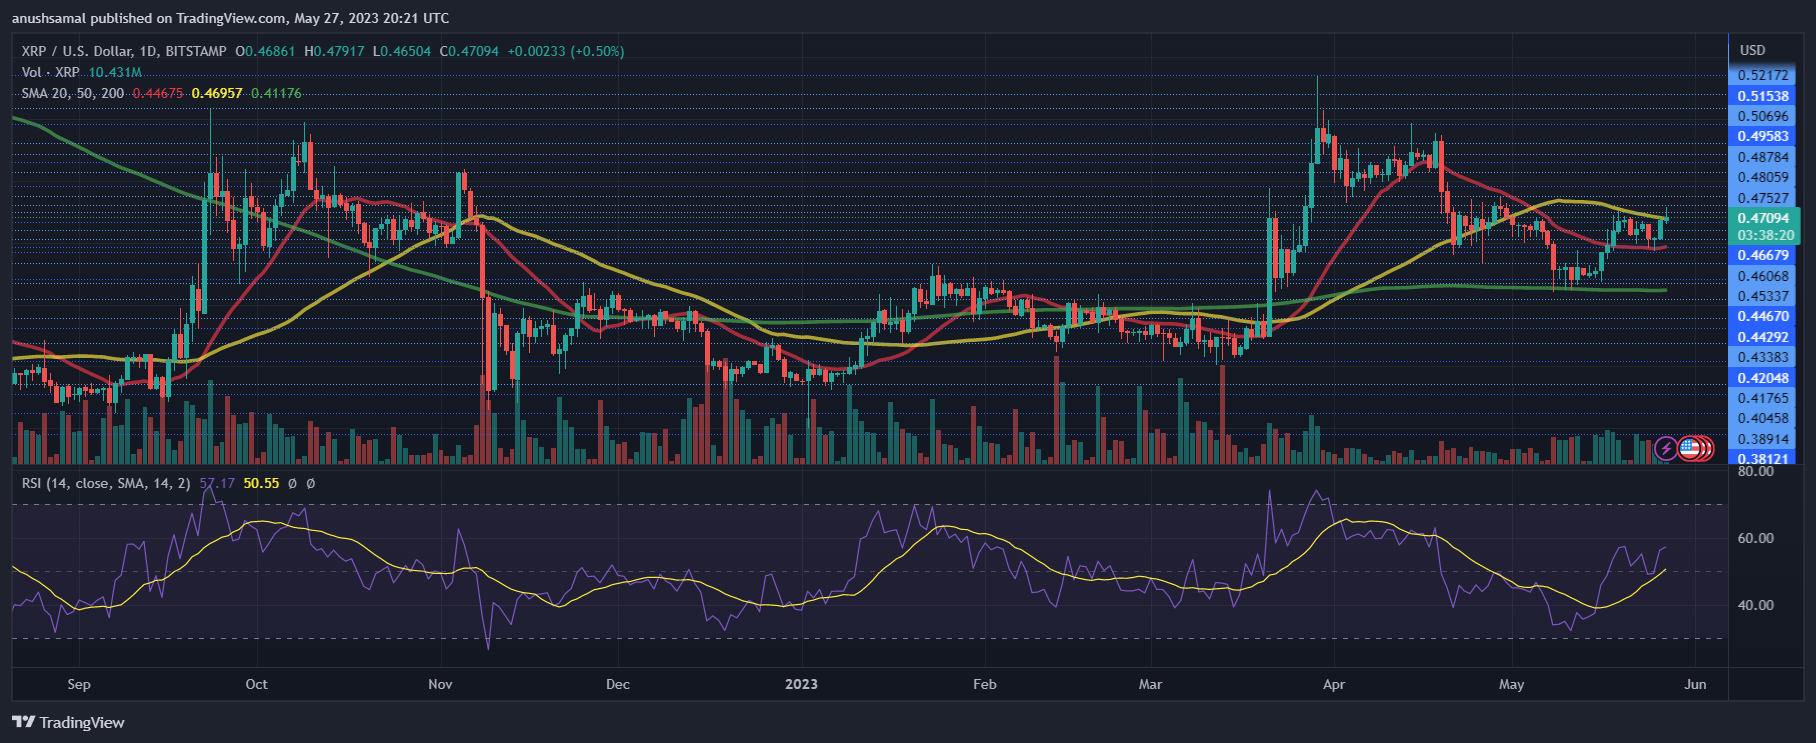
For demand, XRP’s chart indicates its current state as overbought. The Relative Strength Index has reached 70, indicating buyers currently influence the price direction. This could imply the potential for a price correction in the upcoming trading sessions.
While such a correction might not be prolonged, any drop in XRP’s value below $0.63 might reduce buyer activity.
The asset’s price remained positioned above the 20-Simple Moving Average line. This observation signifies an increasing demand and emphasizes buyers’ role in steering the market’s price dynamics.
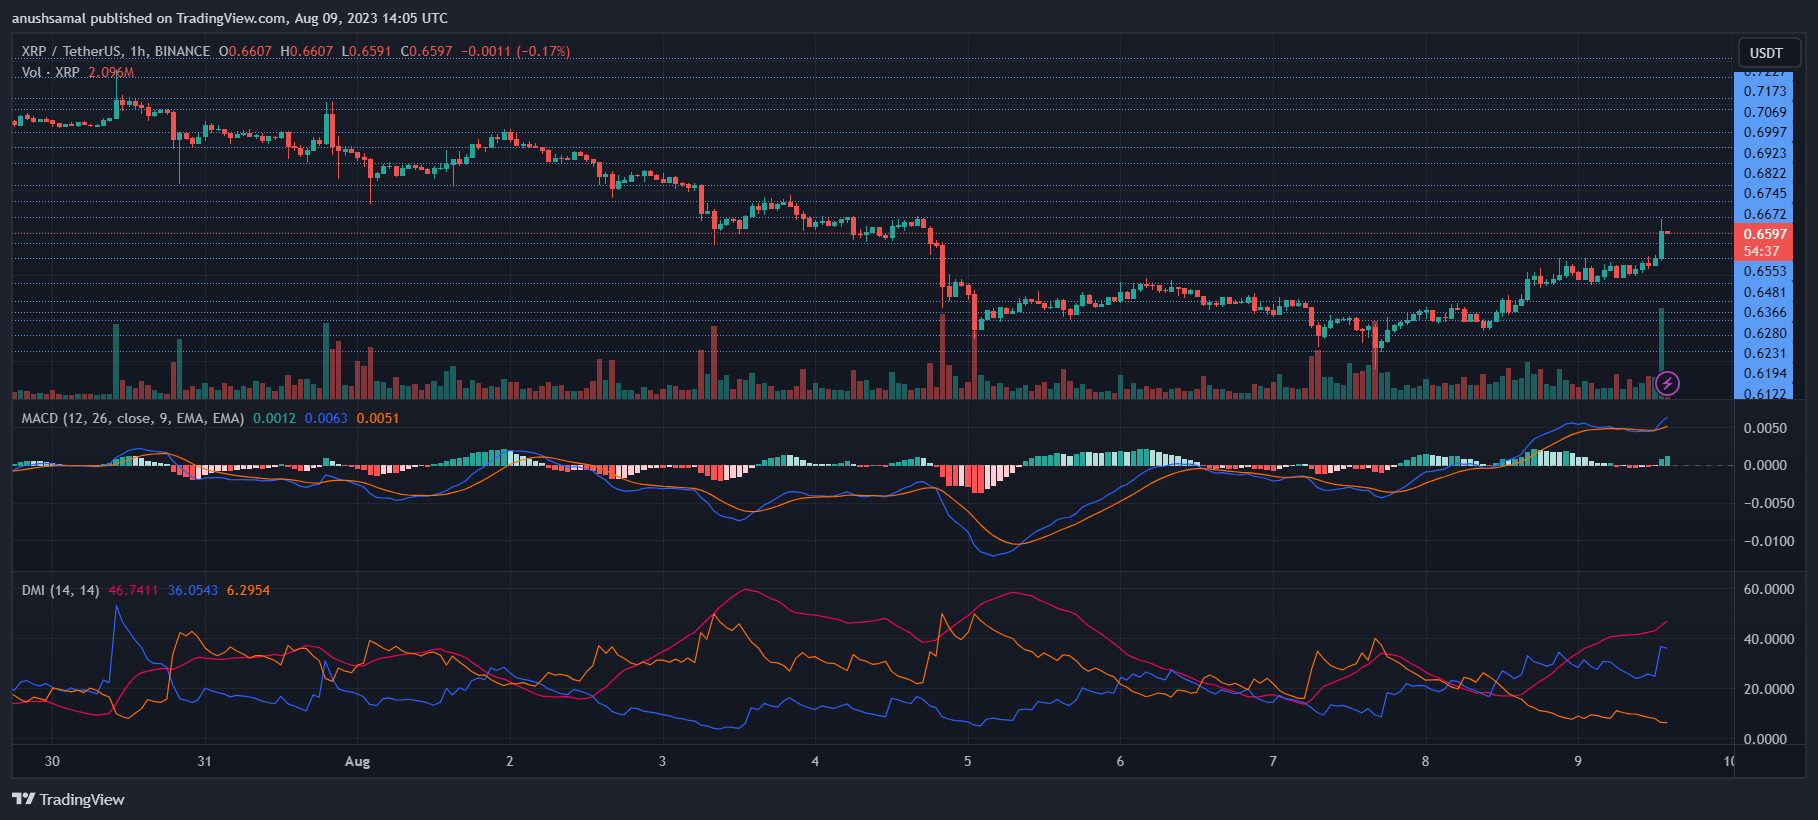
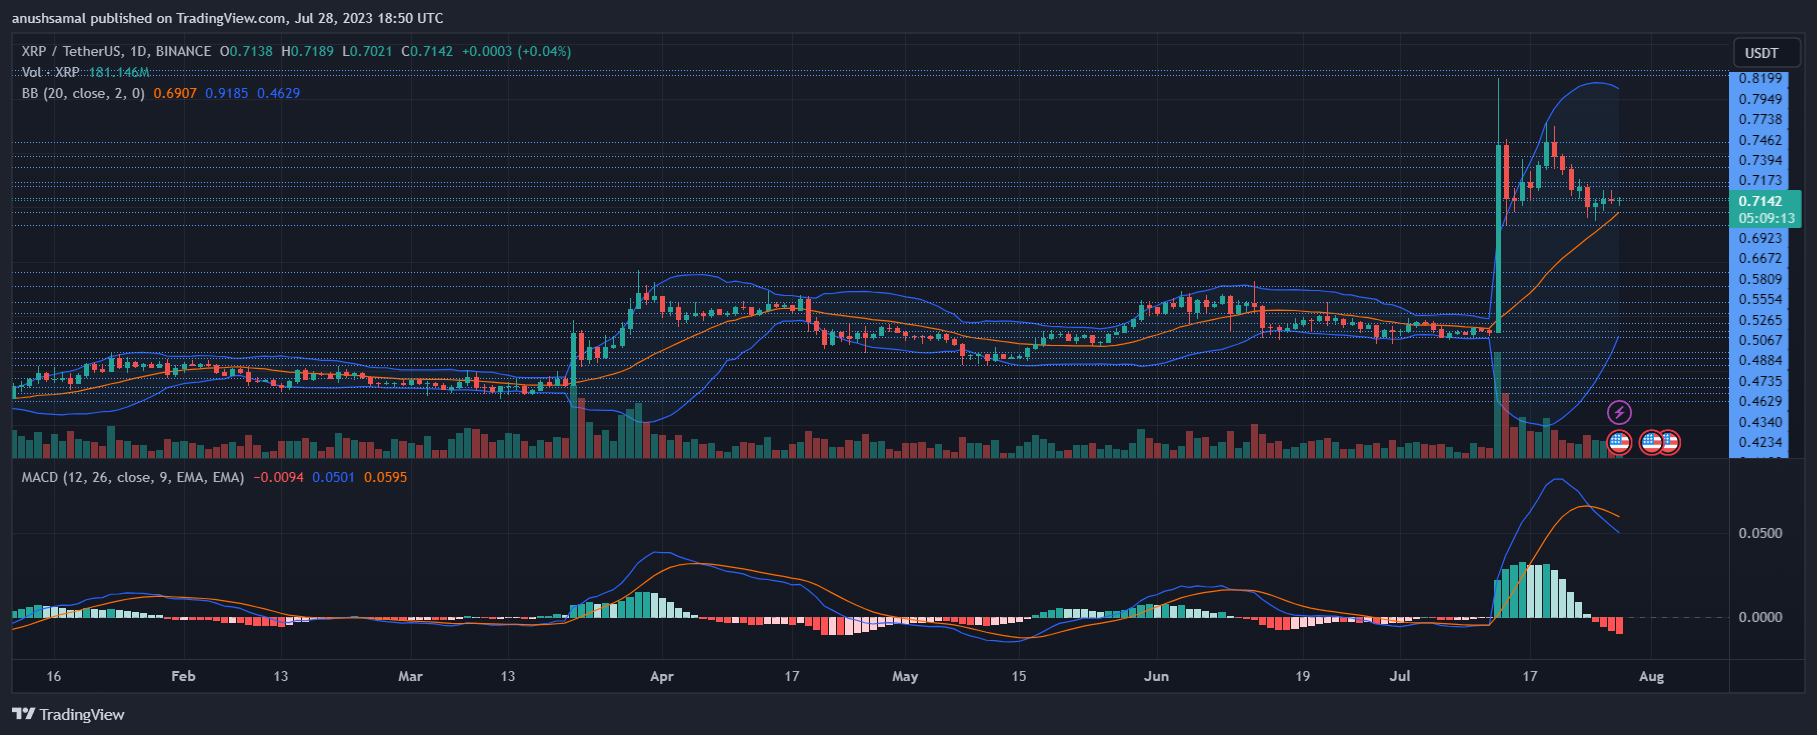
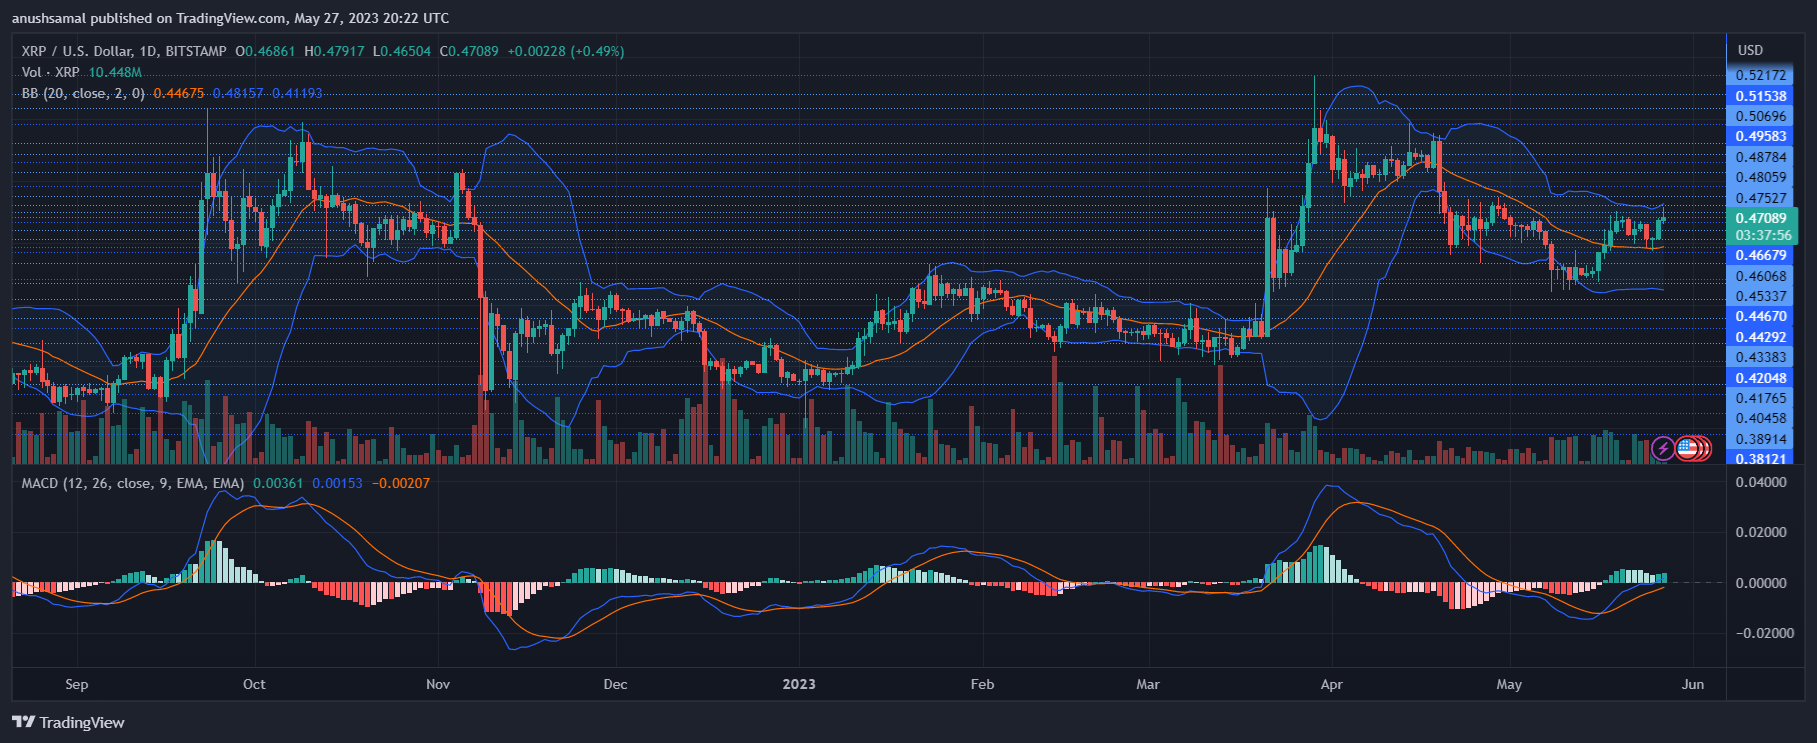
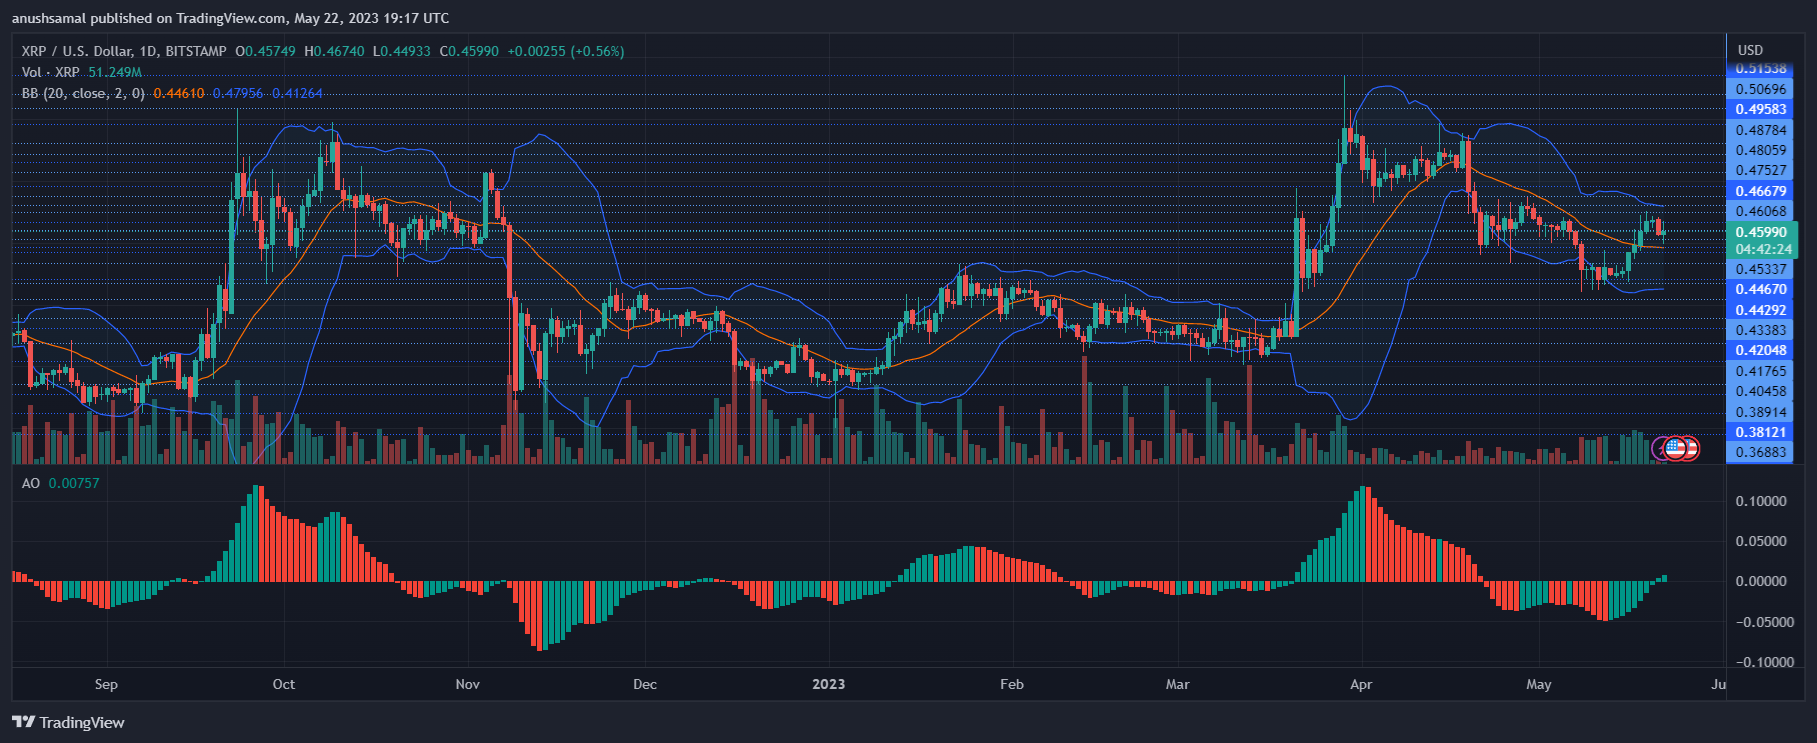
Furthermore, the altcoin has generated buy signals in response to the rising demand. These buy signals are represented by the emergence of green histograms in the Moving Average Convergence Divergence indicator, signaling a bullish sentiment.
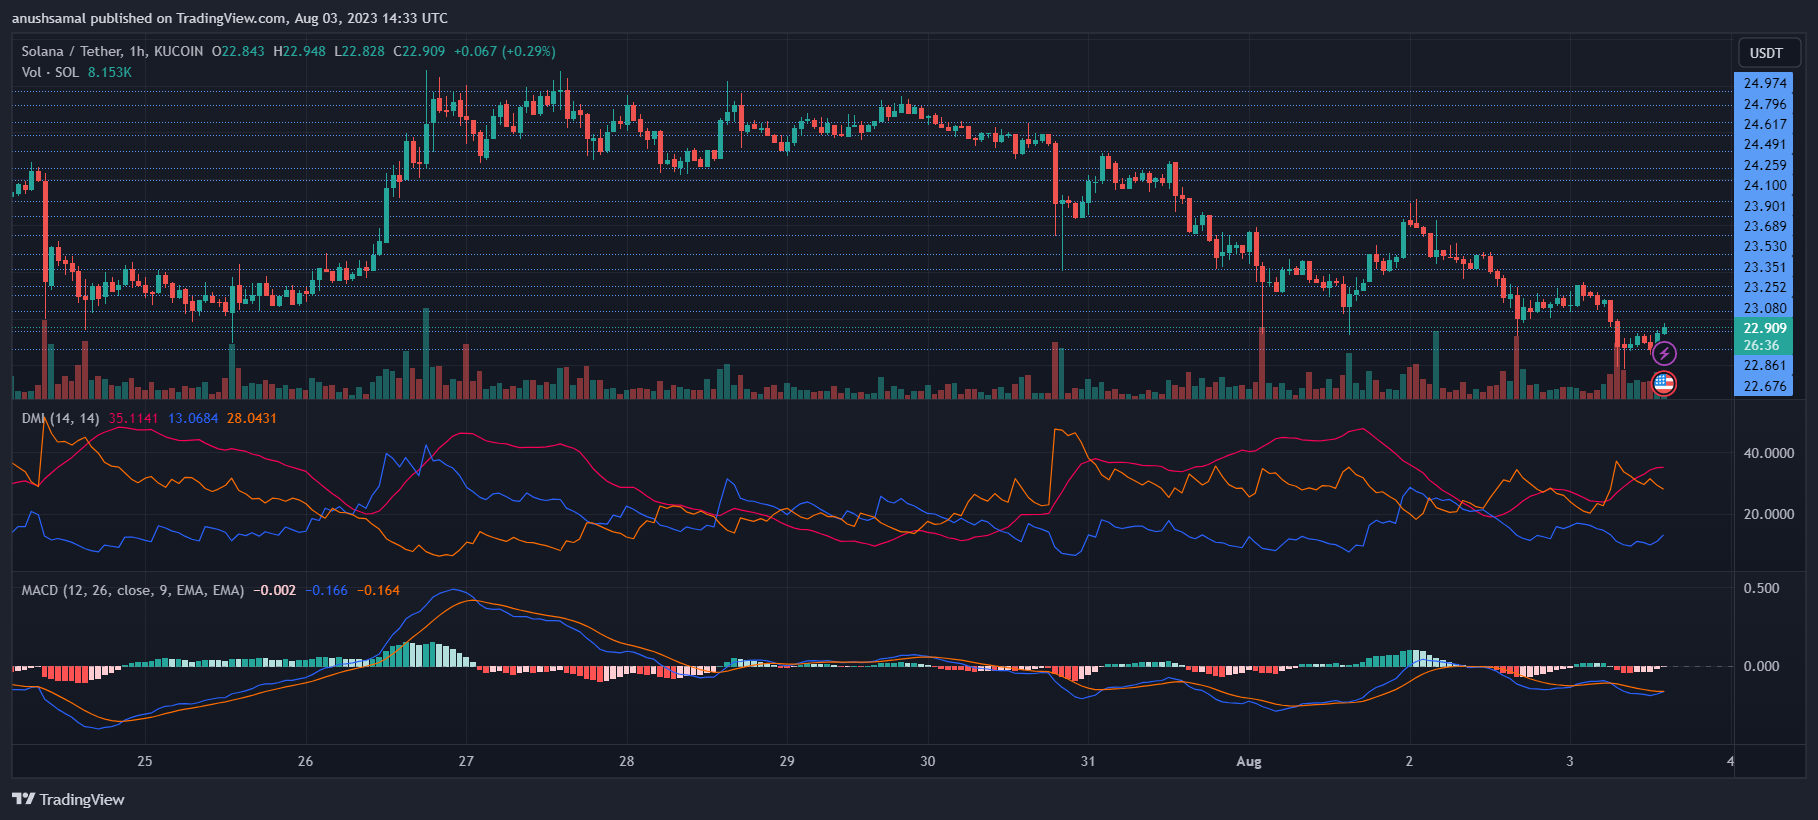
Additionally, the Directional Movement Index presents a positive outlook, with the +DI (blue) line positioned above the -DI (orange) line, indicating a favorable price trajectory.
Moreover, the Average Directional Index (Red) has crossed the 40 mark, implying an increase in the strength of the price trend. This development suggests XRP could yield additional gains in the near-term trading sessions.