Shiba Inu Could Rally Another 10% Upon Surpassing This Price Level

The price of Shiba Inu has been consolidating, leading to a downward trend. In the last 24 hours, SHIB has lost 2% of its value, and there has been limited movement on the weekly chart. This indicates a decrease in buying interest and an increase in selling pressure.

The market for SHIB appears oversold, but there is still a possibility of a price recovery if buyers step in. A small increase in buying activity could result in a significant appreciation of SHIB over the next trading sessions.

Moreover, there are bullish signals suggesting a potential breakout. The price movements of altcoins, including SHIB, have been similar to Bitcoin, which is currently experiencing uncertainty.

For SHIB to see positive momentum, a shift towards a more optimistic buying sentiment is necessary. However, it is worth noting that the market capitalization of SHIB has decreased, indicating that sellers currently have control over the asset’s price.

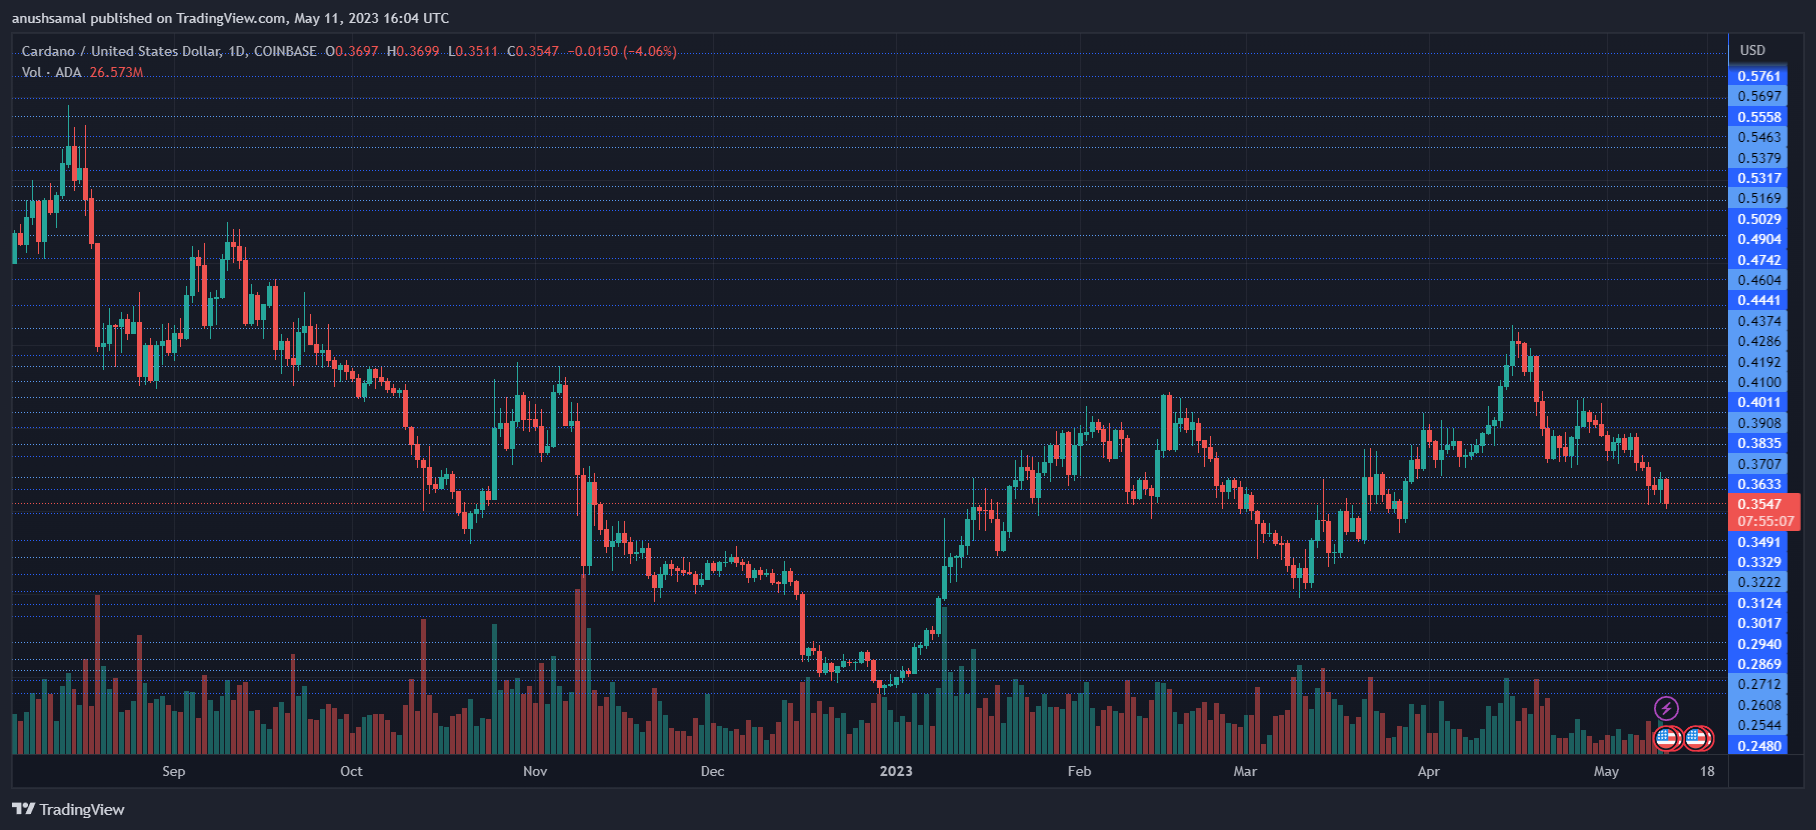
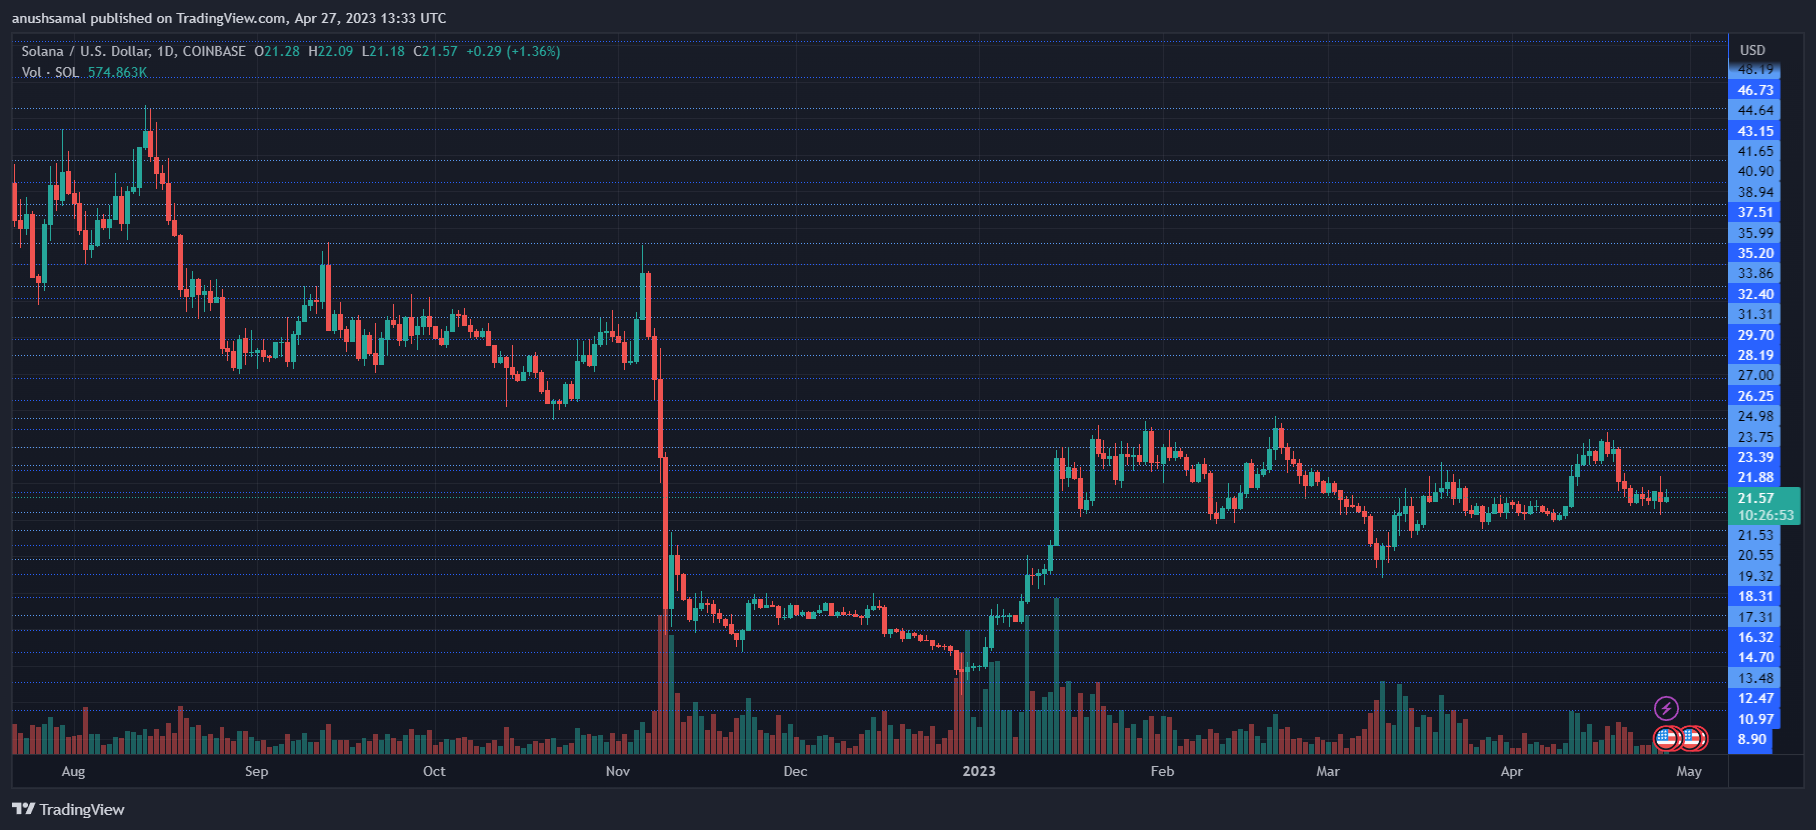
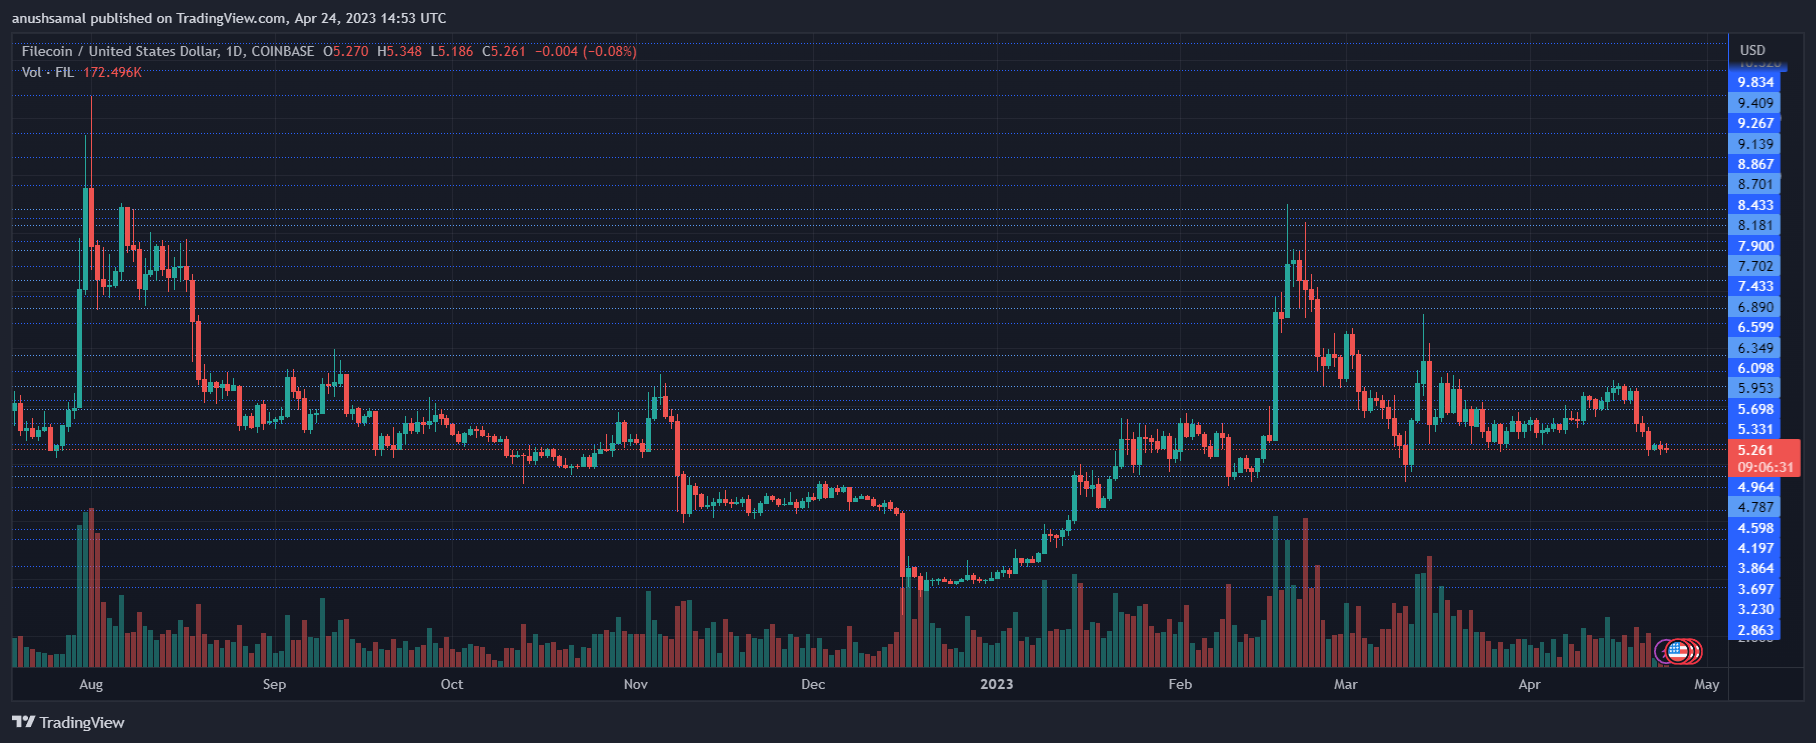
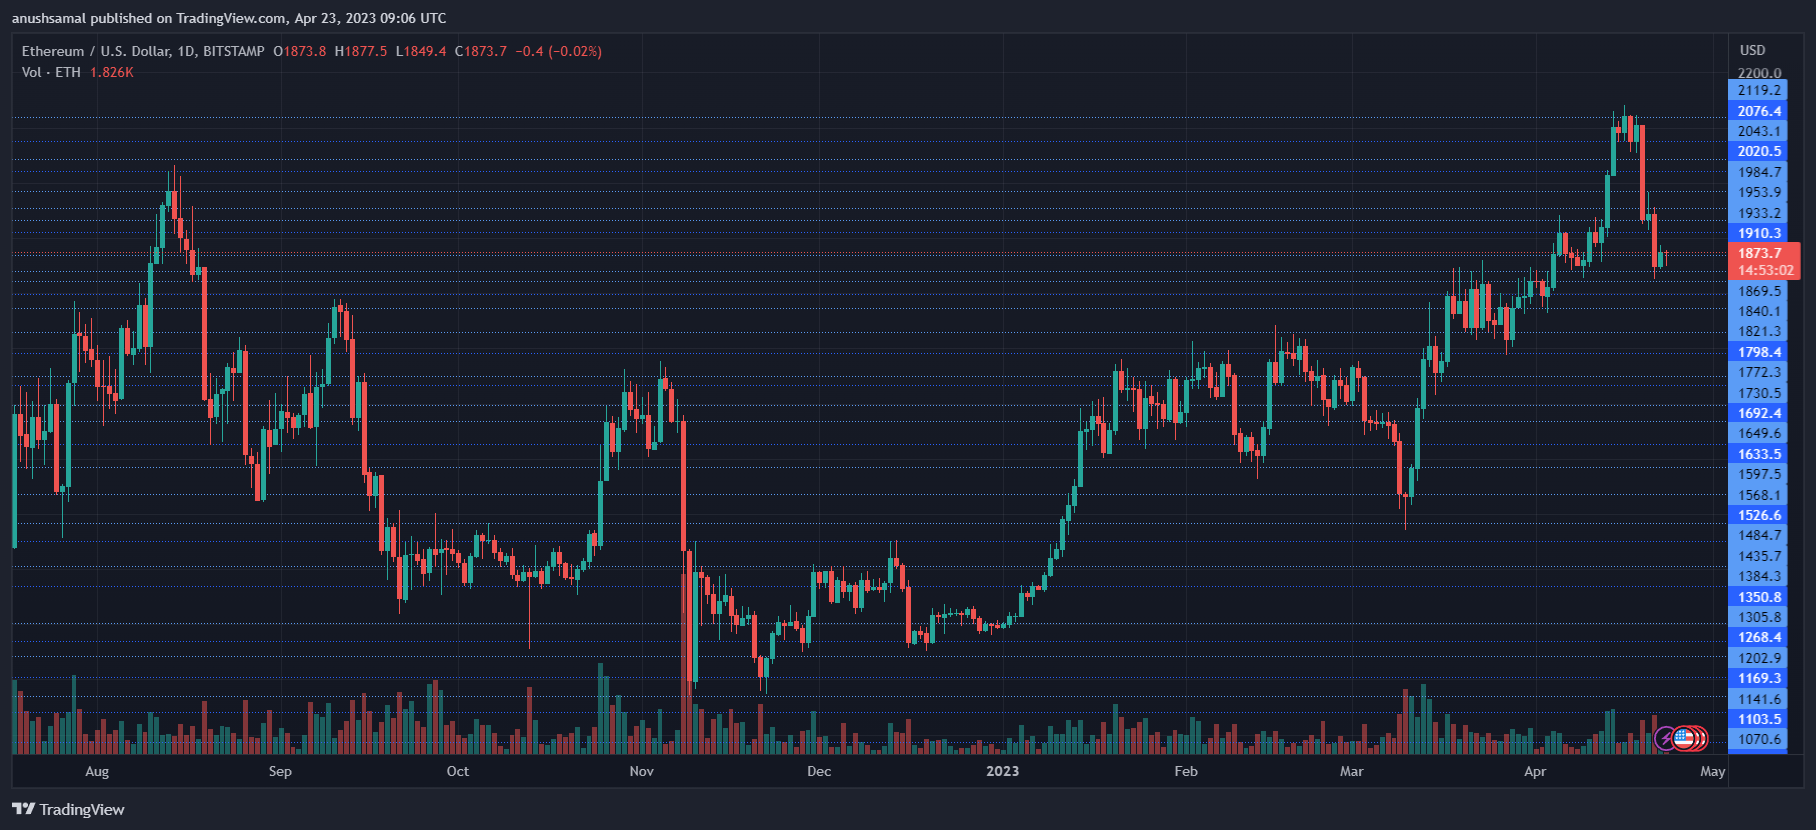
Shiba Inu Price Analysis: One-Day Chart

Shiba Inu

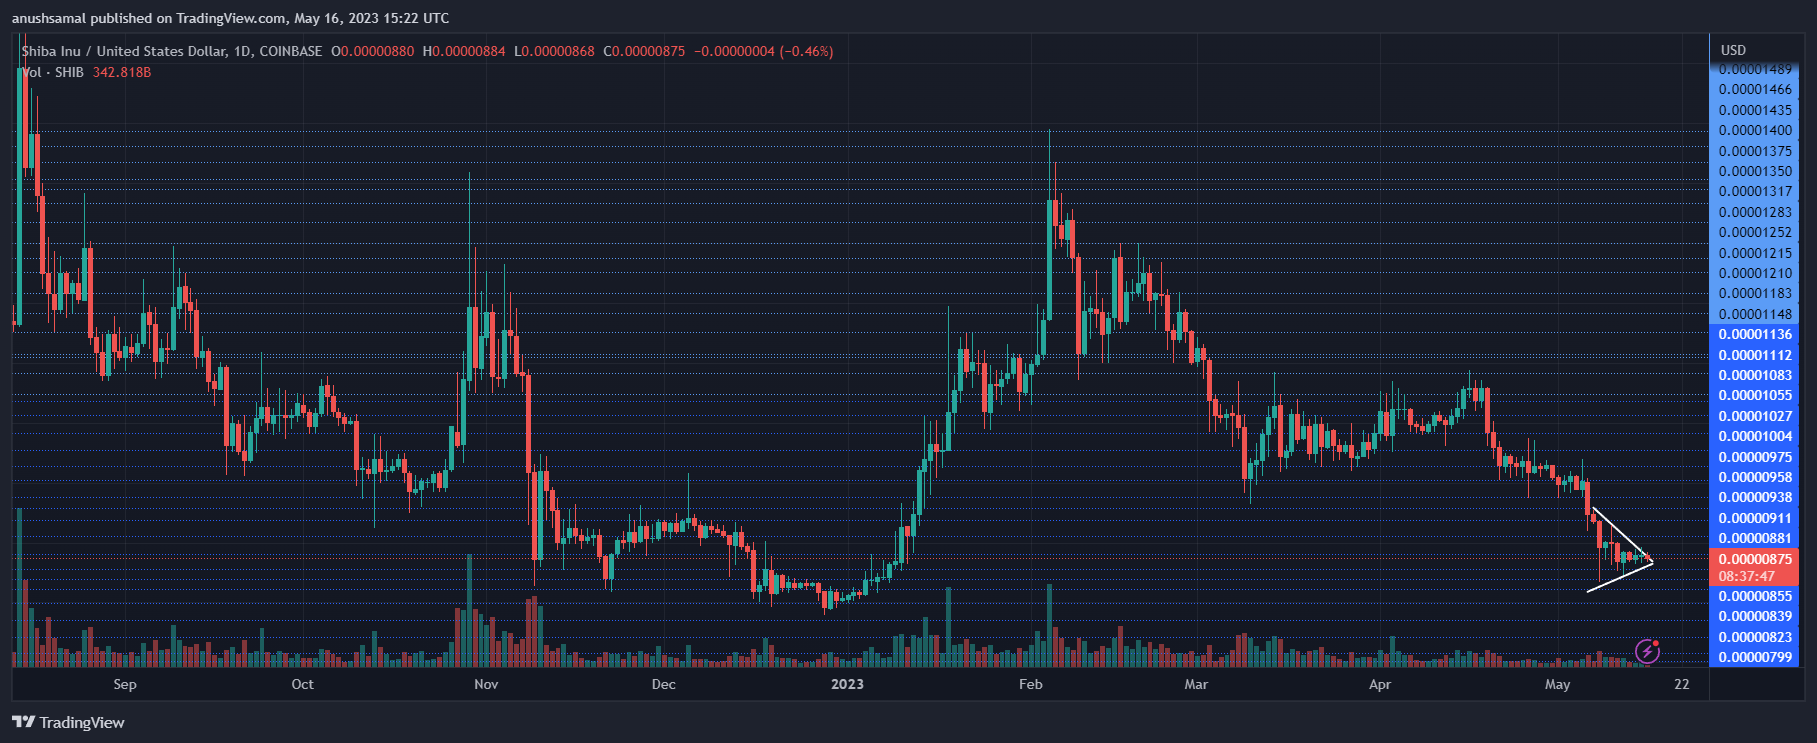
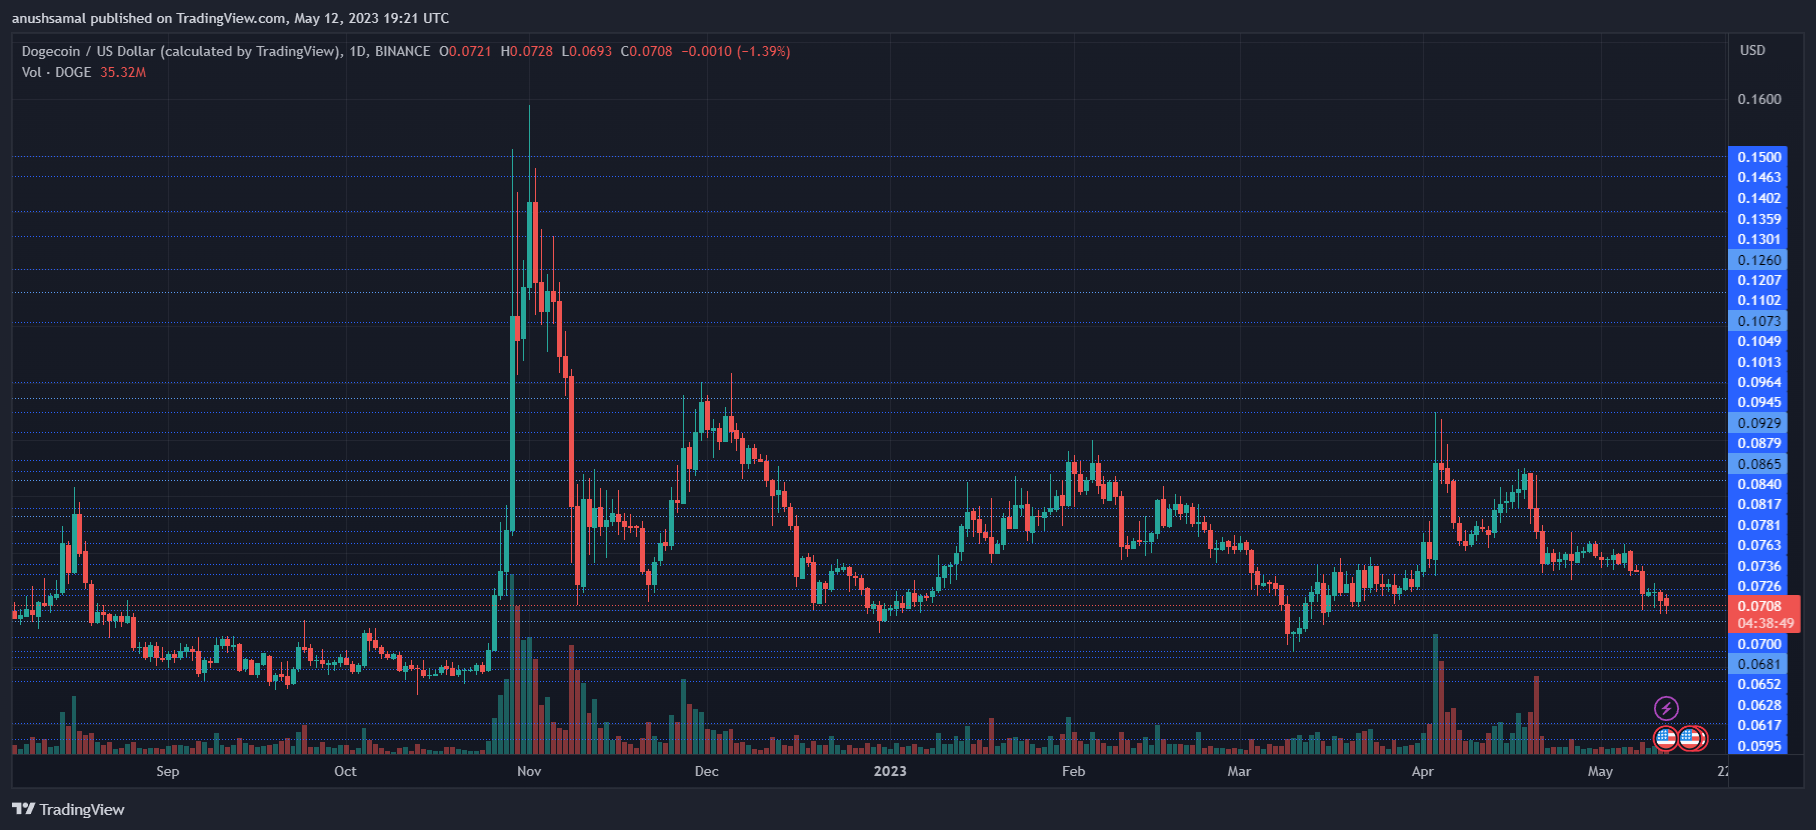
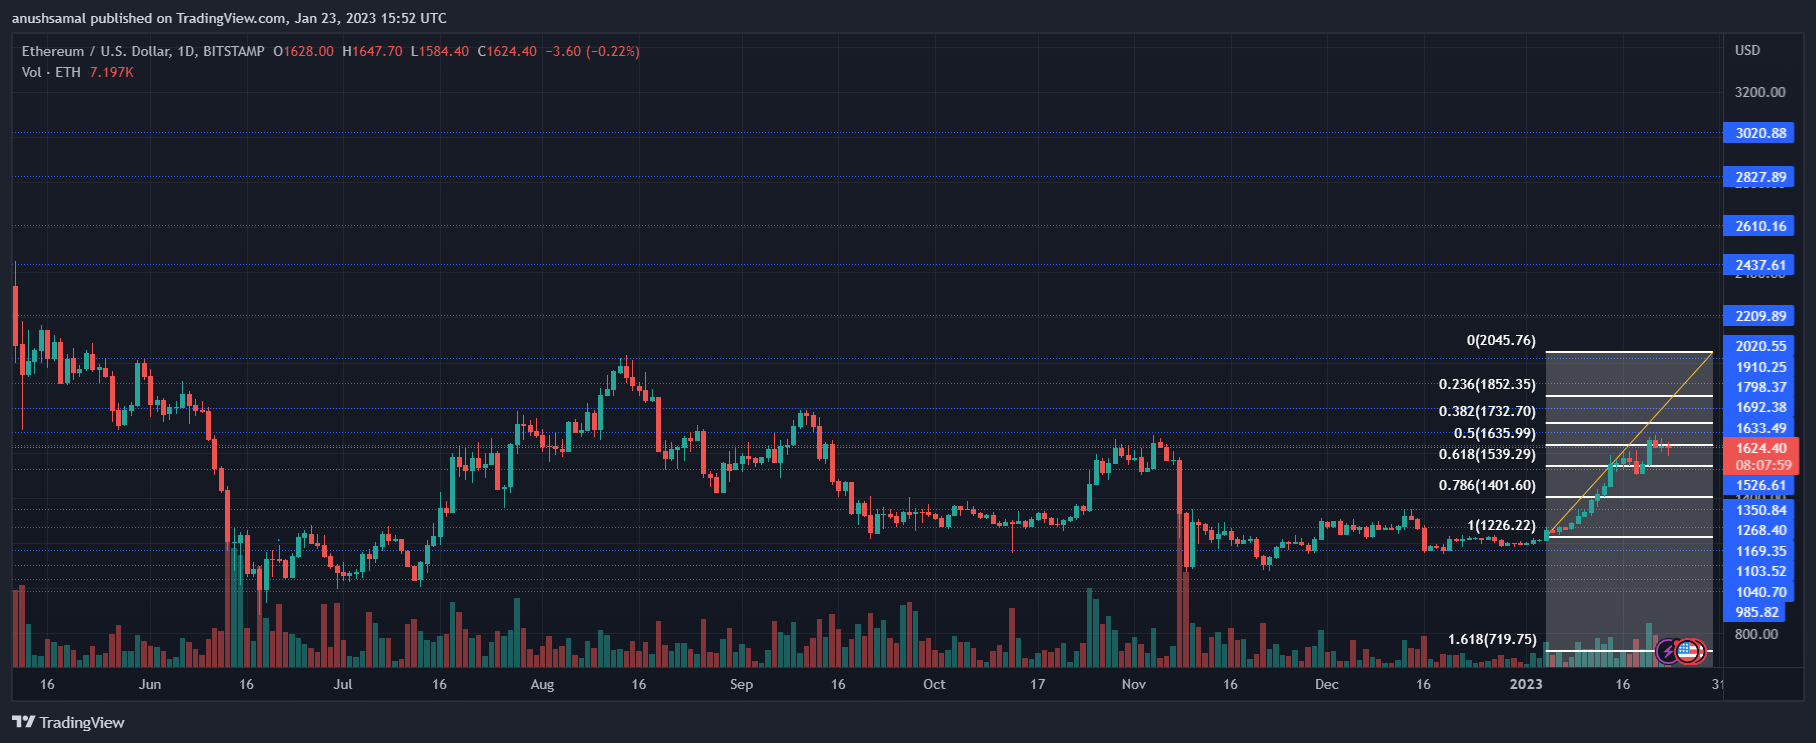
At the time of writing, SHIB was priced at $0.000008, trading near its resistance level of $0.000009. Prior to reaching $0.000009, the coin may face a minor resistance at $0.0000088. A symmetrical triangle pattern has formed for SHIB, indicating a bullish signal.

If SHIB successfully surpasses the $0.0000088 level, it could experience an upward breakout from the triangle, potentially reaching $0.0000096. This would result in a significant rally of over 10% for the coin.

Conversely, a decline from the current price would push SHIB down to $0.0000084, leading to a considerable loss. The recent session showed a decrease in trading volume for SHIB, indicating low buying strength.
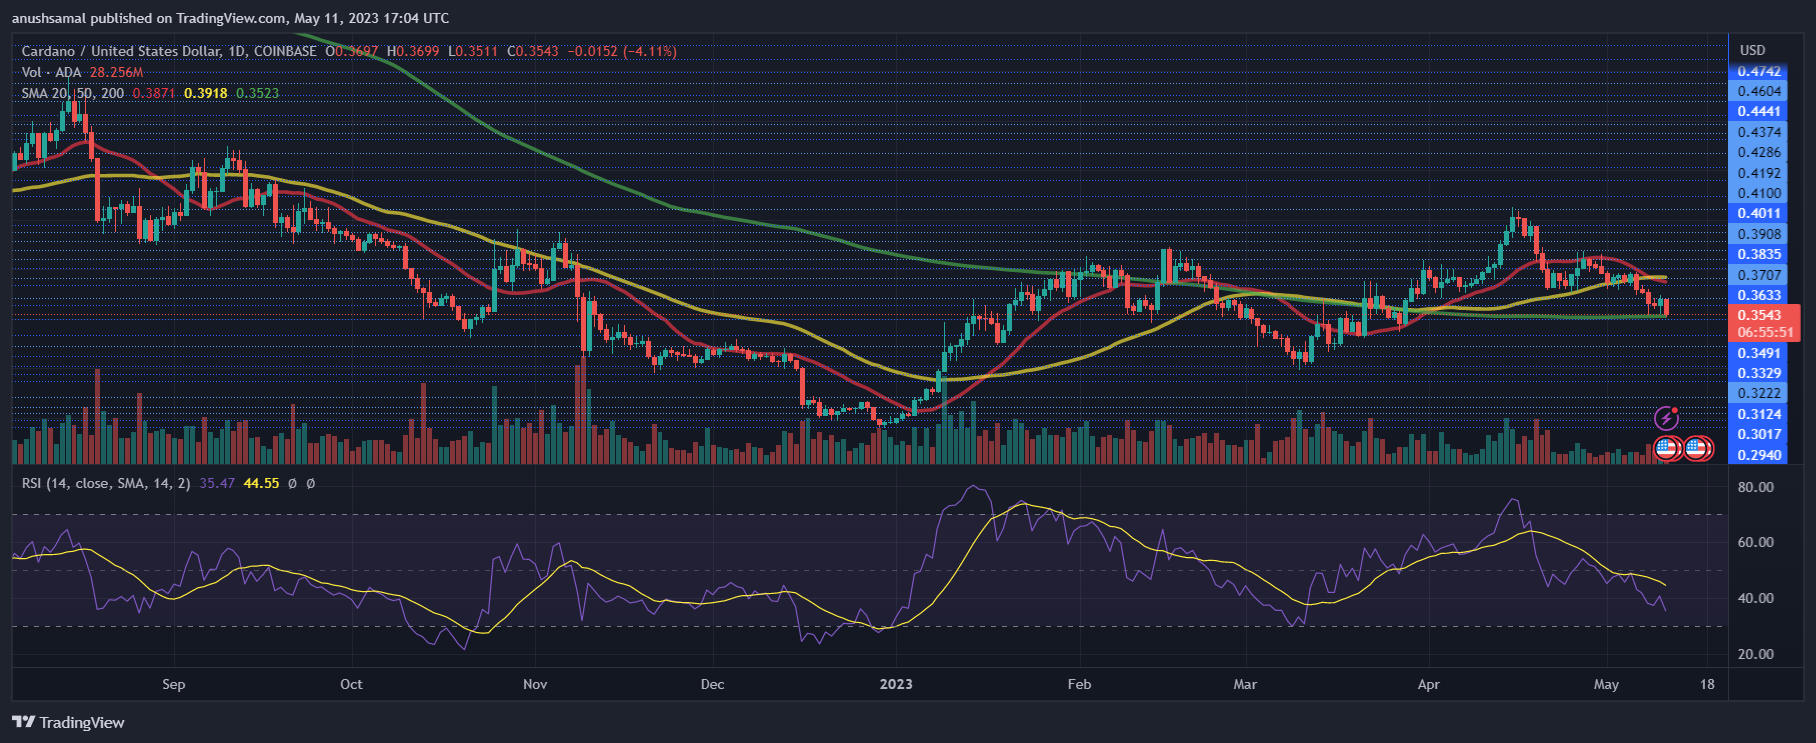
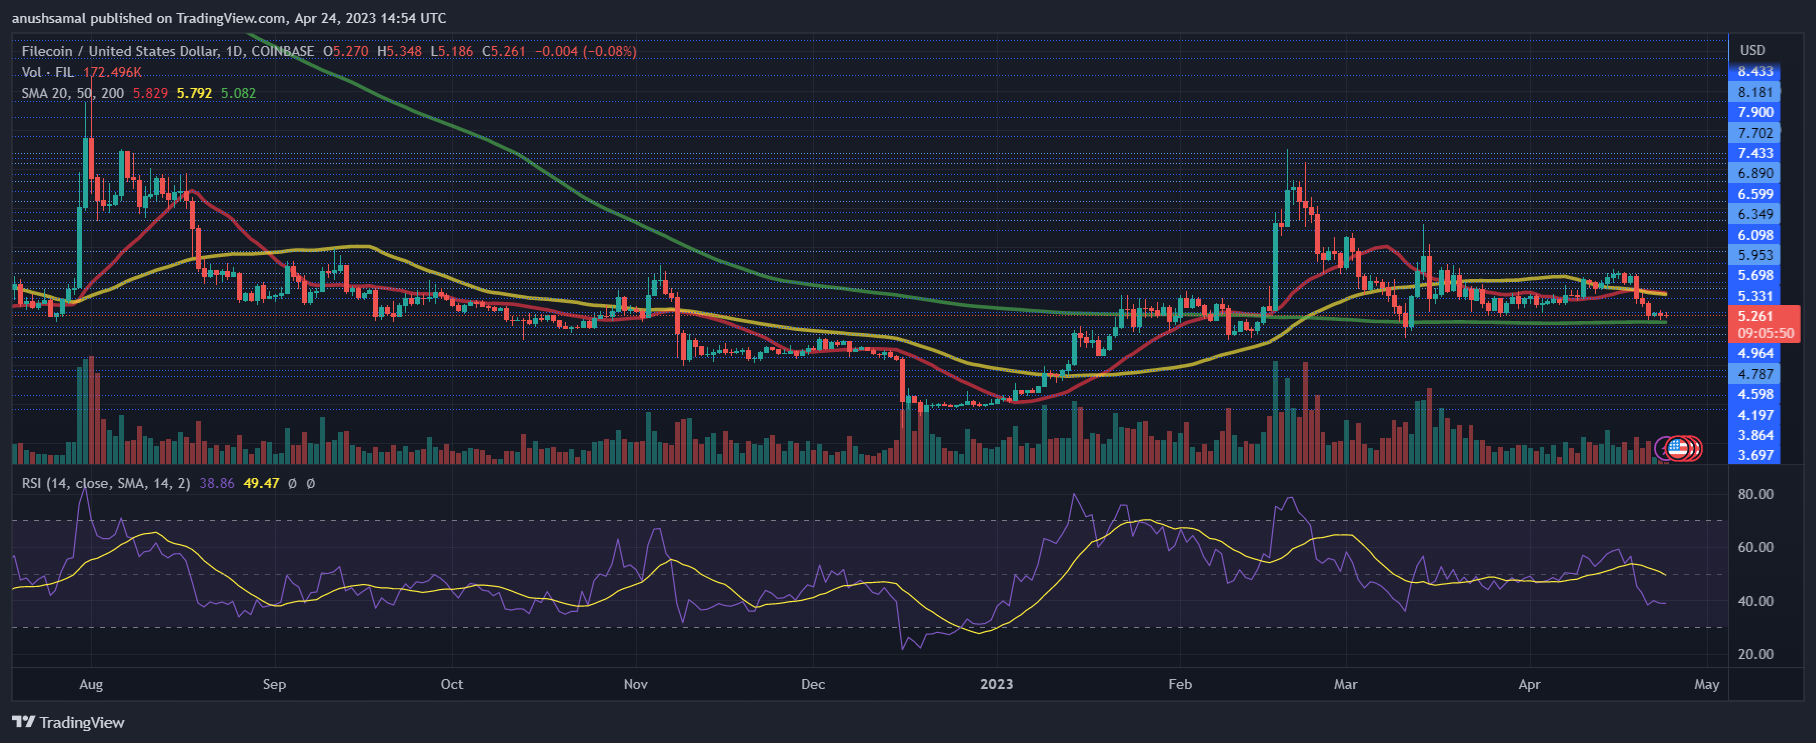
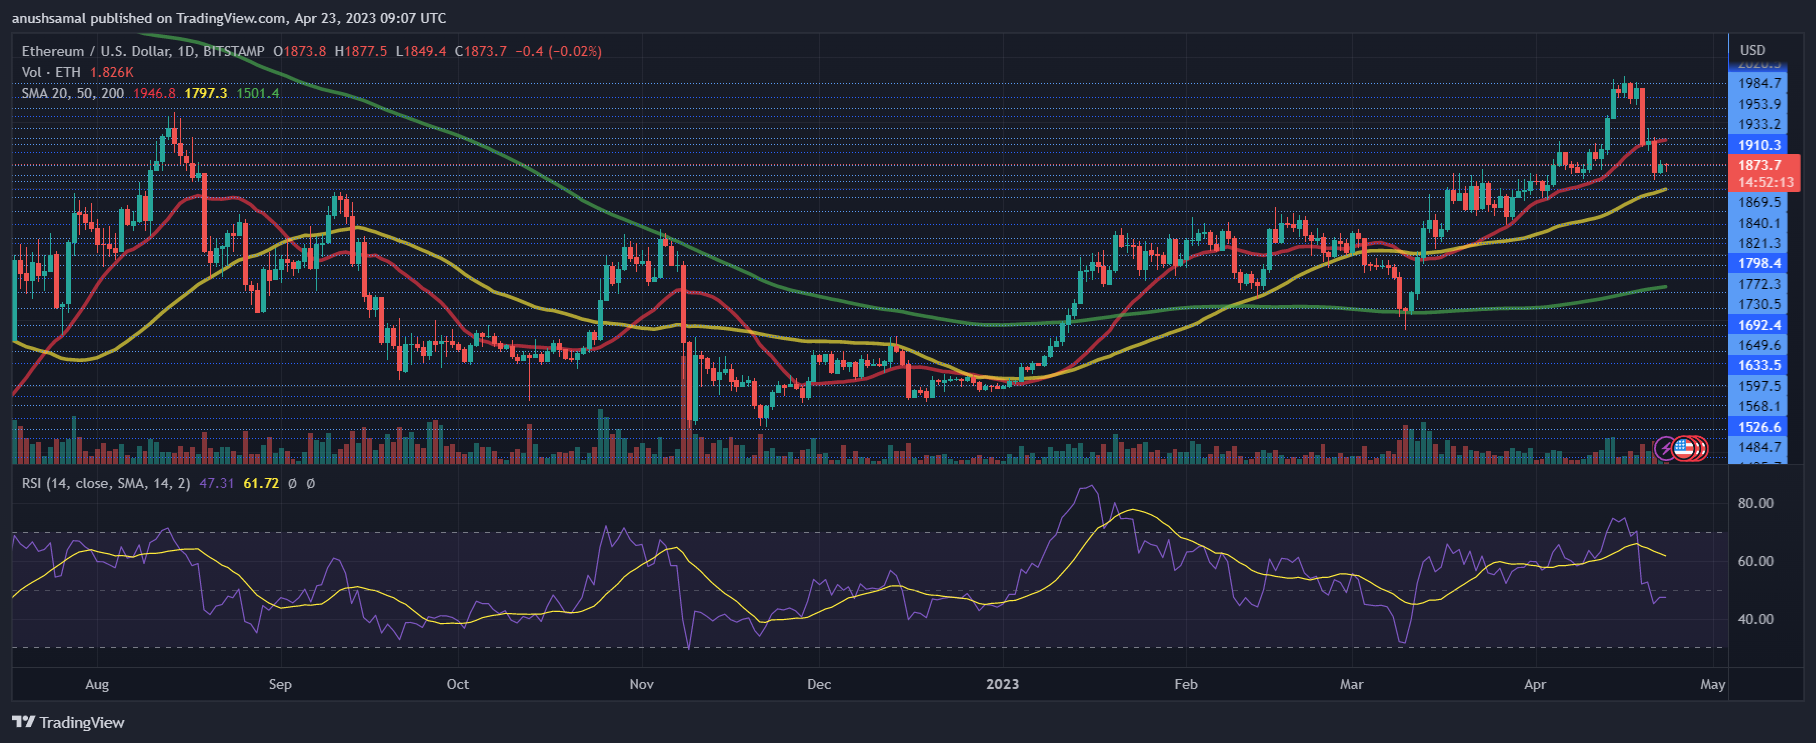
Technical Analysis

Shiba Inu

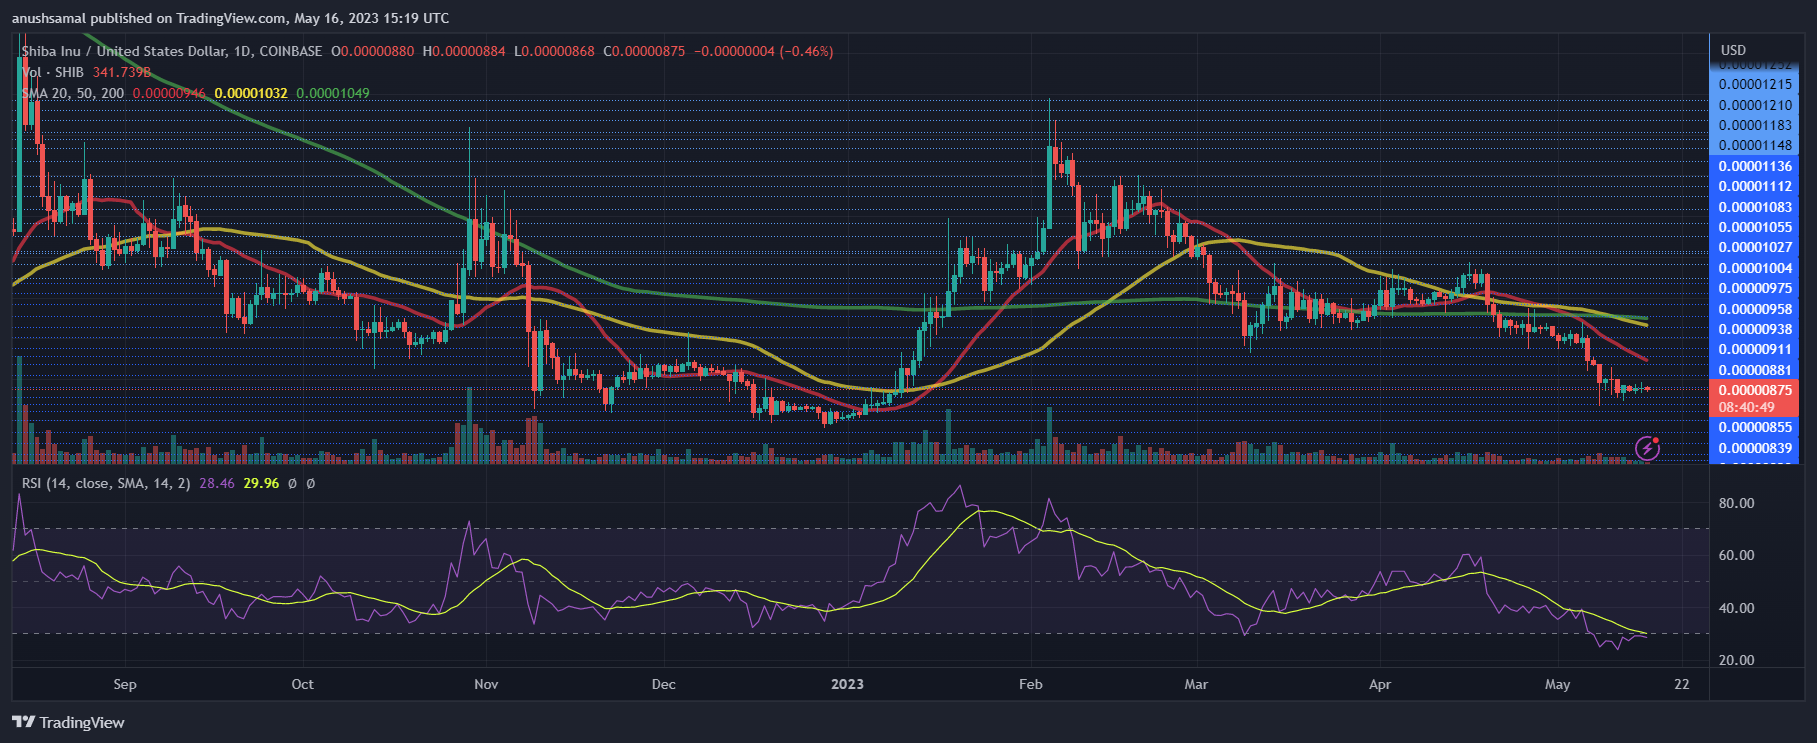
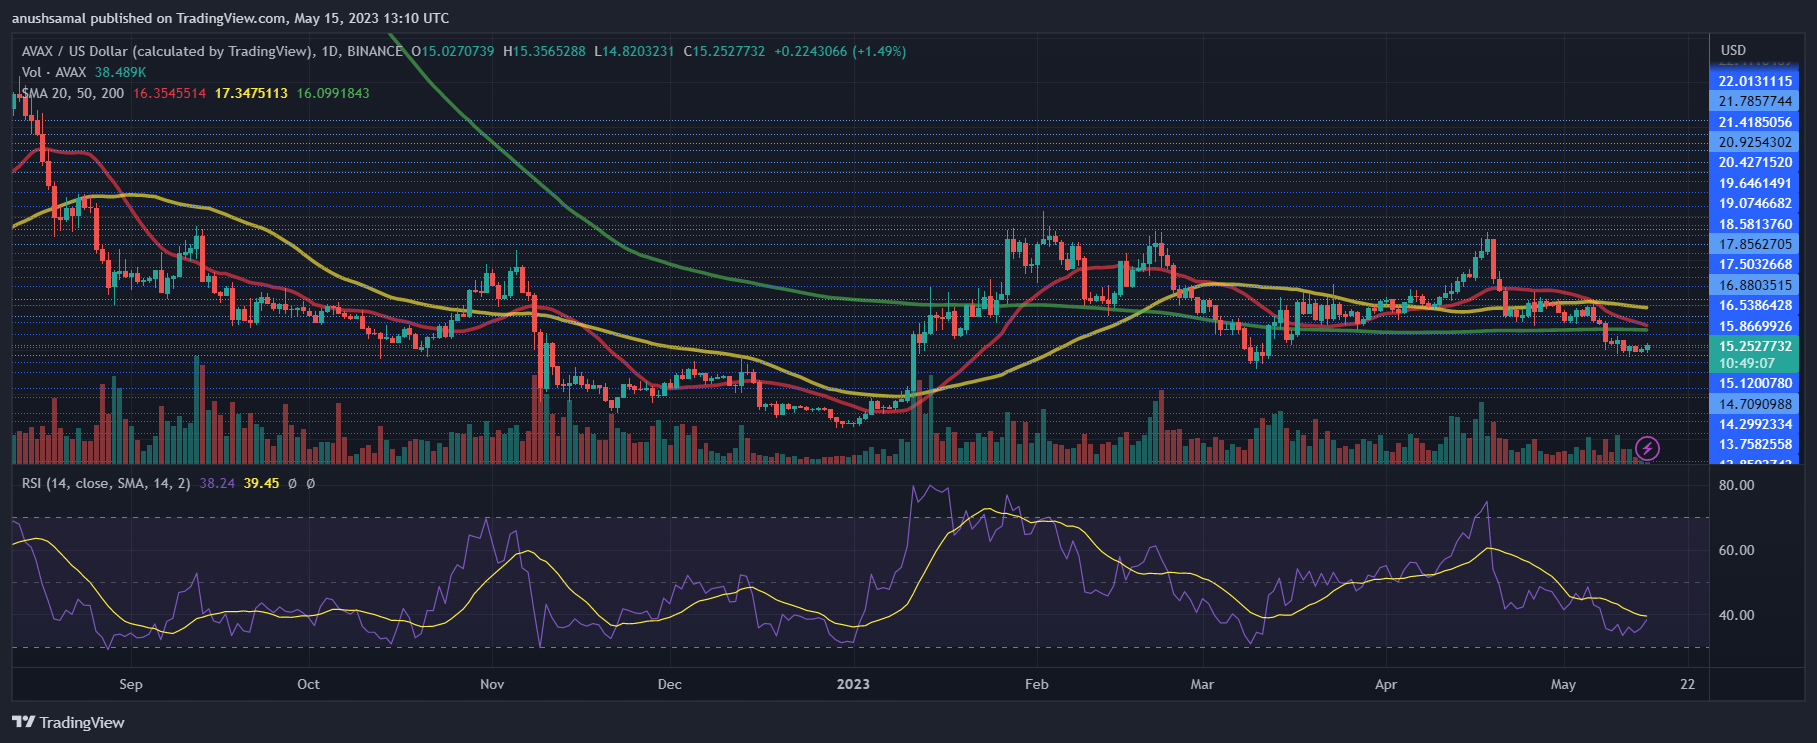
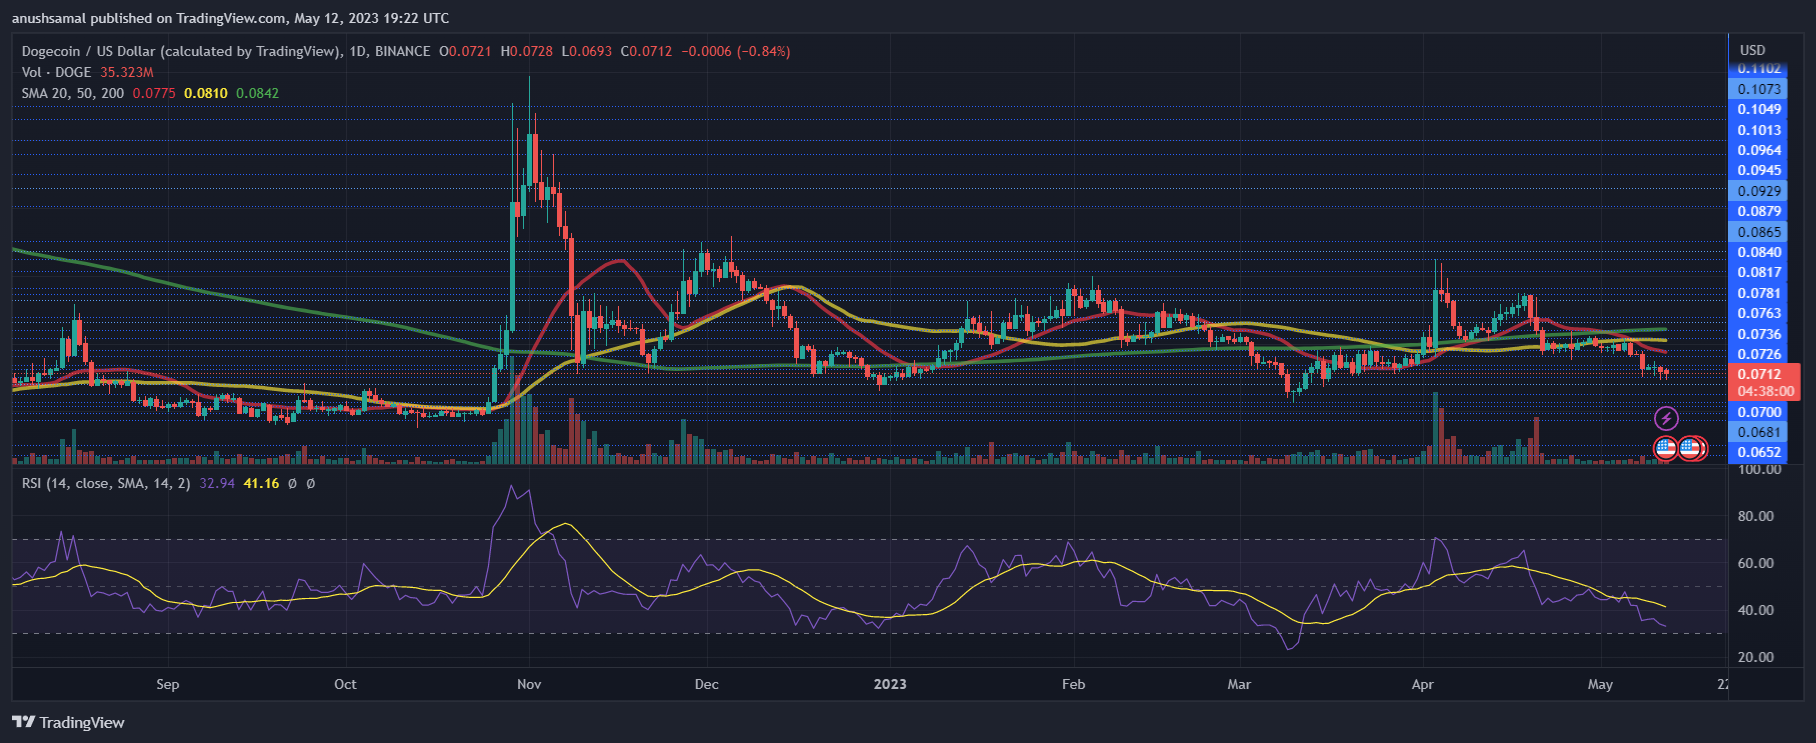
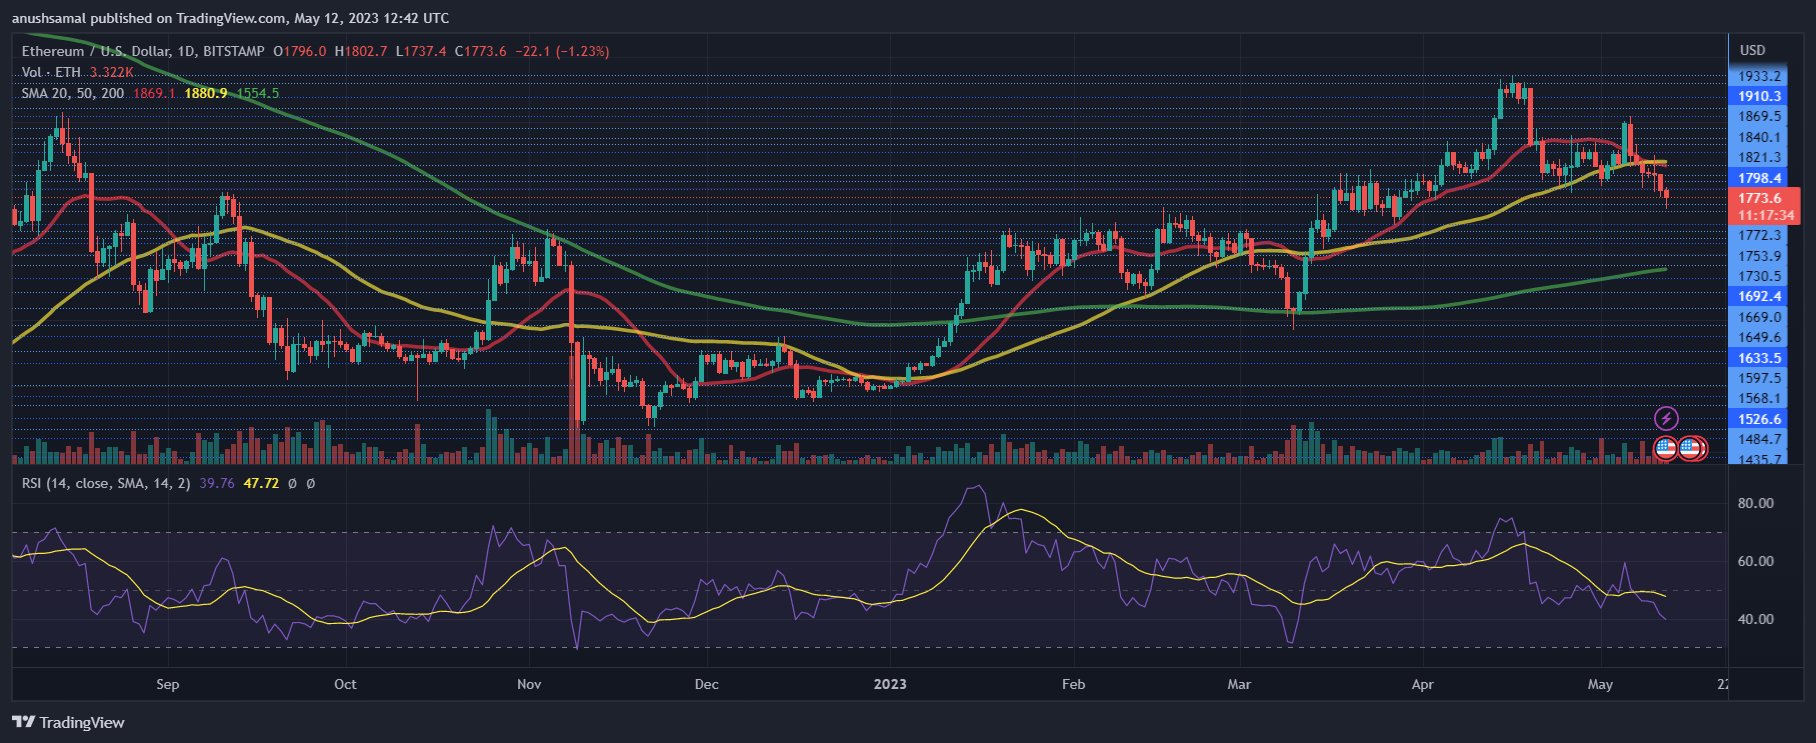
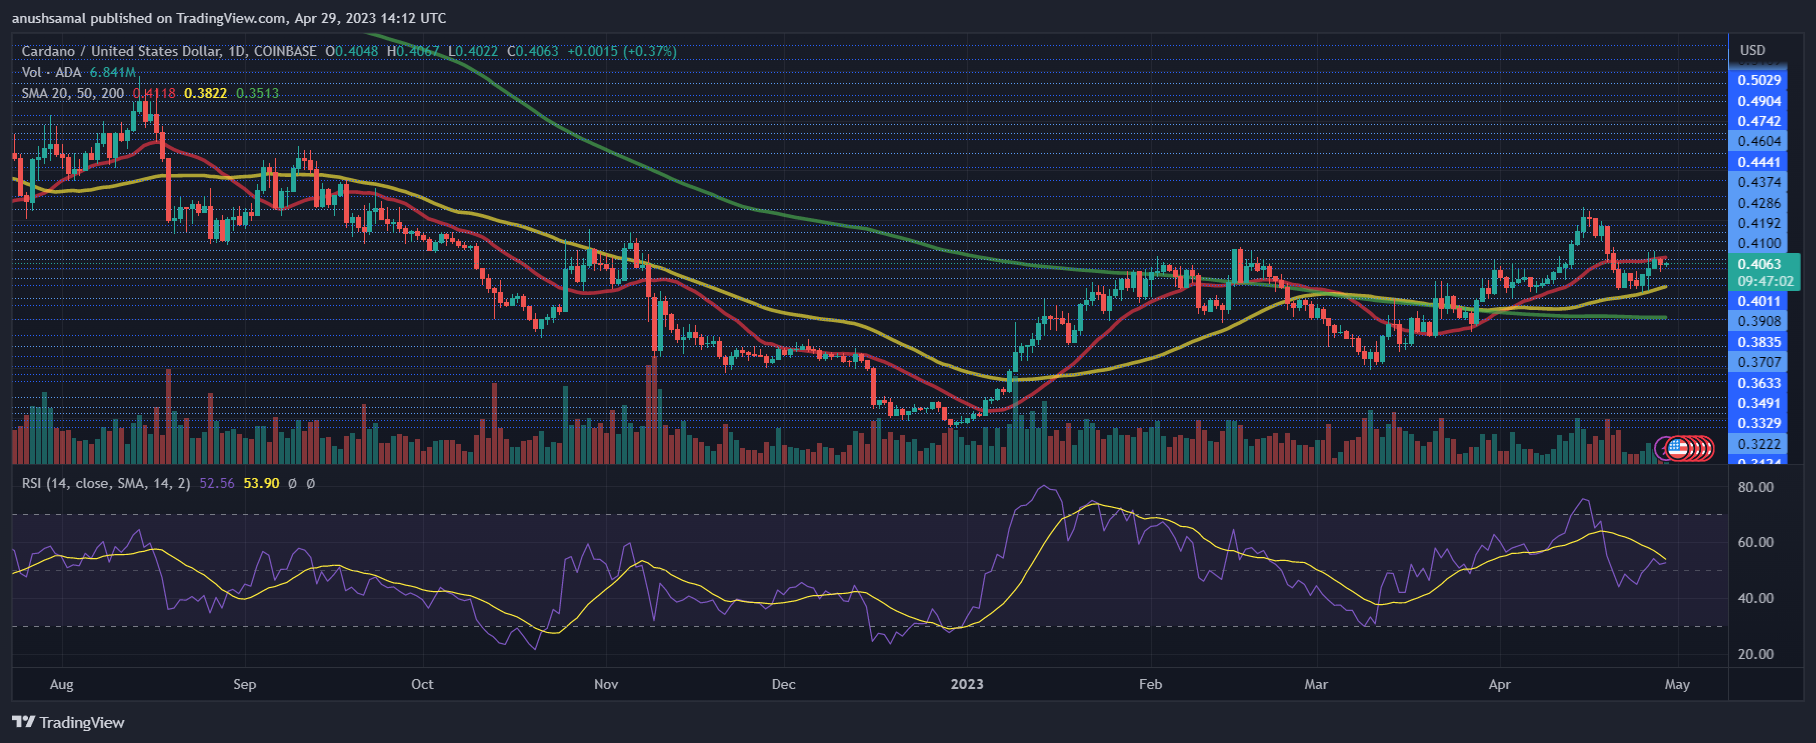
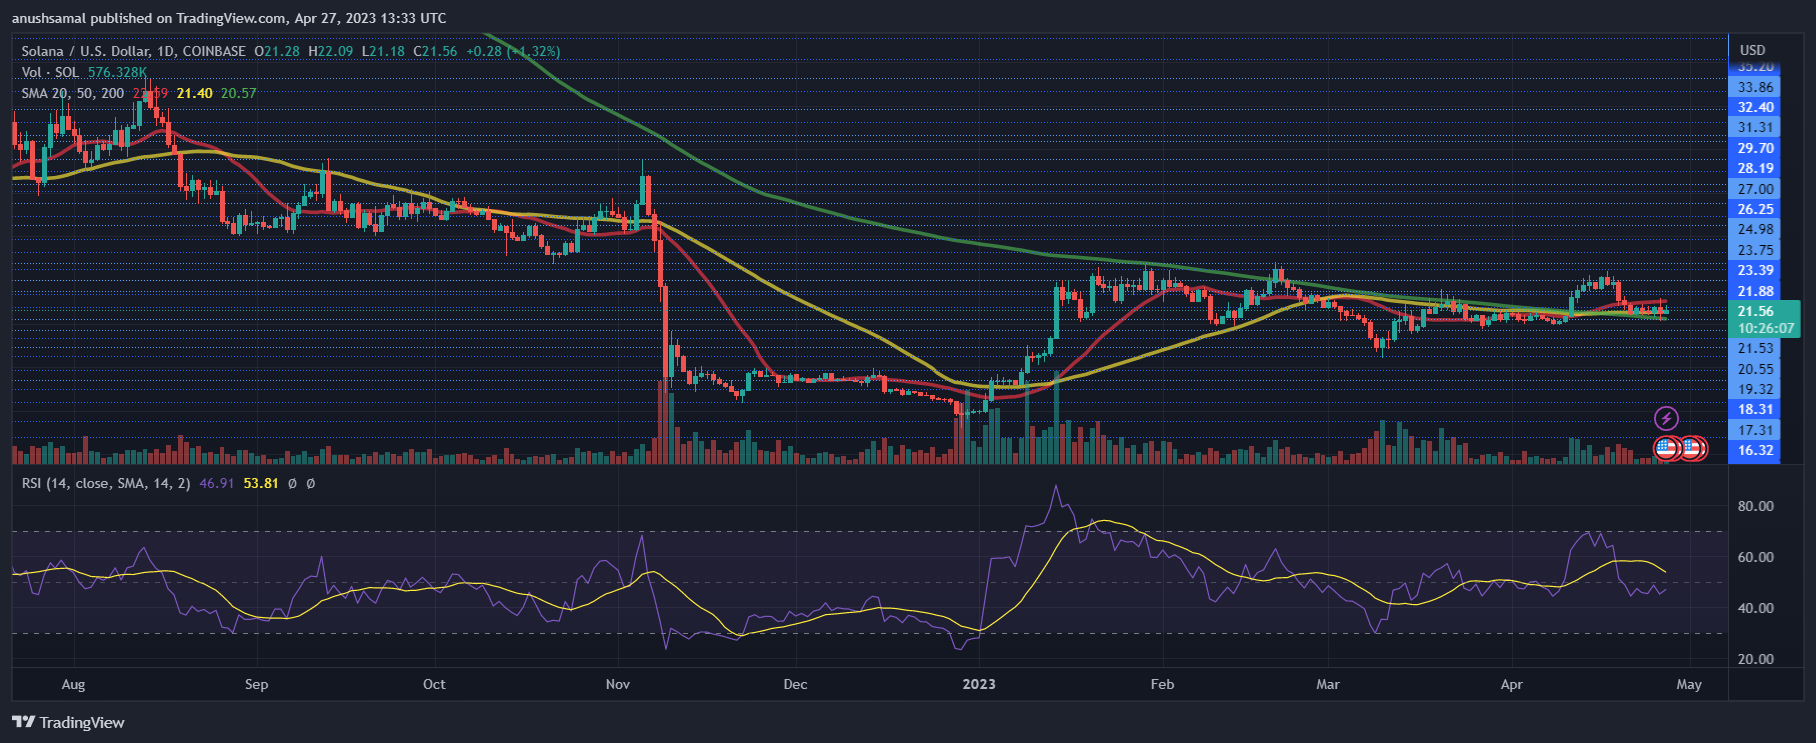
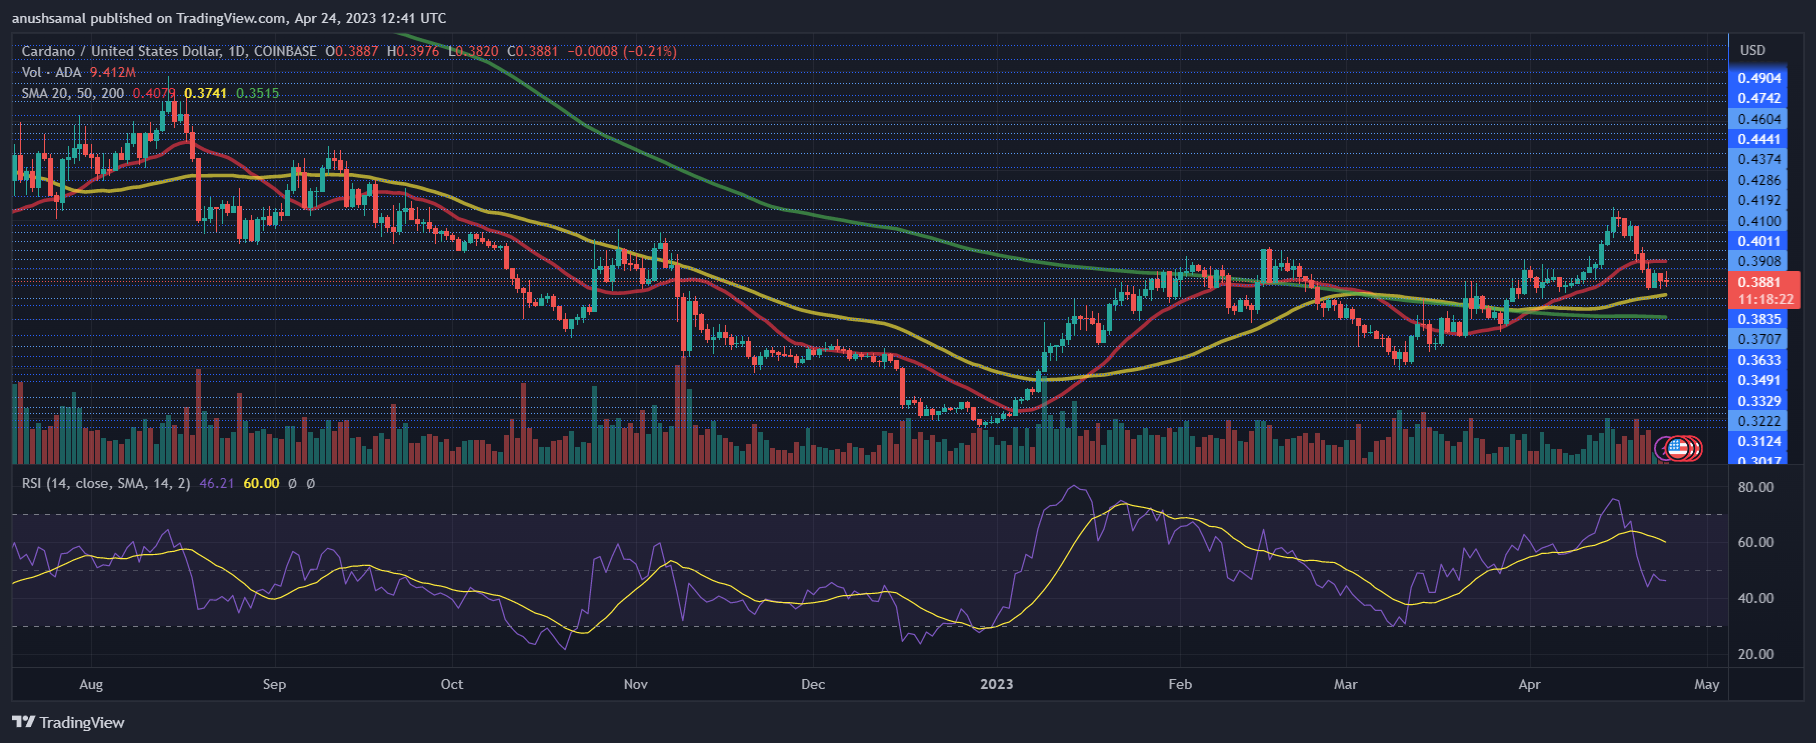
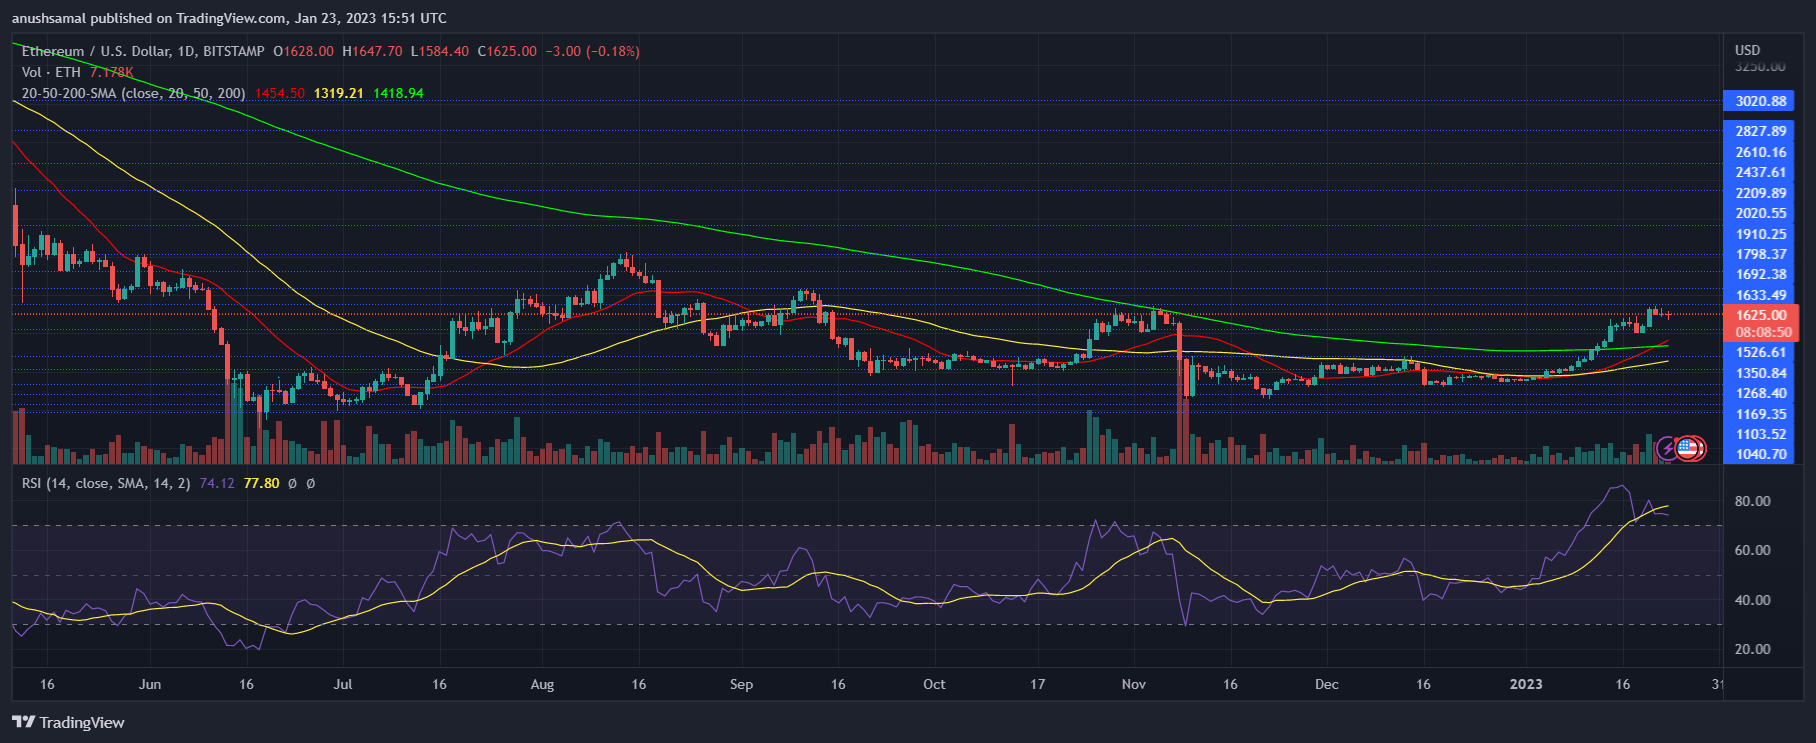
Throughout most of this month, SHIB has experienced increased selling pressure. The Relative Strength Index (RSI) dropped below the 20-mark, indicating an oversold condition due to a significant decrease in demand.

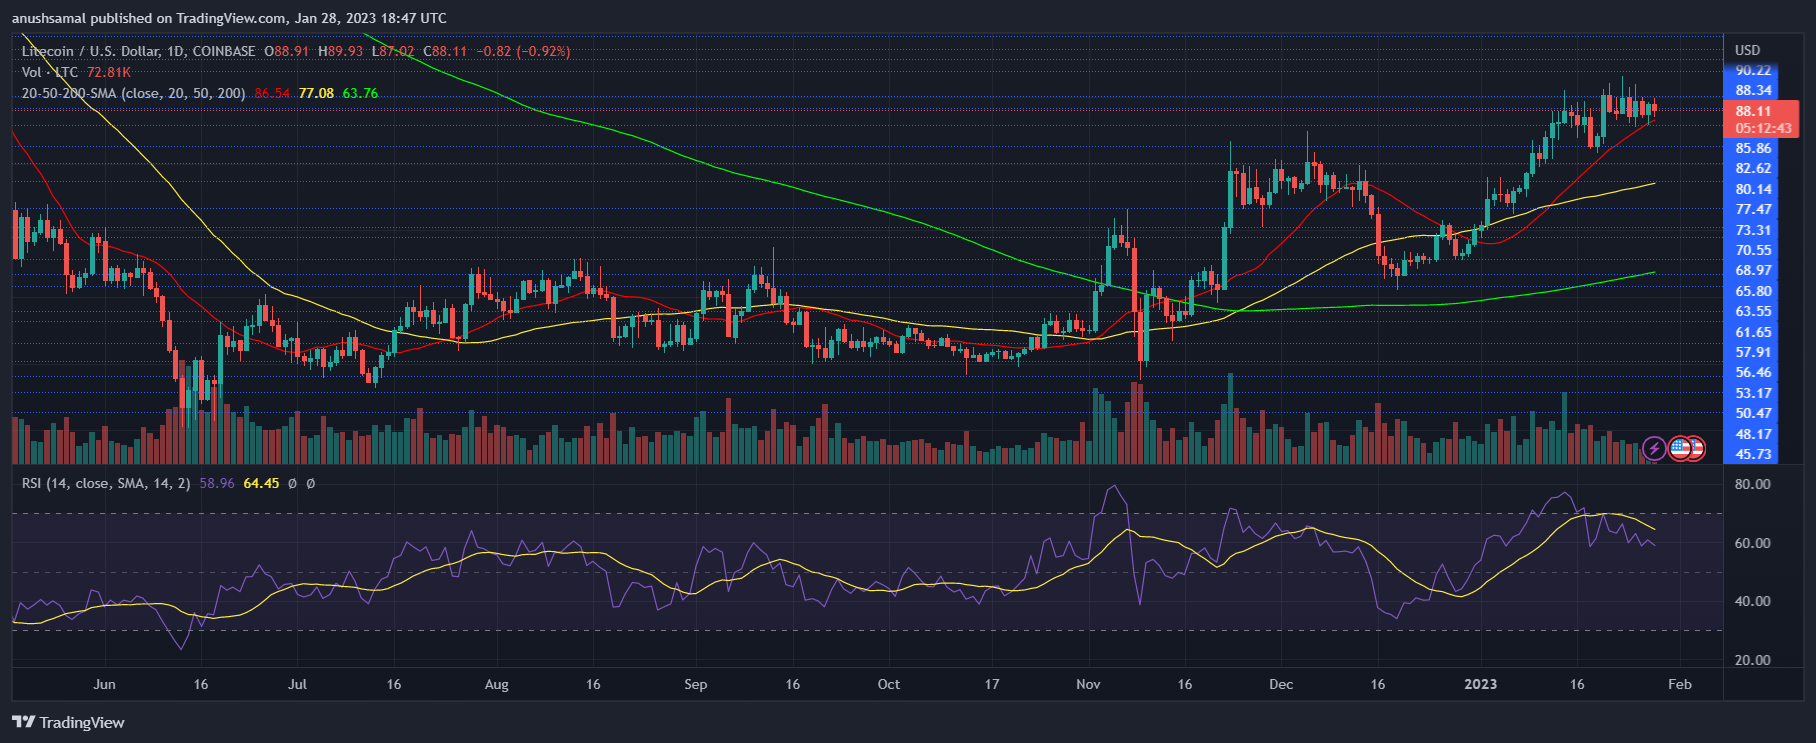
If SHIB manages to surpass immediate resistance levels, buyers may reenter the market. Similarly, the coin’s price fell below the 20-Simple Moving Average (SMA) line, suggesting that sellers were driving the market’s momentum.

Furthermore, a bearish signal was observed as the 200-SMA (green) crossed over the 50-SMA (yellow), forming a death cross pattern. A death cross typically signifies a downward price movement.

Shiba Inu

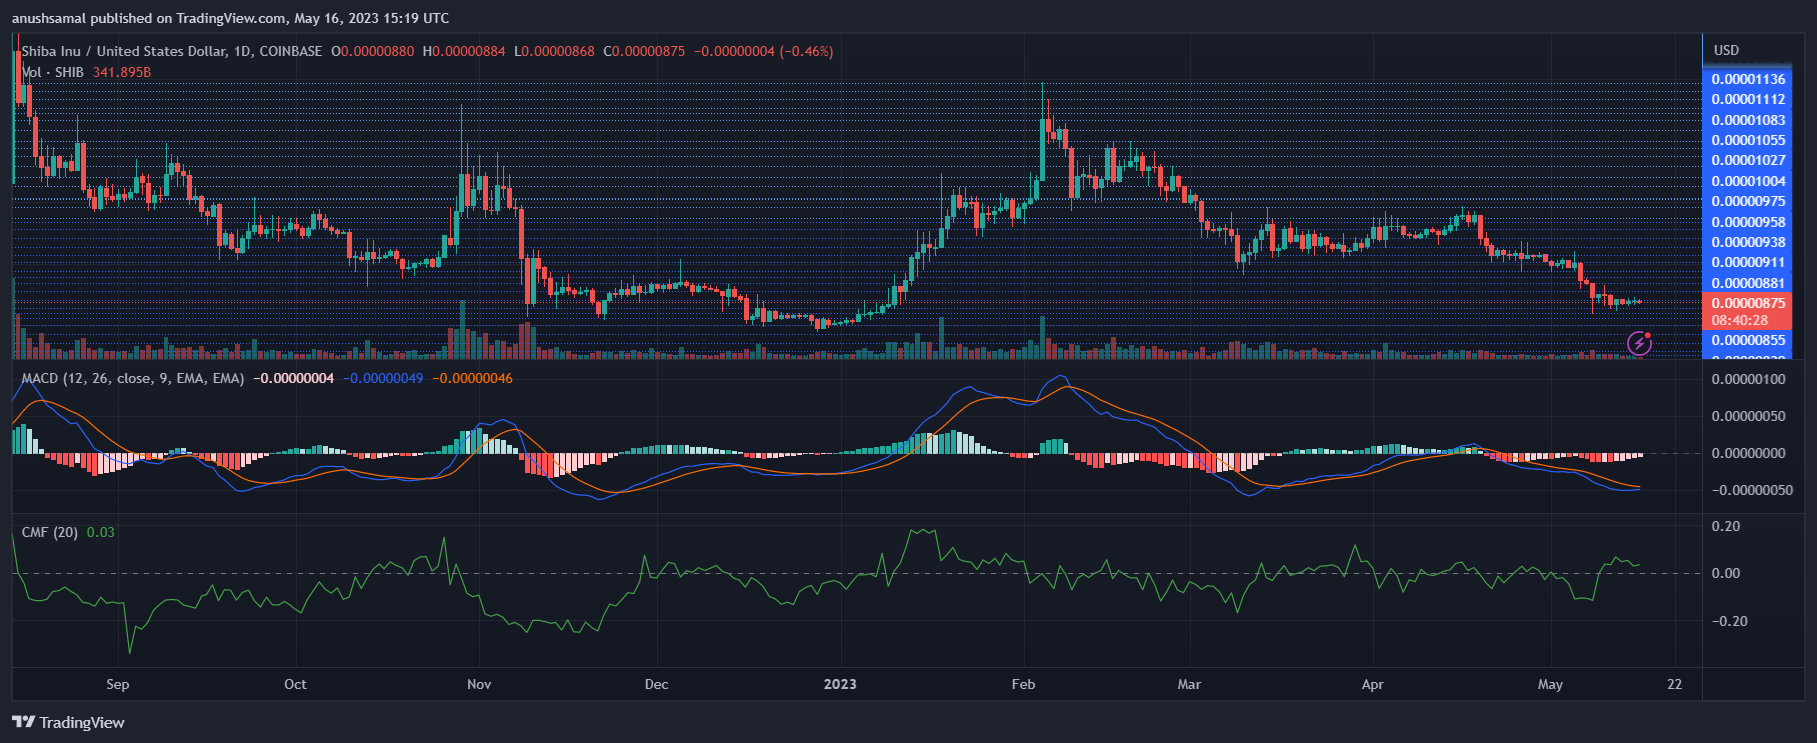
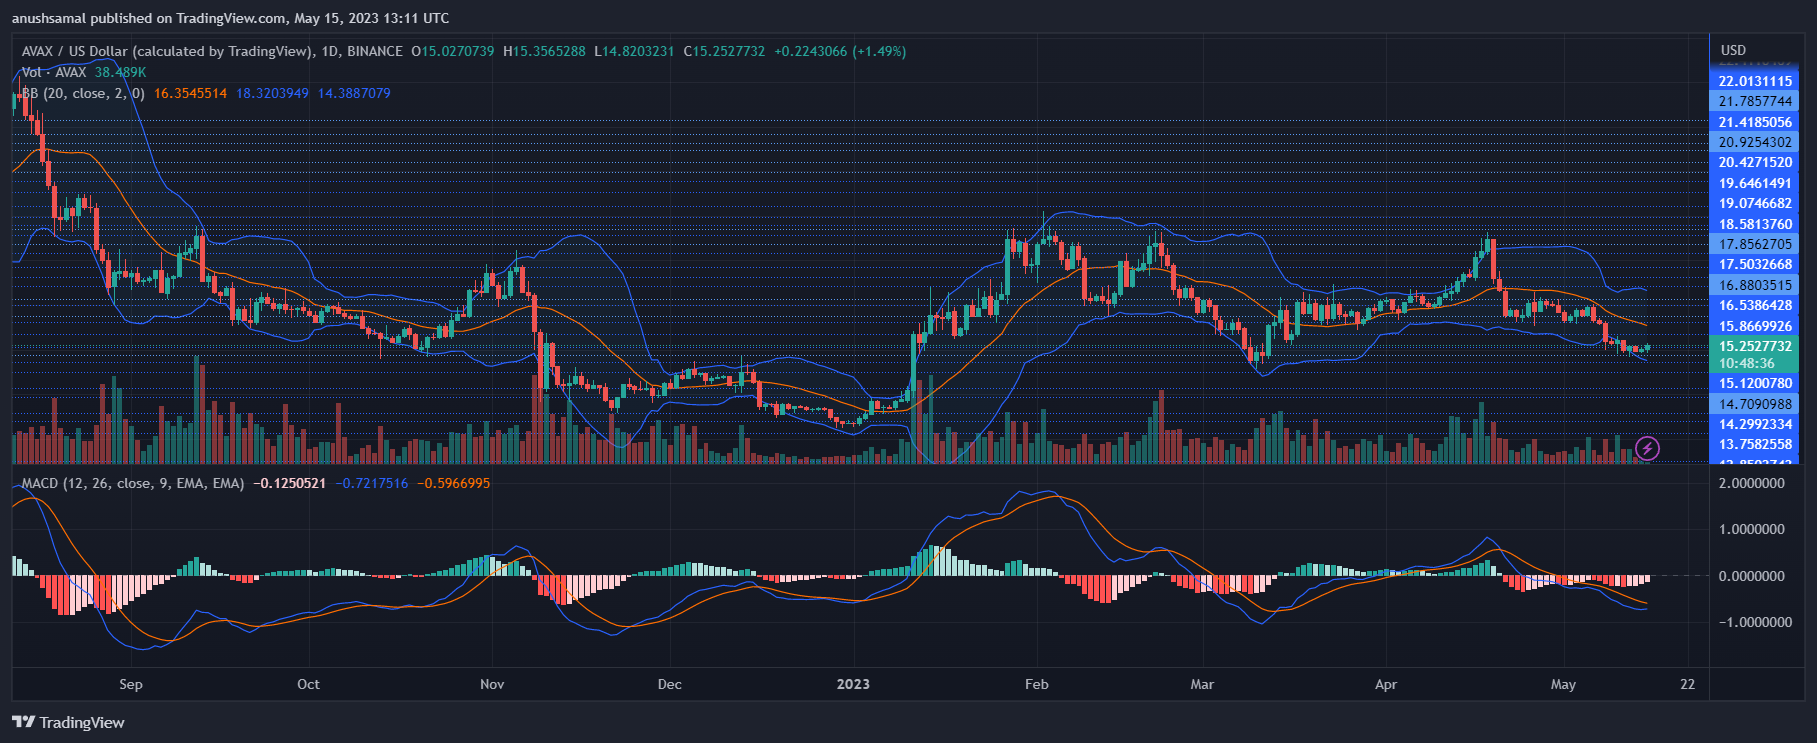
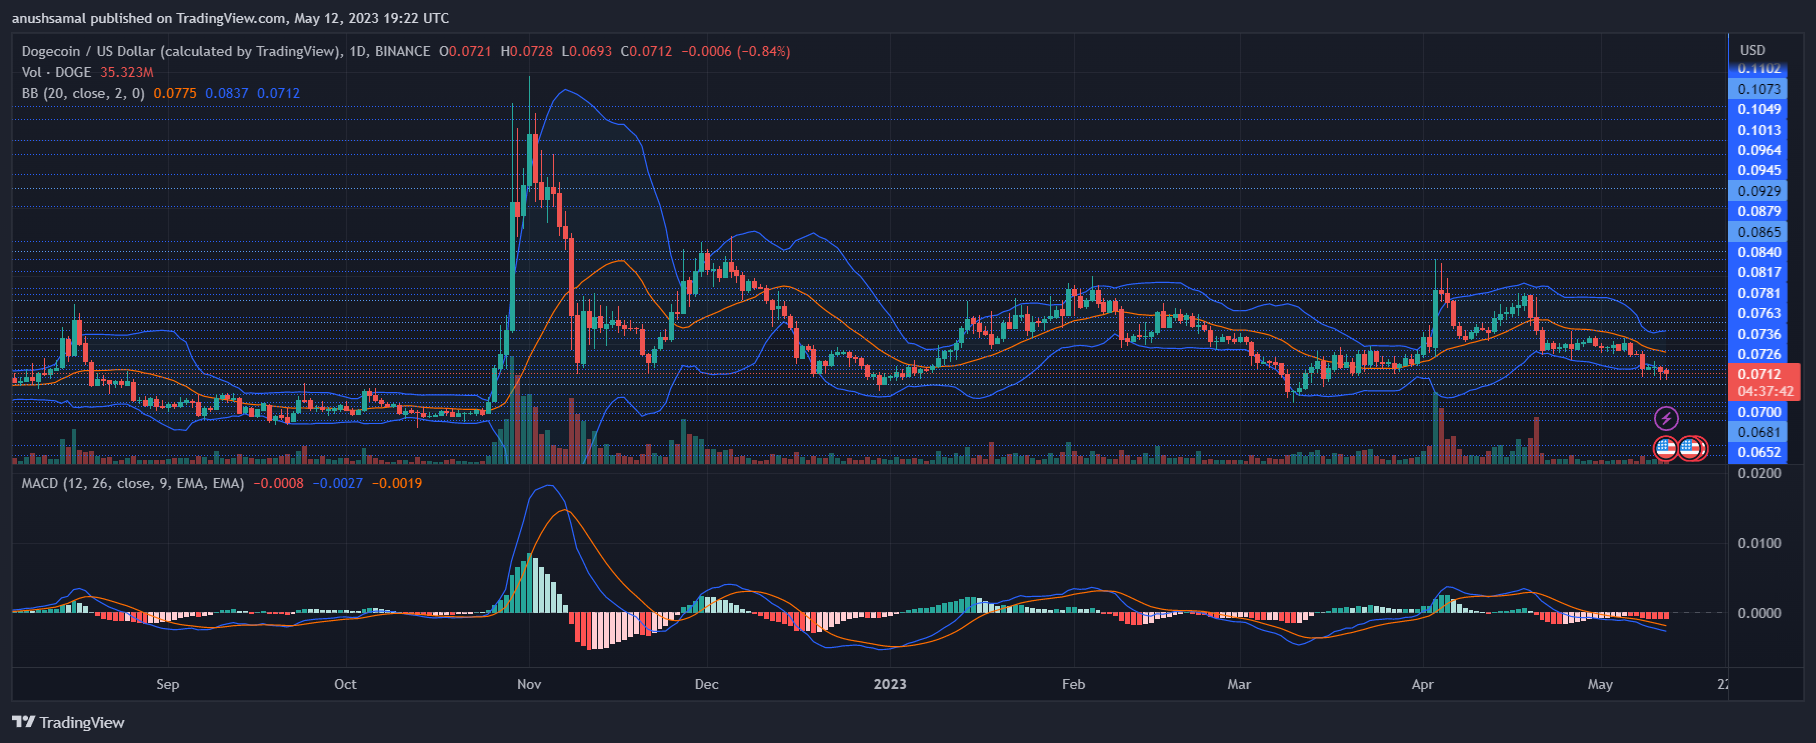
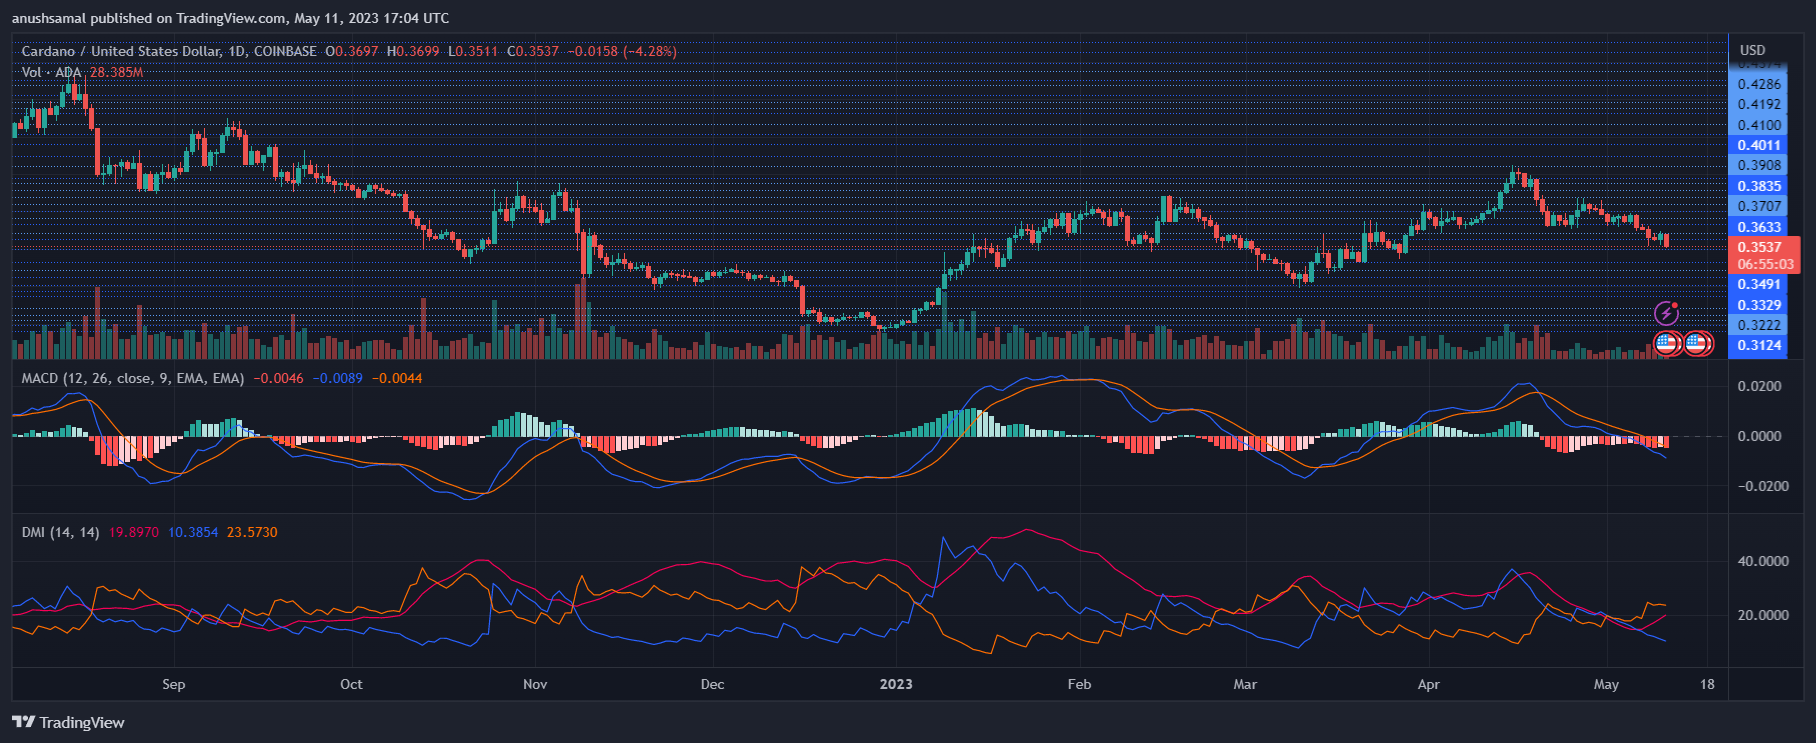
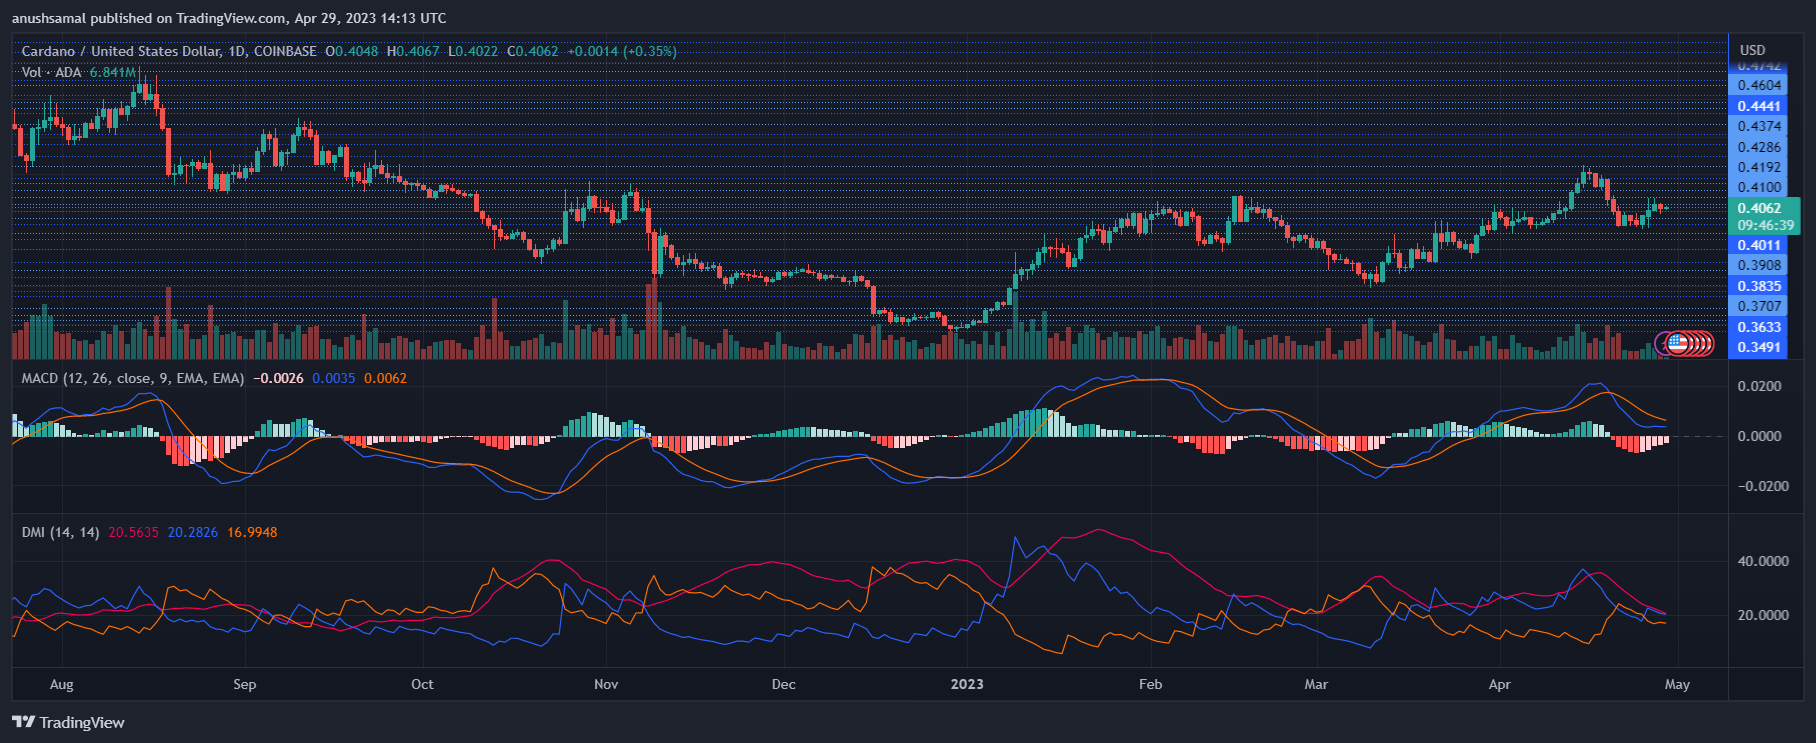
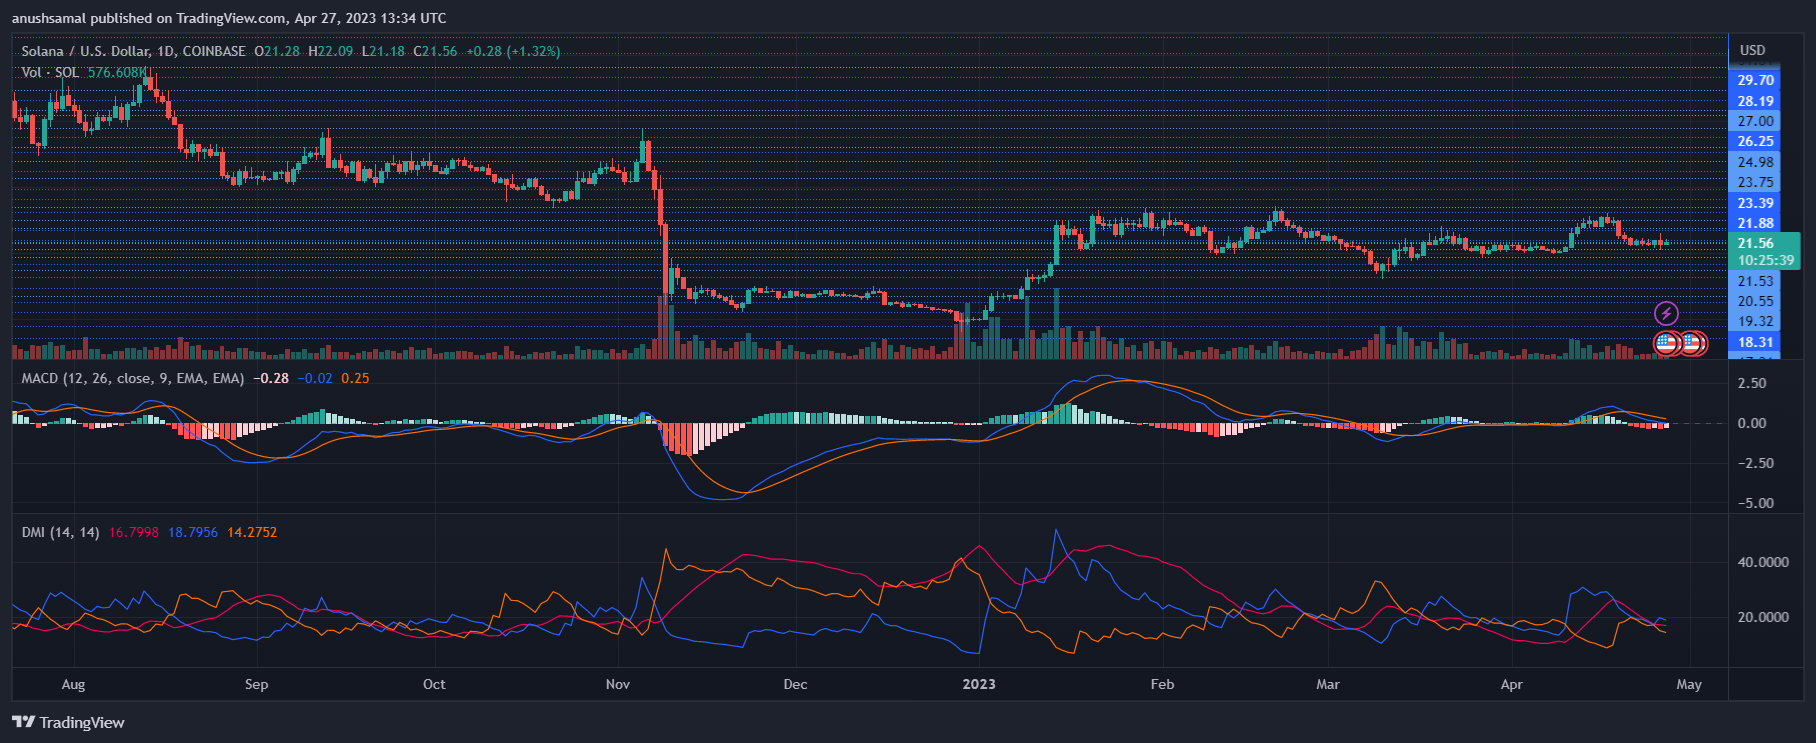
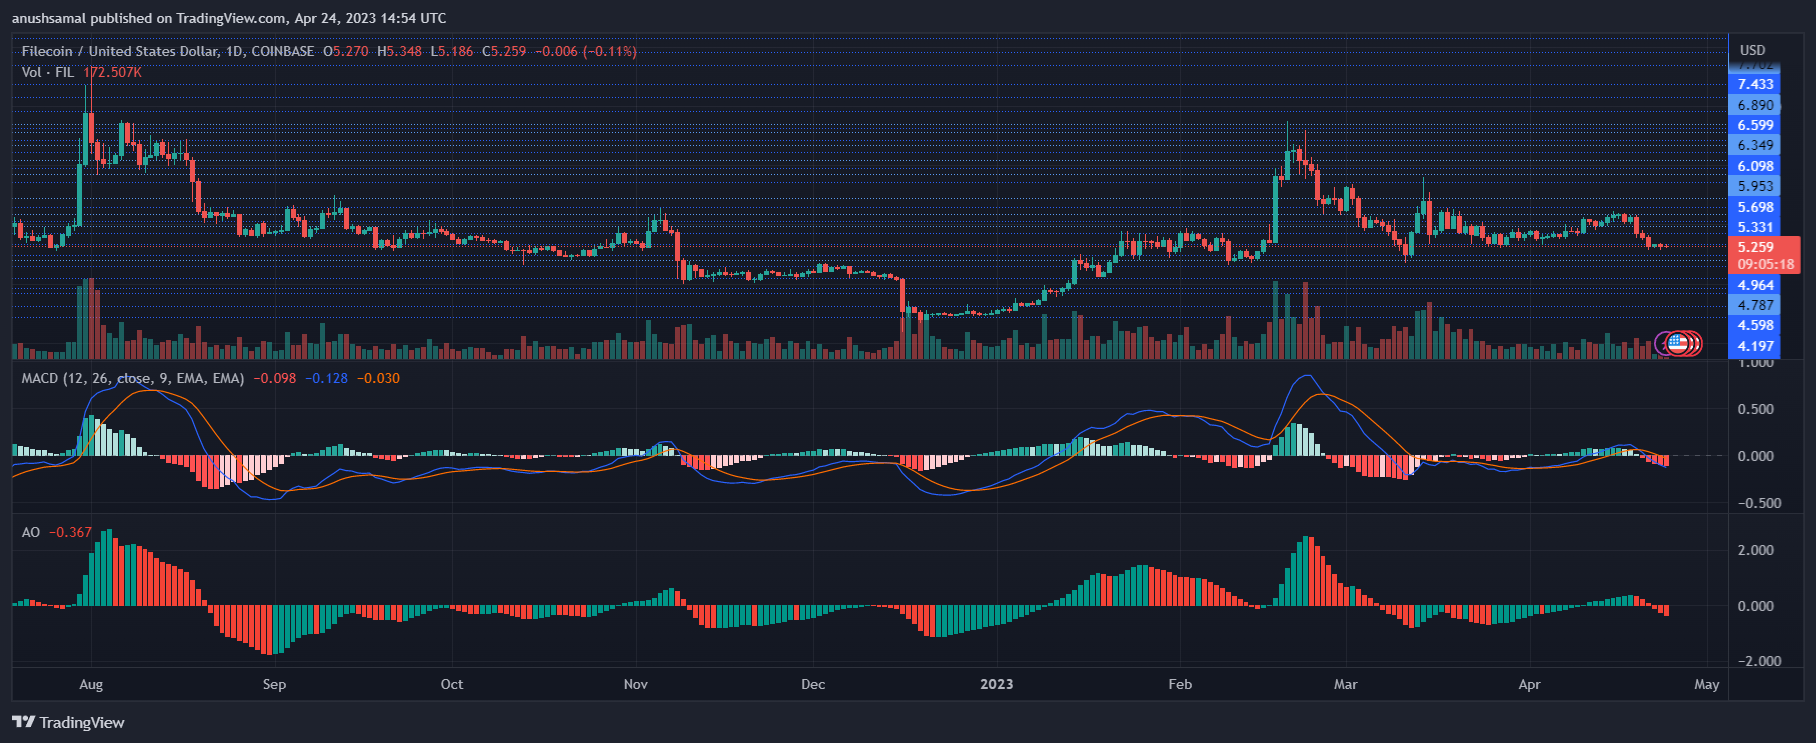
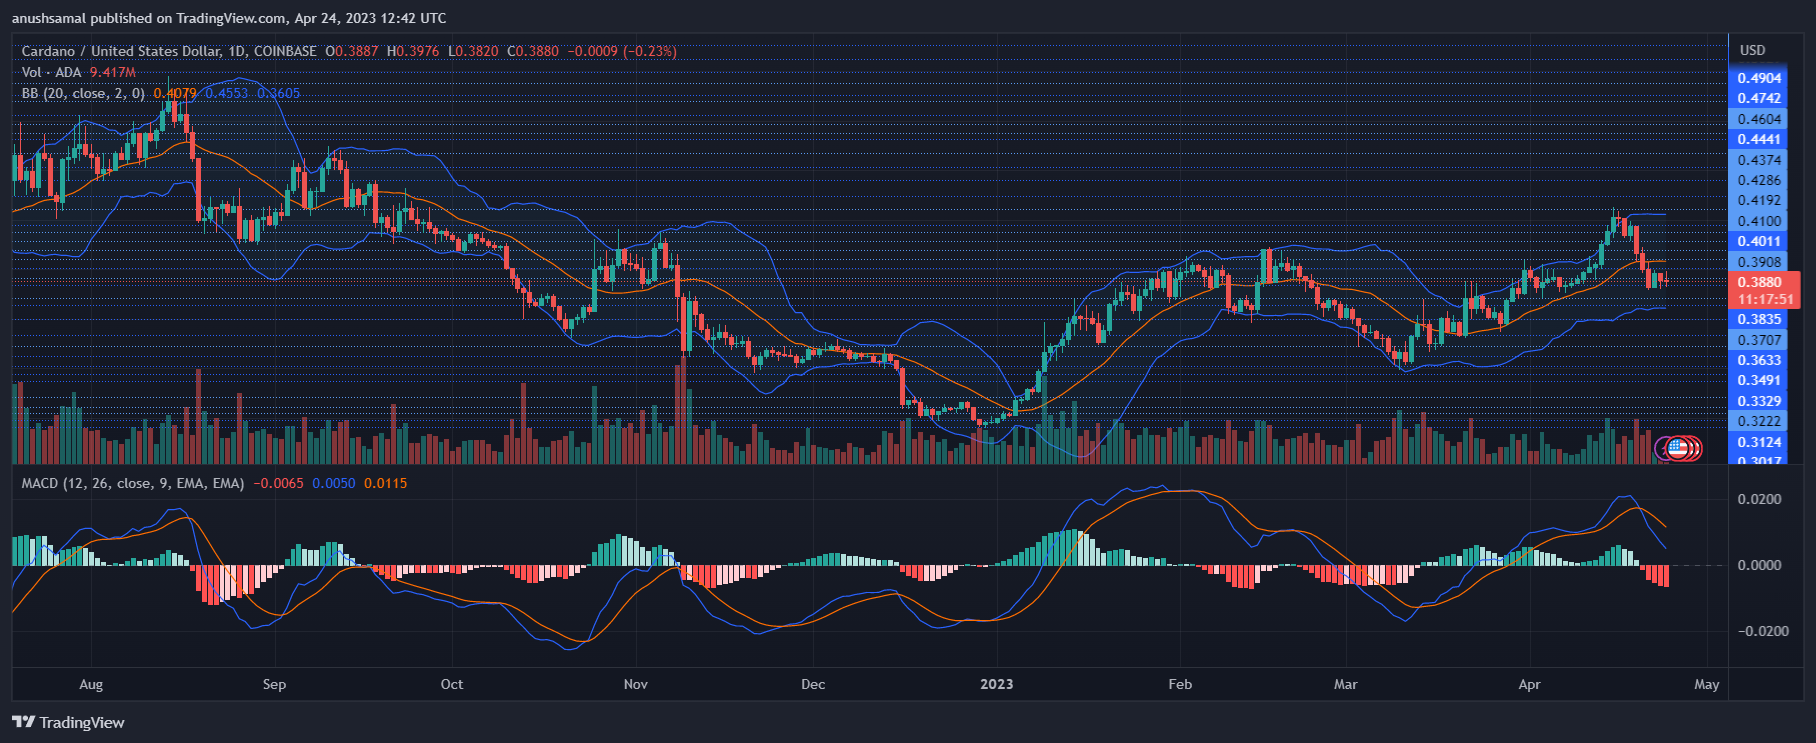
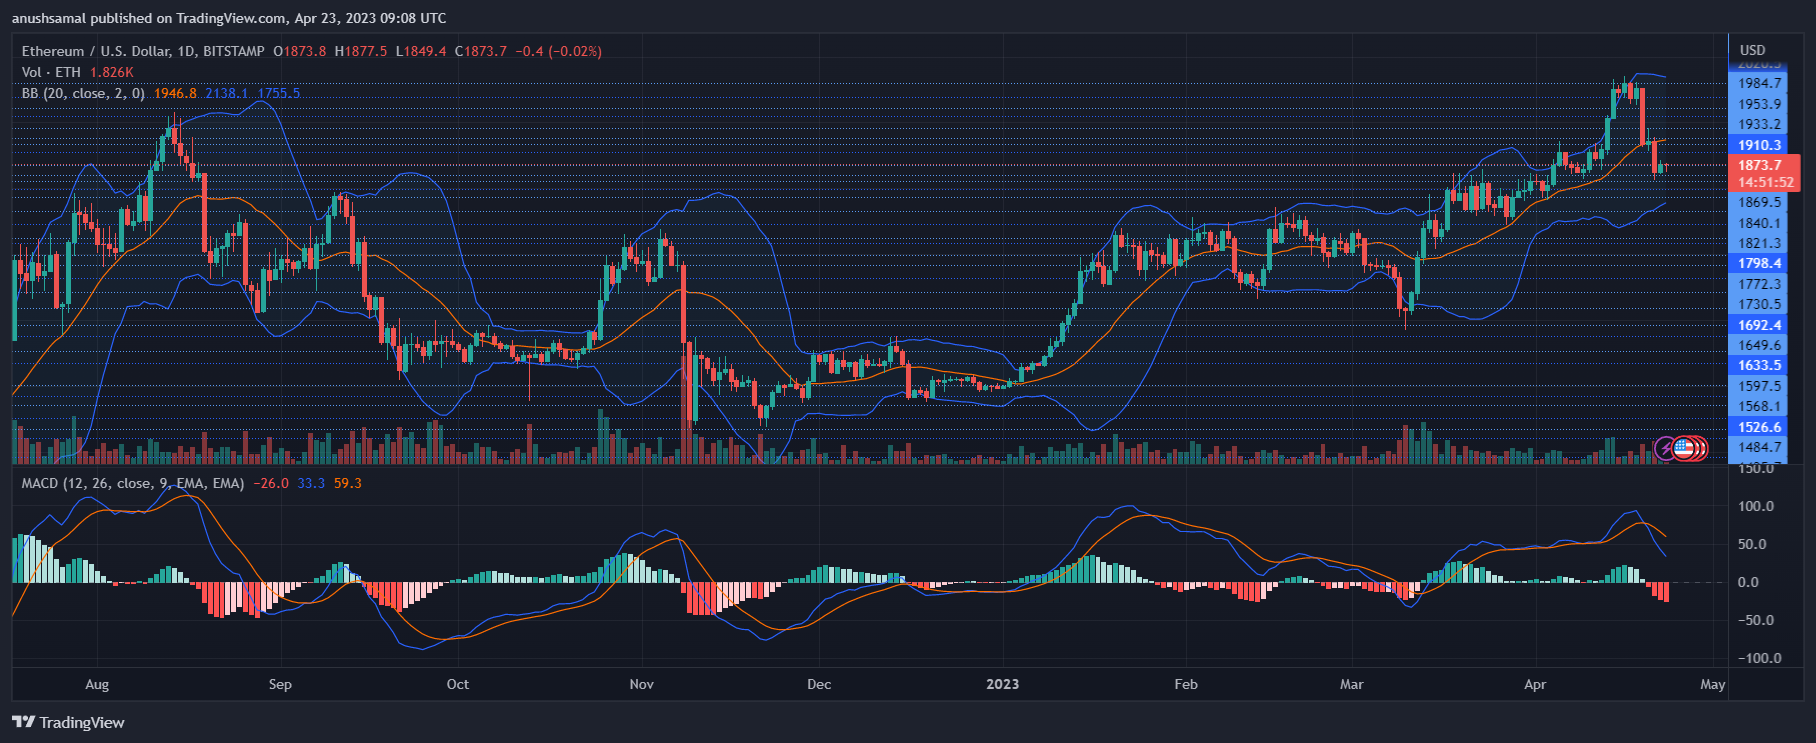
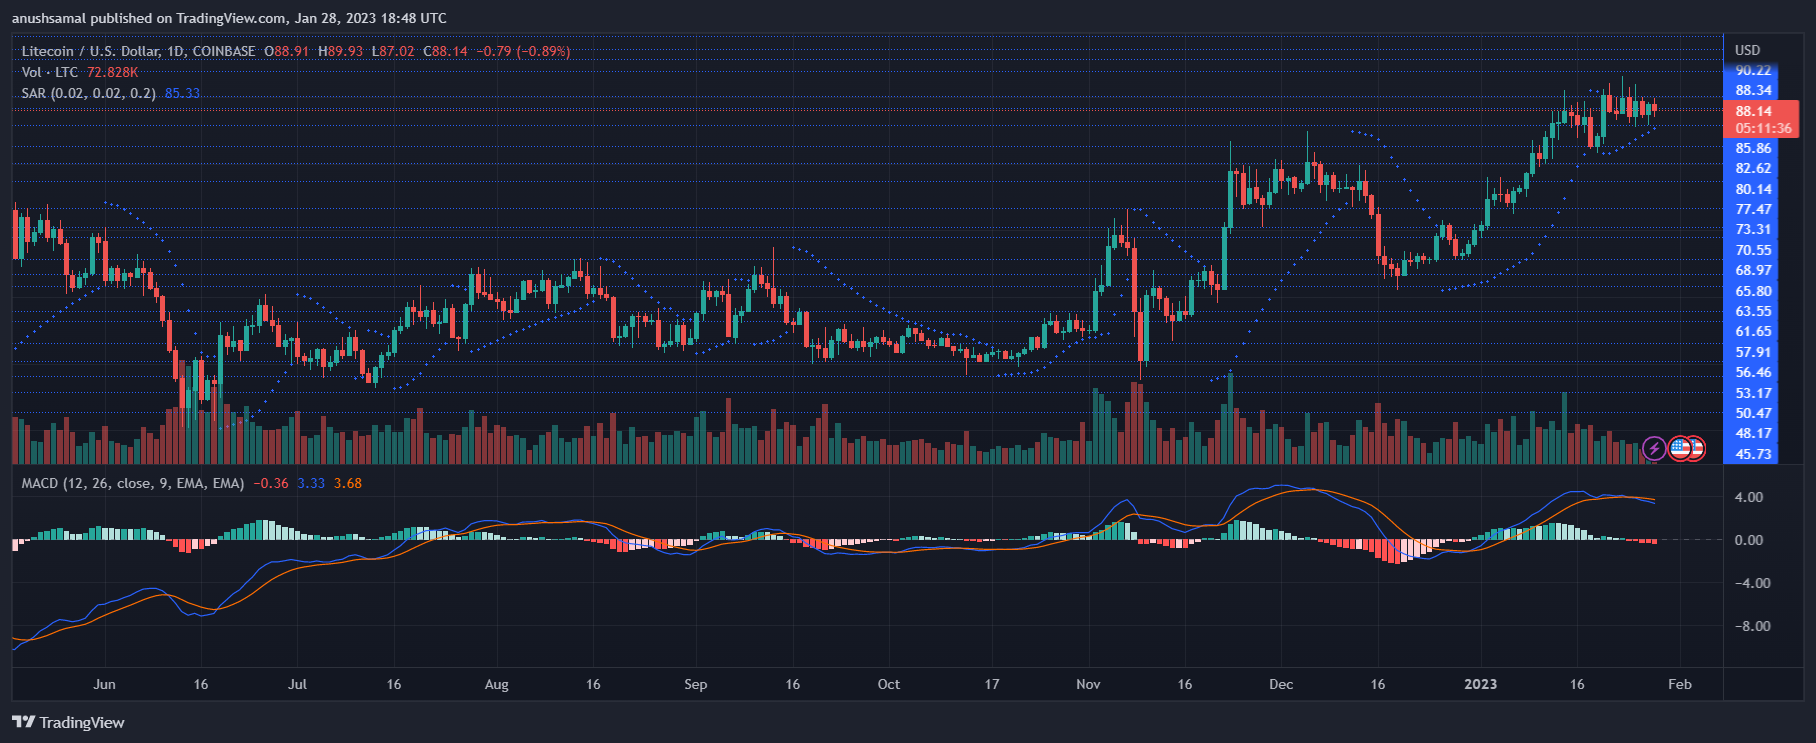
Confirming the bearish indications, the meme-coin showed sell signals. The Moving Average Convergence Divergence (MACD) which indicates price momentum and trend reversals exhibited red histograms which are associated with the sell signals.

Related Reading: The Aura Around PEPE Isn’t Good For The Market, Especially Bitcoin – Here’s Why

Conversely, the Chaikin Money Flow (CMF) remained positive, with the indicator above the half-line. This indicated that there were more capital inflows than outflows at the time of writing.

Breaking Above This Level Might Trigger A Bullish Momentum For Ethereum Price

Ethereum managed to surpass the $1,800 price level initially, but it has been experiencing a period of consolidation recently. In the past 24 hours, there has not been much progress in the price movement. Similarly, the weekly chart shows that Ethereum has not made significant price advancements during this timeframe.

The technical outlook for ETH is bearish, with indications of falling demand and accumulation. This suggests a lack of enthusiasm from buyers since Ethereum started trading sideways. The altcoin has been consolidating below an important resistance level, which, if successfully surpassed, could pave the way for a potential recovery.

Furthermore, ETH has formed a pattern that suggests the possibility of a bullish breakout in the near future. However, it’s important to note that for Ethereum to reverse its declining price trend, it will require broader market support.

The market capitalization of Ethereum has declined, indicating an increasing dominance of sellers. This suggests that selling pressure has been mounting.

Ethereum Price Analysis: One-Day Chart

Ethereum

At the time of writing, Ethereum (ETH) was priced at $1,819. After surpassing the resistance level at $1,800, Ethereum has struggled to maintain a clear price direction. The next significant resistance for the coin is at $1,822, and if this level is surpassed, there is a possibility of Ethereum attempting to breach $1,840.

Currently, ETH is displaying a downward wedge pattern, which is considered a bullish formation and suggests a potential price reversal in the future. However, if ETH falls from its current level, it could reach $1,800 and potentially even dip below $1,790.

The trading volume of Ethereum in the last session has also declined, indicating a decrease in buying strength. But this could also point toward fatigue among sellers.

Technical Analysis

Ethereum

The recent price decline has placed ETH buyers in a negative zone. The Relative Strength Index (RSI) indicates that sellers currently outnumber buyers, as it is below the half-line.

Furthermore, ETH has dropped below the 20-Simple Moving Average line, suggesting a lack of demand and indicating that sellers are driving the market’s price momentum.

However, if there is a slight increase in demand, it could enable ETH to surpass the next resistance level, which would strengthen the position of buyers in the market.

Ethereum

ETH price movement remains negative, consistent with other technical indicators. The Directional Movement Index shows a negative trend, with the -DI line (orange) positioned above the +DI line (blue).

The Average Directional Index (Red) is below the 20-mark, indicating a weak price direction. However, there is a potential hint of recovery suggested by the Chaikin Money Flow indicator. It has moved above the half-line, indicating that capital inflows are surpassing capital outflows.

Avalanche Nearing Key Support, Is It Expecting Recovery Anytime Soon?

Avalanche (AVAX) has experienced a bearish week with several price floors being lost. However, in the last 24 hours, AVAX has moved up by 1.5%, suggesting a sideways trading session. The technical analysis indicates that bears still have control over AVAX, with decreased demand and accumulation.

Buyers have lost interest due to previous bearish influence. Bitcoin’s price has been indecisive, losing the $27,000 price zone. Major altcoins have followed this trend. Although BTC has shown some recovery, overall market weakness has impacted buyer sentiment in the altcoin market.

AVAX is currently trading near a crucial support level, and further selling pressure could lead to significant value loss in upcoming trading sessions. Buyers need to intervene for the price to initiate a recovery.

The market capitalization of AVAX has also declined, indicating increased selling strength on the chart.

Avalanche Price Analysis: One-Day Chart

Avalanche

At the time of writing, AVAX was priced at $15.40. Following a modest recovery, AVAX has surpassed the $15 threshold and is now positioned near its critical support level of $14. The altcoin faces resistance at the $16 mark, and if it manages to surpass this level, it could potentially reach $18 and subsequently $20.

Crossing $16 would signal increased strength for the bulls. Conversely, a decline from the current level would push the coin below $15 and eventually toward $14, strengthening the bears.

With a slight uptick in demand, AVAX may make an attempt to breach the $16 threshold. The trading volume for AVAX in the previous session was relatively low, indicating a reduced presence of buyers in the market.

Technical Analysis

Avalanche

Throughout this month, AVAX has lacked significant buying strength. Currently, the Relative Strength Index (RSI) is slightly above the 40-mark but below the half-line. Although there has been a slight increase in the RSI, sellers have been the driving force behind the price momentum in the market.

This aligns with the observation that the price of AVAX has fallen below the 20-Simple Moving Average line, indicating that sellers continue to drive the price momentum in the market.

Avalanche

Despite a slight price increase in the past 24 hours, AVAX still shows sell signals on the chart. The Moving Average Convergence Divergence (MACD), an indicator of price momentum and reversals, has formed red histograms, indicating sell signals for the altcoin. This suggests a potential price decline before a recovery.

The Bollinger Bands, which represent price volatility and potential fluctuations, have remained wide, indicating that AVAX can anticipate price changes in upcoming trading sessions.

The upper band serves as a price ceiling, aligning with the resistance level at $16.

Dogecoin Expected To Experience A Further 6% Decrease Prior to Initiating Recovery

In recent weeks, Dogecoin has faced a downward trend in its price momentum, largely due to the emergence of PEPE coin, which has overshadowed its popularity. Over the past 24 hours, DOGE has shown limited upward movement, with a mere 1% increase. The meme-coin has experienced a significant decline in price, indicating a prevailing bearish control.

The technical outlook of Dogecoin showed that bears are currently influencing its price. Both the demand and accumulation have dipped, suggesting a decrease in buying activity.

Moreover, the rejection of Bitcoin at the $27,000 price mark has hurt major altcoins, including Dogecoin, resulting in a decline in their respective charts.

For Dogecoin to maintain its position above its immediate support level, it needs a recovery in buying strength. If it fails to do so and loses its current support level, it could experience another significant drop in value before any signs of recovery. Additionally, the decline in the Dogecoin market capitalization further indicates a fading buying strength at the time of writing.

Dogecoin Price Analysis: One-Day Chart

Dogecoin

As of the time of writing, Dogecoin (DOGE) was trading at $0.070. The meme-coin has been struggling to recover after facing rejection at $0.076, with the bulls unable to gain momentum. The current overhead resistance for DOGE is $0.073. If this level is breached, it could propel the meme-coin to $0.078.

However, if the price falls from its current level, it will likely reach $0.068 and potentially drop further to $0.066, resulting in a nearly 6% decline in value. The trading volume of DOGE in the last session indicated a red signal, indicating mounting selling pressure.

Technical Analysis

Dogecoin

Throughout the majority of the month, the demand for the meme-coin remained low. This was evident from the Relative Strength Index (RSI) staying below the 40-mark and nearly reaching the 30-mark, indicating oversold conditions.

Additionally, the asset’s price consistently traded below the 20-Simple Moving Average line, suggesting that sellers were the driving force behind the market’s price momentum.

Dogecoin

Throughout this month, DOGE has lacked positive demand, and its chart displays sell signals. The Moving Average Convergence Divergence (MACD), which indicates price momentum and reversals, formed red histograms below the half-line.

This suggests a signal to sell, indicating a potential decline in price in the upcoming trading sessions. The Bollinger Bands indicator has widened regarding price volatility and fluctuation, indicating that DOGE may experience price fluctuations in the next trading session. For Dogecoin to recover shortly, it heavily relies on broader market strength.

Key Support Levels To Monitor As Ethereum Price Slows Down

The Ethereum price consolidation weakened as the bulls lost momentum, resulting in a nearly 4% loss in the last 24 hours and a 7% decline on the weekly chart. The technical analysis indicates considerable bearish pressure.

The coin’s value remained stagnant at around $1,800, leading to waning interest from buyers and a significant decrease in demand and accumulation. As Bitcoin dropped below $26,000, major altcoins also experienced significant declines on their daily charts.

To break its resistance, Ethereum requires substantial buyer participation, as failure to do so could lead to the loss of a crucial support level.

Additionally, Bitcoin must recover and reach the $27,000 zone to initiate a short-term recovery for ETH. The declining market capitalization of Ethereum suggests a gradual departure of buyers from the market.

Ethereum Price Analysis: One-Day Chart

Ethereum

At the time of writing, ETH was priced at $1,770. After struggling around the $1,800 range, selling pressure eventually took over. The coin’s resistance levels were identified at $1,798 and $1,821. Conversely, if the price continues to decline, the bulls will attempt to defend ETH at $1,740.

However, a failure to hold above $1,740 would push Ethereum down to $1,690. A further drop would breach the $1,540 support line. Additionally, the recent session saw a significant increase in selling strength, reflected by the red volume of Ethereum traded.

Technical Analysis

Ethereum

Following the decline from the $1,800 range, ETH has experienced a significant sell-off with a lack of recovery in buying strength. The Relative Strength Index (RSI) dipped below 40, suggesting a decrease in accumulation and nearing oversold territory.

Additionally, ETH dropped below the 20-Simple Moving Average (SMA) line, indicating that sellers have been driving the market momentum. If ETH successfully surpasses the immediate resistance level, there is a possibility of moving above the 20-SMA line.

Ethereum

Several technical indicators on the daily chart of Ethereum began showing sell signals. One of these indicators is the Awesome Oscillator, which not only reflects price momentum but also identifies potential trend reversals.

In this case, the indicator displayed growing red histograms below the half-line, indicating sell signals for the altcoin. This suggests a potential decline in price before any recovery takes place.

Another indicator, the Bollinger Bands, which reveal price fluctuation and volatility, started widening. This widening suggests that Ethereum could experience increased price volatility and fluctuations in the upcoming trading sessions.

This heightened volatility indicates the potential for significant price movements in either direction. Ethereum has to topple over its immediate resistance in order to stall the bears. In addition to that, broader market strength will also prove to be crucial for ETH.

Cardano May Sink To This Level As Bears Keep Gaining Leverage

Over the past few days, the price of Cardano has been in a downward trend. This has led to the strengthening of bearish sentiment. In the last 24 hours, ADA experienced a dip of approximately 4.2%. Over the past week, the altcoin depreciated by close to 10%.

These price fluctuations have raised concerns about investors’ interest in Cardano. The same is reflected in the low buying strength and accumulation observed on the charts. Cardano finds itself trapped within a range, lacking a clear price direction, gradually eroding buyer confidence.

The bears have gained strength, causing an important support level to be breached and subsequently transforming into a resistance level for the altcoin. For Cardano to regain its previous price ceiling, buyers must reenter the market.

Furthermore, the broader market conditions, including Bitcoin’s consolidation around the $27,000 zone, have prevented many major altcoins, including Cardano, from surpassing their immediate resistance levels. For ADA to overcome its nearest resistance, it relies heavily on the market’s overall strength. There has been a decline in market capitalization, further emphasizing the increase in selling strength.

Cardano Price Analysis: One-Day Chart

Cardano

At the time of writing, the price of ADA stood at $0.35, and it is approaching a significant local support level that has played a crucial role in the past.

The closest support line is $0.34, while the overhead price ceiling is $0.36. The altcoin’s ability to reclaim the resistance level largely depends on the bulls’ ability to defend the price above the immediate support level.

If the current level experiences a decline, the coin is likely to first drop to $0.34, and if the selling pressure persists, it may further decline to $0.33. It’s worth noting that the volume of Cardano traded during the last session has decreased, indicating a decline in buying strength.

Technical Analysis

Cardano

Since ADA dropped below the $0.38 price level, its buying strength has failed to rebound. The Relative Strength Index (RSI) is below the 40-mark, indicating that ADA is nearing oversold territory on the daily chart.

Furthermore, the asset’s price has fallen below the 20-Simple Moving Average line, which suggests that sellers have taken control of the market’s price momentum.

Cardano

ADA has generated sell signals based on various indicators, suggesting a possible decline in price. The Moving Average Convergence Divergence (MACD) indicator, which reveals price momentum and reversals, displayed red histograms associated with sell signals for the altcoin.

Furthermore, the Directional Movement Index (DMI), responsible for indicating price direction, showed a negative trend with the -DI line (orange) positioned above the +DI line (blue). This implies a bearish sentiment in the market.

The Average Directional Index (ADX) also attempted to move above the 20 mark. However, it indicates a lack of strength in the current price trend.

Cardano Price Analysis: $0.46 Hinges On Breaching This Level

Over the past few weeks, the price of Cardano has experienced significant volatility. The altcoin initially rose from $0.37 but was later rejected at $0.45. However, over the last 24 hours, there has been a slight increase of 1.3%, while the weekly chart indicates a 6.2% price increase.

The technical analysis of ADA suggests that the bulls are attempting to take control of the price. Demand and accumulation showed signs of recovery.

Despite the slow progress in the ADA price, there is a critical resistance level that must be surpassed to trigger a rally. For the bulls to gain further momentum, buying strength must increase significantly in the upcoming trading sessions.

Additionally, major altcoins have been stagnant due to Bitcoin’s difficulty in reaching $30,000. If BTC reclaims this level, it could propel ADA bulls to drive up the price in the subsequent trading sessions. Furthermore, the market capitalization of ADA has recovered, indicating that buying pressure is returning to the market.

Cardano Price Analysis: One-Day Chart

Cardano

At the time of writing, ADA was trading at $0.40. The overhead resistance was $0.42. This level has proven to be a significant hurdle for Cardano in the past, and multiple attempts to break through it have been unsuccessful.

However, if ADA manages to move above this resistance level, it could trigger a rally and push the price towards $0.46.

On the other hand, if the price falls from its current level, the support level stands at $0.39. If ADA fails to remain above this support level, it could lead to a drop in price to $0.36. The amount of ADA traded in the last session turned green, indicating an influx of buyers.

Technical Analysis

Cardano

While there has been a slight uptick in demand for ADA, the buying strength on the daily chart has seen a slight downtick. The Relative Strength Index remains above the half-line, suggesting that buyers still have control of the market.

However, Cardano’s movement below the 20-Simple Moving Average line indicates that sellers may take over soon as the demand is not adequate. This reading implies that sellers are driving the price momentum in the market.

Cardano

ADA formed sell signals in line with other indicators. The Moving Average Convergence Divergence showed red histograms under the half-line, indicating a signal to sell, based on price momentum and reversals.

The Directional Movement Index was negative, indicating negative price momentum, with the -DI line (orange) above the +DI line (blue). The Average Directional Index (Red) was nearing 20, indicating that the current price action lacked strength.

XRP May Rally Over 10% Upon Breaching Two Critical Levels

Recently, XRP has been facing significant rejection at its overhead resistance level, including a rejection that occurred just a week ago. On the daily chart, XRP has shown a slight upward movement of 3%. However, over the past week, this altcoin has not made much progress as its price has decreased by 0.4%. This indicates that the XRP price is indecisive over longer time frames.

The technical outlook for XRP suggests that the market is bearish. There is a low demand for the altcoin, and accumulation remained less too. However, if XRP manages to move above its overhead resistance, this could trigger a recovery.

Currently, the BTC price is hovering below the $30,000 mark, and most altcoins have followed a similar trend. If BTC breaks through the $30,000 mark, XRP could attempt to move upwards.

At its current level, the altcoin is at a crucial point, as an increase in demand could cause a rally, while a decrease in price could result in a loss of up to 16% of its value. Furthermore, the market capitalization of XRP has decreased, indicating an increase in the number of sellers.

XRP Price Analysis: One-Day Chart

XRP

The altcoin was trading for $0.47 at the time of writing. It is trading underneath its overhead resistance of $0.48. The aforementioned resistance mark is crucial as it has served as a price ceiling previously.

A break above the $0,.48 mark can push XRP to $0.50, which might act as another ceiling before the altcoin targets $0.53. A move to $0.53 means over a 10% rally.

On the flip side, a fall from the current price level will drag XRP to $0.44 and then to $0.40, thereby bringing bearish influence back. The amount of altcoin traded in the last session was red, indicating a fall in demand.

Technical Analysis

XRP

Since the altcoin dropped below the $0.50 level, demand for the altcoin has failed to recover. The Relative Strength Index (RSI) indicates that selling strength outweighs buying strength, as the RSI is below the half-line.

Additionally, the altcoin remains below the 20-Simple Moving Average (SMA) line, which signifies that sellers have control and are driving the price momentum in the market. However, if demand for XRP increases slightly, it could push the coin above the 20-SMA line. This would signal a return of bullish strength on the chart.

XRP

In line with other indicators, the altcoin is displaying sell signals. The Moving Average Convergence Divergence (MACD), which indicates price momentum, has formed red histograms, signalling to sell.

Furthermore, the Bollinger Bands, which portray price volatility and fluctuation, have opened up. This suggests that the coin may experience significant price fluctuations over the next few trading sessions.

How Soon Will Litecoin Breach This Psychological Resistance Level?

In recent trading sessions, the price of Litecoin has remained stagnant below a significant resistance level while Bitcoin has experienced consistent fluctuations. Although Litecoin showed a slight increase of 2% in the last 24 hours, it lost 1% over the week, indicating consolidation.

The altcoin’s technical outlook suggests a potential bearish takeover, as demand and accumulation for the altcoin have both declined. The crucial overhead resistance level of Litecoin has been a barrier that the coin has failed to surpass previously. In the event of another rejection over the coming trading sessions, bears could successfully take over.

As Bitcoin approaches the $30,000 mark, major altcoins are following a similar price trend. If BTC successfully crosses this resistance level, Litecoin could experience a rally. However, the market capitalization of LTC has decreased in the last 24 hours, indicating a decline in buying strength.

Litecoin Price Analysis: One-Day Chart

Litecoin

At the time of writing, LTC was trading at $89.58, and the overhead resistance level was at $90, which the coin has attempted to break through over the past few weeks. If LTC manages to surpass this level, it could potentially trade near the $100 mark.

However, for a recovery on the chart to occur, selling pressure needs to decrease. On the flip side, if LTC falls from the $89 mark, it could reach $88. Failing to stay above that level could drag the price down to $84. The last trading session showed a red volume of LTC traded, indicating that sellers were dominating the market.

Technical Analysis

Litecoin

Following the formation of a tall bearish engulfing candlestick, the price of LTC has been steadily decreasing, and demand has also diminished. The Relative Strength Index (RSI) remains below the 50-mark, indicating that there is more selling pressure than buying strength.

Additionally, LTC has fallen below the 20-Simple Moving Average line, indicating that sellers are driving the price momentum. However, the price has moved above the 50-SMA line (yellow), suggesting that LTC might attempt to recover over the next trading session.

Litecoin

In line with other indicators, LTC has shown sell signals associated with negative price action. The Moving Average Convergence Divergence (MACD), which indicates price momentum and reversals, has continued to form red histograms, signaling sellers to the table.

The Directional Movement Index has also been negative, with the +DI line (blue) below the -DI line (orange). Furthermore, the Average Directional Index has fallen below the 20-mark, indicating that the current price trend lacks strength. However, with an increase in demand and broader market strength, LTC may be able to break through its overhead resistance level in the coming trading sessions.

Solana Can Rally Over 20% If It Breaches This Level

Over the past few trading sessions, the Solana price has been lacking direction. It is currently showing a bearish trend. The daily chart indicates that SOL has lost almost 4% of its value. Over the past week, it has fallen by 5%, erasing most of its gains due to the recent decline in price.

Additionally, the technical outlook for Solana is bearish. Demand has been falling as buyers have stayed away. SOL also depicted negative accumulation at the time of writing. Although SOL is currently heading in a bearish direction, there is still potential for a rally if it breaks through its overhead resistance level.

However, this will require a return of demand for the altcoin and consistent trading of Bitcoin above the $28,000 mark. Continued consolidation for SOL could lead to a loss of its current support and a subsequent drop in value over future trading sessions. The market capitalization of Solana has also decreased, indicating increased selling pressure on the daily chart.

Solana Price Analysis: One-Day Chart

Solana

At the time of writing, Solana was priced at $21.57. Its overhead resistance level was identified at $23.30, which also serves as crucial as it has previously acted as a sell zone for the coin.

If SOL manages to surpass this resistance level, it could potentially reach $26. This will result in a price appreciation of almost 22%. Conversely, a decline from the current price level would push Solana down to $20 and eventually $18.

The trading volume of Solana in the last session decreased, indicating a drop in demand for the altcoin at the time of writing. It is important to note that breaching the $23.30 resistance level would require a resurgence of demand for SOL.

Technical Analysis

Solana

Over the past week, demand for the altcoin has remained low, causing buyers to lose confidence, especially after its fall from the $23 level. At the time of writing, the Relative Strength Index indicated that selling strength had surpassed buying strength, as it was below the 50 mark.

Additionally, SOL dropped below the 20-SMA line, signaling that sellers had taken control of the market. However, there is still a possibility for a bullish market if buyers make a slight push, allowing Solana to rise above the 50-SMA line. This move could attract more buyers and revive confidence in the altcoin.

Solana

On the one-day chart, SOL showed sell signals that are consistent with other technical indicators. The Moving Average Convergence Divergence, which reflects price momentum, has formed red histograms that indicate sell signals for the altcoin. This signals a bearish price trend.

Furthermore, the Directional Movement Index (DMI) is negative, with the -DI line (orange) positioned above the +DI line (blue). Additionally, the Average Directional Index (red) has fallen below 20, indicating a weakening direction in the current price.

Chainlink Pushes Above $7, Will The Short-Term Recovery Hold?

The price of Chainlink had been in a period of consolidation over the past few sessions. However, the bulls were recently able to break above an important resistance level. Despite this recent bullish action, the daily chart showed a 6% depreciation and on the weekly chart, LINK had a 9% loss.

The technical outlook looked bleak with fading demand and low accumulation. Nevertheless, if LINK can remain above the $7 mark, another rebound may be possible. As Bitcoin displayed mild bullish sentiment after reclaiming the $28,000 mark, most altcoins exhibited similar behaviors.

If BTC retraces in the next trading sessions, LINK is expected to move closer to its immediate support level. Maintaining buying strength is crucial for the asset to stay above its local price floor. The market capitalization of LINK had fallen, indicating that sellers were more active.

Chainlink Price Analysis: One-Day Chart

Chainlink

At the time of writing, Chainlink was trading at $7.02, with its immediate resistance at $7.40. If the altcoin manages to surpass this resistance, it will encounter a tough price ceiling of $7.70, and reaching that level may revive the bulls.

Conversely, failing to stay above the $7 mark will pull Chainlink down to $6.80. If this happens, LINK may decline by up to 15%, nearing the $5.80 mark. The last session saw a decrease in the amount of LINK traded, and indicators suggested that buying strength was weakening.

Technical Analysis

Chainlink

Chainlink had experienced a sharp drop in buyers’ interest after encountering significant resistance at $7.70. However, demand for the altcoin could partially return if it moves above the $7.00 price mark. The Relative Strength Index was below the half-line, hovering around 40, indicating that sellers had taken control of the market.

Additionally, LINK had fallen below the 20-Simple Moving Average line, signaling that sellers were driving the price momentum at press time. If demand picks up, LINK could rise above the 50-SMA line (yellow), providing some relief to the bulls.

Chainlink

In line with the other technical indicators, LINK displayed sell signals, indicating a bearish turn in price. The Moving Average Convergence Divergence (MACD) demonstrates an asset’s price momentum and trend reversals as well. The MACD formed red histograms below the half-line, signaling a sell signal for the asset.

The Parabolic SAR reads the price direction and changes in the same. The indicator formed dotted lines above the price candlesticks, suggesting a downtrend in the price.

For LINK to maintain its price above the $7 mark, buying strength needs to resurface over the immediate trading sessions, and broader market strength has to remain consistent.

XRP Trades Near Crucial Support Of $0.46, Will This Level Hold?

During the past week, the price of XRP has suffered significant losses due to a powerful selling wave. While the one-day chart reflects a 3% increase, the weekly chart shows a decline of over 12%. Buyers have faced resistance in the $0.45-$0.46 range and the technical outlook for XRP indicates a selling trend.

The demand for this altcoin has also dropped, leading to a decrease in accumulation. Unless buyers return to the market and stabilize the price, XRP is likely to continue losing value. Meanwhile, Bitcoin’s price has remained uncertain over the past week, and its recent climb above $28,000 may inspire other altcoins to follow suit.

For XRP to see upward momentum, Bitcoin must maintain a price above $27,000. Furthermore, XRP must surpass the immediate resistance level to preserve its current support level. The decline in XRP’s market capitalization suggests that sellers are currently in control of the market.

XRP Price Analysis: One-Day Chart

XRP

At the time of writing, the altcoin’s trading price is $0.47, and it currently stands above its critical support level of $0.46. Despite attempting to recover significantly over the past few weeks, XRP experienced considerable selling pressure in the past week.

The coin faces overhead resistance at $0.48, and breaching that level could drive the price up to $0.50. Conversely, if XRP fails to remain above $0.46, the coin may decline to around $0.42 and possibly $0.40. The amount of XRP traded in the last session was negative, indicating a decrease in demand.

Technical Analysis

XRP

Despite the daily chart indicating a recovery, buyers seemed hesitant to make a move. The Relative Strength Index (RSI) was below 50, implying that sellers currently outnumber buyers.

Although there was an uptick in the RSI, buying strength remained fragile unless XRP surpasses the immediate resistance level. Furthermore, the altcoin was below the 20-Simple Moving Average (SMA) line, indicating that sellers were driving the price momentum in the market.

XRP

Aligned with other technical indicators, the altcoin began to exhibit sell signals on the one-day chart. The Moving Average Convergence Divergence (MACD) displays price momentum and trend reversals. Red histograms formed under the half-line, indicating a sell signal for the altcoin and a bearish price.

The Bollinger Bands measure price volatility and potential price fluctuations of the asset. The bands diverged in anticipation of incoming price volatility, with the upper band serving as a vital resistance level for the altcoin.

A move above the immediate price ceiling would aid XRP’s recovery and reduce the likelihood of heavy price fluctuation. Broader market strength will also be important for XRP to start its recovery.

Filecoin Experiences Sharp Sell-Off, Potential For Price To Drop Below $5

The bearish onslaught has taken a toll on the price of Filecoin, which slipped below the $6 mark, and the bears now have a strong foothold. On the one-day chart, Filecoin is showing consolidation with a loss of 1.1%. Over the last week, the coin has depreciated by nearly 17%.

The technical outlook for Filecoin indicates bearish pressure, with a drop in demand and accumulation. If sellers push further, it will add to the bearish pressure.

Bitcoin’s struggle to stay above $30,000 has affected other altcoins, keeping them below their immediate resistance levels.

The demand must recover in the next trading sessions for FIL to jump above the $5.50 price. The decline in the market capitalization of Filecoin over the past day also indicates growing selling pressure. Broader market strength remains crucial for the altcoin’s price movement over the subsequent trading sessions.

Filecoin Price Analysis: One-Day Chart

Filecoin

At the time of writing, the trading price for FIL was $5.26. Following its drop below the $6 mark, Filecoin has experienced a continuous free fall. The coin faces overhead resistance at $5.60; surpassing this level will push the coin towards $6, with a potential attempt to trade at $6.30.

Conversely, failing to trade at the current level will establish local support for the coin at $4.90. If the price falls below this level, it will reach $3.80, strengthening the bears. In the last session, the amount of Filecoin traded was in the red, indicating a drop in demand.

Technical Analysis

Filecoin

Over the past few trading sessions, the buying strength for FIL has decreased considerably due to a fall in demand. The Relative Strength Index showed that the buying strength had depreciated, and selling strength had taken over, as the index was below the 40 mark.

Additionally, the FIL price dropped below the 20-Simple Moving Average line, indicating that sellers had taken control and were driving the price momentum in the market. However, if Filecoin surpasses the $5.60 mark, the coin may rise above the 20-SMA line, bringing back the bulls.

Filecoin

At the time of writing, Filecoin gave sell signals in line with other technical indicators. The Moving Average Convergence Divergence showed red histograms, indicating sell signals for price momentum and trend reversals.

These signals suggested that FIL may experience further decline over the next trading sessions. The Awesome Oscillator, which measures price momentum and movement on the chart, formed red bars under the half-line, indicating that sellers had taken control of the market price and that FIL was experiencing bearish momentum. For the coin to initiate its recovery, FIL must surpass the overhead ceiling.

Cardano At Risk Of Falling 8% If It Doesn’t Hold Above Key Support Line

The Cardano price surged as it broke through a critical resistance trendline on its chart, a few days ago. However, the bullish momentum was short-lived, and ADA has since lost 0.5% of its value on the daily chart. The past week saw a significant depreciation of 14% in ADA’s value, with demand and accumulation both falling.

As Bitcoin retraces on its chart, most altcoins have followed the same price direction. The technical outlook of the altcoin has also sided with the bears.

For Cardano to regain momentum, buying strength needs to pick up over the next trading sessions. However, another push from the sellers can potentially cause ADA to lose its local support level, leading to a considerable fall in prices.

Related Reading: MATIC Below Key Support Levels: What’s Next?

Cardano has also formed a v-shaped top reversal pattern, indicating a decline in demand over the last trading sessions. The market capitalization of Cardano has fallen, suggesting increased sell orders at the time of writing.

Cardano Price Analysis: One-Day Chart

Cardano

At the time of writing, ADA was trading at $0.38, experiencing a significant drop since losing the $0.40 price mark. Overhead resistance for the altcoin is currently at $0.40 and then at $0.42. Breaching the $0.42 price level could trigger bullish momentum.

However, if Cardano fails to maintain its price above the immediate support level of $0.37, the bears could push the price down to $0.35. In the last trading session, the amount of Cardano traded was red, indicating that selling pressure had increased at press time.

Technical Analysis

Cardano

Demand for Cardano has seen a steep decline following its loss of the $0.40 support line. At the time of writing, the Relative Strength Index (RSI) was parked below the 50-mark, forming a downtick, indicating that sellers had outnumbered buyers.

Similarly, Cardano has fallen below the 20-Simple Moving Average line, implying that sellers are driving the price momentum in the market. Reclaiming the $0.40 mark could help Cardano rise above the 20-SMA, potentially aiding the coin’s recovery.

Cardano

At the time of writing, Cardano’s technical indicators showed sell signals in accordance with other indicators. The Moving Average Convergence Divergence (MACD) indicated the price momentum and trend reversals via red histograms.

These histograms are associated with the coin’s sell signal, indicating that the price could drop further before a reversal occurs.

Additionally, the Bollinger Bands, which measure price volatility and asset fluctuations, had opened up, signaling that Cardano may experience fluctuations.

The upper band of the indicator serves as a critical resistance level for the altcoin. Moreover, broader market sentiment remains a significant factor influencing the asset’s price direction.

MATIC Below Key Support Levels: What’s Next?

MATIC had been consolidating between $1.4 and $1.8 until it faced bearish pressure and declined. Over the last week, it depreciated nearly 16%, with a 6% dip on the daily chart. The technical outlook indicated bearish price action, with a drop in demand and accumulation.

Major altcoins also struggled to surpass their resistance levels as Bitcoin corrected itself. MATIC is currently stable on its local support line, but it broke two crucial price floors, suggesting that bears could dominate upcoming trading sessions.

A further round of bearish pressure could cause bears to take over entirely, causing MATIC to fall through its local support line. On the daily chart, the altcoin’s market capitalization indicated a negative change, implying that sellers were taking control.

MATIC Price Analysis: One-Day Chart

MATIC

The altcoin had struggled to maintain its value above $1 and dropped to $0.98. The overhead resistance of MATIC was $1.02, but due to a consistent decrease in demand, buyers lost confidence in the asset. If the price can break above the $1.02 resistance level, it may reach $1.06 and recover the bullish momentum.

However, if the price falls below $0.98, the local support line is at $0.96, and if the altcoin’s value drops further, it may break through the support line and trade around $0.90 before seeing any recovery. The last session showed a red volume bar, suggesting a decline in buying pressure on the daily chart.

Technical Analysis

MATIC

The recent rejection at the $1.14 level resulted in a swift exit of buyers from the market. The Relative Strength Index (RSI) dropped below the halfway mark, suggesting that sellers were dominating over buyers at the moment.

The same reading also indicated that MATIC went below the 20-Simple Moving Average (SMA) line, indicating an increase in selling pressure and that sellers were driving the price momentum in the market.

Breaking above the resistance could enable MATIC to surge past the 20-SMA line, thereby strengthening the bulls’ position.

MATIC

MATIC has started to form sell signals on the one-day chart in alignment with other technical indicators, indicating a potential dip in price. The Moving Average Convergence Divergence, which indicates price momentum and trend changes, formed red histograms connected to sell signals for the altcoin.

Additionally, Bollinger Bands, which suggest price volatility and fluctuation, have opened up, suggesting that MATIC may experience more price volatility in the near future. The broader market strength is also important for MATIC, as it can influence the altcoin’s price movement. Overall, the current technical outlook of MATIC appears bearish.

Avalanche Struggles Under $18 – More Losses Seem Likely

Over the last few days, Avalanche has experienced significant losses, plunging by almost 20%. On a weekly timeframe, AVAX has lost 10% of its market value. Although the daily timeframe indicates that AVAX has made a slight upward movement on its chart, with an appreciation of 1.6%, the technical outlook for Avalanche remains bearish.

Buyers have been cautious about price movements while sellers have dominated the market, leading to a decrease in both demand and accumulation on the daily chart. In order for the Avalanche price to experience some relief, it needs to break above the $18 mark.

However, the $17 price level has acted as a supply zone for the altcoin. If bulls cannot defend the current price mark of the altcoin, the bears may take full control of the asset’s price.

Similar to other prominent altcoins, major market movers have been struggling to break their crucial resistance levels. The decline in AVAX’s market capitalization indicates a decrease in buying pressure in the market.

Avalanche Price Analysis: One-Day Chart

Avalanche

At the time of writing, AVAX was priced at $17.17. The immediate resistance for the altcoin was at $18, and if breached, could lead to a push towards $19, thereby strengthening the bulls.

However, if Avalanche continued to trade sideways, a fall below the $17 level was expected. In such a case, the next support level for the asset was $15.

The altcoin’s recovery was dependent on buyers stepping in to push its price above the $18 mark. The recent amount of AVAX traded was red, which suggested an increase in selling pressure in the market.

Technical Analysis

Avalanche

Over the past week, there has been a significant drop in demand for the altcoin, leading to a decline in its value. Despite efforts by bullish investors to regain buying strength, it is essential to surpass immediate resistance to make progress.

The Relative Strength Index indicates that sellers outnumber buyers, with the index below the 50-mark. Though there has been a minor upswing, the bearish influence continues to dominate.

Additionally, the AVAX price remains below the 20-Simple Moving Average, indicating that sellers are gaining momentum and steering the market’s price action.

Avalanche

In addition, further technical indicators suggest that bearish momentum is prevailing. The Moving Average Convergence Divergence indicator shows the price momentum and reversals in the market. On the one-day chart, red histograms have formed, indicating sell signals.

The Directional Movement Index determines the price direction, and currently, the -DI line (orange) is above the +DI line (blue), resulting in a negative DMI reading. The Average Directional Index (red) is above the 20-mark, indicating that the price momentum is gaining strength.

What’s Next For Ethereum Price As It Drops Below $2,000?

The price of Ethereum has fallen below $1,900, dropping from the $2,000 mark that was previously held by bulls. This has led to another sell-off and the bearish influence remains strong despite attempts at recovery.

In the last 24 hours, Ethereum has risen by only 1.2%, but on the weekly chart, the altcoin has seen a significant drop of over 10%. The technical outlook for Ethereum is also in favor of the bears, as demand and accumulation for the altcoin have decreased. In order for Ethereum to make a recovery, it is crucial for it to breach the immediate resistance strength from buyers.

Despite this, most altcoins, including Ethereum, have remained bullish on the higher time-frame structure. However, bulls must defend the following support line or supply zone for Ethereum to start its recovery.

With Bitcoin struggling under the $30,000 price mark, many altcoins are also experiencing difficulty in breaking through their immediate price ceilings. On the one-day chart, the decline in the market capitalization of Ethereum indicates a decrease in buyers.

Ethereum Price Analysis: One-Day Chart

Ethereum

At the time of writing, ETH was valued at $1,880, having fallen below its bearish block ranging from $1,900 to $2,000. This drop in price is likely due to a routine price pullback, as Ethereum had traded above the $2,025 price mark after approximately eight months. However, as selling pressure increased, the bears have taken control.

The immediate overhead resistance for the altcoin is $1,910. A move above this level could potentially push ETH to touch $1,950, which may help to facilitate a price recovery. Conversely, the support levels for ETH are currently at $1,840 and $1,820.

During the previous session, the amount of ETH traded was in the red, indicating an increase in selling pressure.

Technical Analysis

Ethereum

As demand for ETH decreased, buyers also began to lose confidence in the asset. The Relative Strength Index showed that sellers outnumbered buyers on the one-day chart, as it was positioned just below the 50-mark.

Additionally, ETH dropped below the 20-Simple Moving Average line, indicating that sellers were in control and driving the price momentum in the market. However, with a slight increase in demand, ETH has the potential to trade above the 20-SMA line once again.

Ethereum

In line with other technical indicators, ETH began to exhibit sell signals on the one-day chart. The Moving Average Convergence Divergence, which measures price momentum and reversals, formed red histograms. This reading corresponds to sell signals for the altcoin.

Additionally, the Bollinger Bands, which gauge price volatility, were relatively far apart, but they have started to slightly converge. It suggested that ETH may trade within a specific price range over the coming trading sessions.

Litecoin (LTC) Displays Consolidation – Can We Expect A Reversal Soon?

The Litecoin price has shown considerable recovery ever since it reached its bottom in December 2022. LTC secured almost 50% appreciation in January this year. Currently, however, the altcoin has witnessed a price pullback and is consolidating on its daily chart.

Over the last 24 hours, the Litecoin price moved down by 0.3%, which signified a range-bound movement. The altcoin also lost close to 3% of its market value. The technical outlook of Litecoin pointed towards bullish momentum as demand for the altcoin remained high on the daily chart.

Accumulation also reflected the same. Price noted a decline as LTC receded from the overbought zone. Buyers still have the upper hand on the chart.

A continued fall in accumulation will cause bears to secure Litecoin’s price action. That momentum would continue for the upcoming week, causing LTC to fall below its nearest support level. At the time of writing, LTC was trading 78% below its all-time high set in 2021.

Litecoin Price Analysis: One-Day Chart

Litecoin

LTC was trading at $88.11 at the time of writing. The coin has pierced through several resistance lines over the past several weeks but has failed to hold on to the momentum. LTC met with two rigid resistance levels before it started to move south again.

The two important resistance lines for the coin stood at $90 and $92. Immediate resistance stood at $90. If demand for the altcoin remains steady, then LTC might attempt to breach the $90 price mark.

On the flipside, the nearest support line for the Litecoin price stood at $86, and a continued price correction will force LTC to fall below the $86 price mark and settle at $82. The amount of LTC traded in the last session was red, indicating a fall in buyers.

Technical Analysis

Litecoin

The altcoin has been hovering in the overbought region for several weeks now, and at the moment there is a slight fall in demand for Litecoin. The Relative Strength Index stood a little below the 60-mark after it noted a recent downtick indicating that demand was shrinking.

A reading close to the 60-mark, however, signifies that buyers outnumbered sellers. In accordance with that, LTC price shot past the 20-Simple Moving Average (SMA) line as buyers were driving the price momentum in the market.

The coin was also above the 50-SMA (yellow) and 200-SMA (green) lines, indicating increased bullishness.

Litecoin

Concerning the fall in buying pressure, the LTC chart displayed a sell signal on the one-day chart. The Moving Average Convergence Divergence (MACD), which depicts market momentum, underwent a bearish crossover and formed red signal bars tied to sell signals.

This could also imply that the price will fall in the coming trading sessions. The Parabolic SAR, the indicator that reads the trend and change in price momentum, was still positive. The dotted lines were below the candlesticks, suggesting that the LTC price was still positive.

Ethereum Closes Near Its Next Profit Take Region As Bullish Momentum Continues

The Ethereum price has been propelling itself considerably ever since Bitcoin crossed the $20,000 price mark. Over the last 24 hours, ETH has slightly moved down on its chart, depicting consolidated price action. Last week helped the Ethereum price move up by 6%.

The coin finally broke past its consolidation at the $1,500 price level and has been moving north ever since. The technical outlook of the coin has pointed towards continued bullishness on the chart. Accumulation has increased substantially ever since Ethereum breached the $1,500 price level.

The chance of a price reversal cannot be ruled out just yet, as ETH was overbought and overvalued. Currently, Ethereum has secured $1,600 as the support level. The next price correction could help traders with buying opportunities.

A price correction might not occur over the immediate trading sessions as demand for the coin remains quite high on the chart. Ethereum’s price might continue on the upside before the coin retraces. The market capitalization of Ethereum increased, which also reflected that the buying sentiment remained high.

Ethereum Price Analysis: One-Day Chart

Ethereum

ETH was exchanging hands at $1,620 at the time of writing. Immediate resistance for the coin stood at $1,690; it even corresponds to the 50% Fibonacci retracement level. A move above $1,690 will help Ethereum touch the $1,700 price mark.

The $1,700 price mark is crucial, as touching or breaching this mark could mean continued bullish momentum for the crypto.

ETH could even soar to $2,000 if the $1,700 price mark is crossed. This region will act as a profit-take region for traders. On the flip side, if the bullish momentum slows down, the first fall would be at $1,600 and then at $1,520. The amount of Ethereum traded in the last session was red, signifying a downtick in buying.

Technical Analysis

Ethereum

The altcoin was still in the overbought zone, which also means that Ethereum broke a multi-month record in terms of accumulation. The Relative Strength Index was parked a little below the 80-mark, which still signified heavy buying strength and bullishness.

If demand stays at this level, bullish momentum will not fade out anytime soon. ETH was also trading above the 20-Simple Moving Average line, indicating that buyers were driving the price momentum.

On the contrary, the 200-SMA line crossed the 20-SMA line, which implies that the coin might be headed for southbound price movement.

Ethereum

As accumulation has remained at a record high for the coin, chances of a price pullback still remain for the altcoin. The Awesome Oscillator, which signifies price direction, displayed red histograms, which meant that these were sell signals for the altcoin.

Sell signals can be accompanied by a fall in price. Ethereum may briefly fall in price before resuming its upward trend.

The Directional Movement Index was still positive, as the +DI line (blue) was above the -DI line (orange). The Average Directional Index (red) shot past 40, which suggested that price direction would gain further strength, which will push ETH to break past its nearest price ceiling of $1,700.

Is Litecoin (LTC) Expecting A Pullback Before Soaring Again?

The Litecoin price has shown bullish sentiment over the past week once it bounced off the $81 resistance zone. Over the last 24 hours, the altcoin jumped by 2%, and in the past week, the LTC price gained close to 6%.

As Bitcoin continues to trot upwards and is now eyeing the $23,000 price mark, other altcoins have reflected the same price sentiments. The technical outlook of the Litecoin price has depicted that accumulation shot past the overbought region just when Litecoin breached the $81 price region.

Demand for the coin remained steady between the $81 and $88 price levels, respectively. As Litecoin traveled above the $88 price zone, the coin started to display a price correction. Going by the indicators, Litecoin continues to remain heavily bullish on its chart, with another chance of a price retracement.

Bullish momentum has gained strength since it moved past the $86 price mark, which is why a move to the $90 mark was swift and easy for Litecoin. Historically, the $93 resistance mark has acted as a pullback region for the coin. LTC might reach the $93 level over the next trading session if Bitcoin continues to surge.

Litecoin Price Analysis: One-Day Chart

Litecoin

LTC was trading at $91 at the time of this writing. Over the past couple of weeks, Litecoin has pierced through several resistance levels. The coin faced stiff resistance at $81 and has been rallying since crossing that level.

Overhead resistance for the coin stood at $93; this will act as a crucial price mark because LTC can experience a pullback before it tries to breach the $106 resistance mark.

On the other hand, if Litecoin fails to remain above the $88 support line, it would lead to sellers exceeding buyers, causing the altcoin to fall to $80 and then $71. The amount of LTC traded in the last session was red, which signified that there was a fall in the number of buyers.

Technical Analysis

Litecoin

LTC hovered around the overvalued zone, which indicated that there would be another price correction before it started to trade upwards again. The Relative Strength Index (RSI) stood at the 70 mark, which indicated that the asset was overbought.

A fall from the overvalued zone can drag the price of the asset below $88. Litecoin continued to depict extreme bullishness as the price was above the 20-Simple Moving Average line.

This meant that buyers were driving the price momentum in the market. The coin was also above the 50-SMA and 200-SMA lines. However, the 50-SMA was above the 20-SMA, which is a sign of impending bearishness and indicates a price pullback.

Litecoin

Buy signals for the asset started to show a decline, which meant that buyers might start to exit the market over the next few trading sessions.

The Moving Average Convergence Divergence (MACD) indicates price momentum and reversal; it displayed receding green signal bars, which meant incoming bearish price action.

Bollinger Bands indicate price fluctuation and volatility; the bands were far apart, which implied forthcoming price instability.