Ethereum Could See A 15% Drop This Week – A Retreat To The $1,000 Support?

Ethereum is having a good week, staying in the green zone of the crypto space for the past seven days and raising its price by 3.7%.

  • Ethereum is currently caught in an inverted pennant pattern
  • A resumption of the bearish trend is highly possible for the altcoin
  • $1,130 might be new support marker for Ethereum

The second largest cryptocurrency by market capitalization is currently trading at $1,324 according to Coingfecko at the time of this writing while its 24-hour trading volume stands at a little over $5 billion.

But the widely recognized king of all altcoins and its investors should consider staying on their toes as analysts believe that the asset is headed for a significant price correction and bearish momentum.

This development once again contradicts bullish expectations for the crypto after successfully undergoing network upgrade last month.

Ethereum And Its Bearish Price Pattern

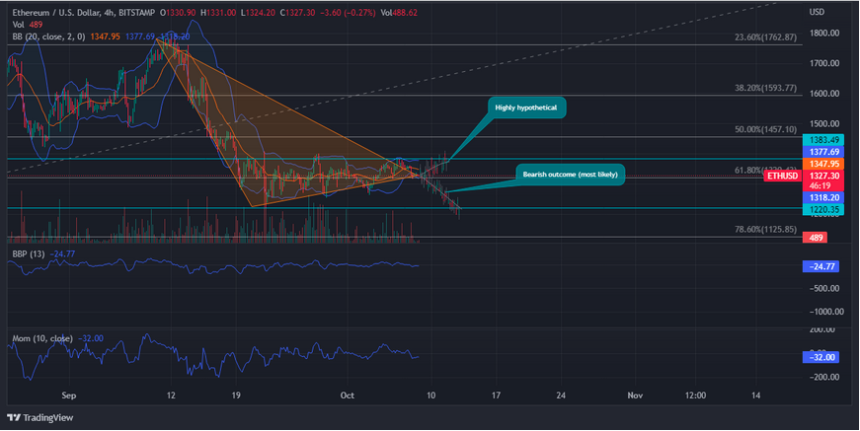
The inverted pennant pattern is where the Ethereum price has been revolving for the past days, with the crypto in danger of being out into an accelerated bearish momentum.

Source: TradingView

Under this pattern, a triangle formation appears where the price peaks before breaking the bottom support trendline and resumes its prior downtrend.

In Ethereum’s case, such a scenario would mean breaking the $1,250 support level all the way to $1,130. If that happens, the altcoin could be looking at a price drop of up to 14.3%.

However, there is a possibility that the reverse would happen and Ethereum will shatter the support overhead trendline which will prevent the looming bearish run of Bitcoin’s nemesis.

Bad Time To Buy Ethereum?

The negative news just keeps coming for Ethereum as crypto tracking tool Coincodex concluded it is not a good time to invest in the altcoin right now.

Come October 16, the digital asset is expected to lose 7.12% of its value and trade at $1,237.79. Technical indicators are also looking bad for the crypto, as its current sentiment is bearish and volatility remains high.

As for its Fear and Greed Index, Ethereum gained a score of 22, which indicates there is extreme fear. Also, out of 30 days, the cryptocurrency only managed to have 12 green days, equivalent to 40%.

Meanwhile, next year appears to be more promising for the altcoin king, as it is projected to end the year with a trading price of $2,156.26 which is significantly higher than its current value.

On that account, experts are saying that 2023 is a good year to buy the asset.

ETH total market cap at $160.36 | Featured image from Local News Today, Chart: TradingView.com

How This Crypto Pulled Off A Surprise 60% Rally In This Area – Find Out Here

Crypto assets have different utilities, but at the end of the day, their performance will be evaluated by their trading price, volume and total market capitalization.

That is perhaps the lesson that was reminded to the Polygon network and its native cryptocurrency MATIC, which continues to decline after attaining its all-time high just 10 months ago.

The 14th largest crypto by market cap, according to Coingecko, is trading at $0.813 as of this writing. It has been down by 1.6% for the last 24 hours but is still sitting on a 6.2% gain over past seven days.

While still far from the ATH of $2.92 which the crypto hit on December 27, 2021, the asset is among those that are on the green as the digital currency market prepares for the tail-end of 2022.

MATIC Performs Well In Dapps Area

Recently, Polygon released a report that supposedly contained one of the significant accomplishments of the network for the year 2022.

This pertains to the unprecedented growth in terms of the number of Decentralized Applications (Dapps) that are built on the Polygon chain, which reached the 53K mark at the end of the third quarter of this year.

The number is three times bigger than the one tallied by Polygon on March of this year and 60% higher than the total for the entire second quarter.

The creator of the MATIC crypto has every reason to celebrate such feat, considering Dapps are often built into the Ethereum network.

One potential reason for this surge is the recent partnership of Polygon with Starbucks, Robinhood and Nothing.

Crypto Continues To Struggle Amid Milestone

While the Polygon network enjoys its success in the Dapps arena, its crypto is not looking so good right now according to some metrics.

MATIC’s 24-hour trading volume as of this writing is $271.58 million after falling by 6.86%. The crypto is also witnessing a drop in its one-day circulation data.

On October 3, the digital asset recorded 117.36 million circulating supply. That number dwindled significantly to just 869,000 at press time.

Addresses for the crypto also decreased, from 2,747 to 2,407, although the decline seems to be insignificant.

Negativity just seems to keep on piling for MATIC, as its social volume is also on a downward trend, indicating the crypto community is not that enthusiastic with the asset’s future.

The token is currently sitting on an almost-insignificant social dominance of 0.023%, several steps behind the 1.589% it tallied on September 21, 2022.

MATIC total market cap at $7.21 billion | Featured image from The Daily Hodl, Chart: TradingView.com

XRP Gets 60% Boost In Last 30 Days – Ripple Win Vs. SEC Seen To Lift Price Higher

XRP is in a wait-and-see position as it braces for the conclusion of a lawsuit filed by the U.S. Securities and Exchange Commission against Ripple Labs.

  • XRP’s forecast average price for October 2022 is $0.50995
  • XRP, at one point, was up by almost 60%
  • Ripple Labs continue to gain procedural wins against SEC

It can be recalled that on December 22, 2020, the regulatory body announced it has lodged a complaint against the American technology firm and two of its executives for selling XRP which the complainant considers an unregistered security.

Christian Larsen, co-founder and former CEO of Ripple Labs and Bradley Garlinghouse, current CEO, was also included in the lawsuit as the duo was alleged to be involved in making around $600 million by selling the cryptocurrency.

Since then, the digital asset seems to have been relegated to the sidelines, affecting its performance in the crypto space.

In fact, XRP has now lost 85% of its $3.40-all-time high value attained on May 22, 2014. The crypto, however, is refusing to be dragged down, as it slowly climbs back to relevance.

XRP Posts Impressive 30-Day Growth

At press time, according to data from CoinMarketCap, XRP is currently changing hands at $0.51. It has been down by 1.7% for the past hour but at one point was up by almost 60% for the last 30 days.

The recent price correction experienced by the asset trimmed its monthly gain, which now stands at 50.3%.

Source: CoinMarketCap

Still, the 6th largest cryptocurrency in terms of market capitalization is one of the few altcoins that have managed to mount a bullish rally despite the bearish month of September.

Some analysts believe that one of the reasons for the crypto’s impressive performance is the fact that Ripple Labs managed to get procedural wins against SEC in their legal fight.

Just recently, a district judge has ordered the release of documents pertaining to a speech made by former Division Director William Hinman where he said Bitcoin and Ethereum are not securities.

XRP Price Forecast

At the start of this year, XRP has experienced fluctuations in its price that influence price forecast for the asset.

For this month, crypto experts say the asset’s average price will stand at $0.50995. The lowest possible price for the crypto this October is $0.45995 while the highest is $0.51995.

According to analysis, the coming month of November won’t be any different for XRP, as it is expected to trade at an average price of $0.51995. The crypto is expected to peak at $0.53995 and bottom at $0.48995.

In the foreseeable future, assuming Ripple Labs finally wins its legal dispute with the SEC, XRP is expected to hit and firmly hold the $1 mark.

XRP total market cap at $25.6 billion | Featured image from The Daily Hodl, Chart: TradingView.com

Ethereum Price Looking At Possible Downward Shift – More Headaches Ahead For ETH?

The post-Merge landscape of Ethereum took many by surprise; the figures and the outcome weren’t something they had in mind.

Bad macroeconomic conditions and other negative factors overshadowed what was expected as a breakthrough. It was, in some ways, but the fanfare pre-Marge was so hyped up, until a few days following the event.

The optimism that had been building up in the days leading up to the CPI report, which ultimately brought down the broader financial markets, was wiped out in the fall on September 13.

Ethereum (ETH) Feeling Fed Hike Stress This Early?

As of this writing, Ether was down as it was reported that a further 75 basis point hike in interest rate by the U.S. Federal Reserve is possible in November if economic conditions don’t improve.

ETH, this early, could be starting to get stressed with the Fed’s looming rate bump. The chart suggests that ETH may be in for more losses, but what does it actually show?

Chart: TradingView.com

If the graph is any indication, things aren’t looking so rosy.

Since September 19th, the altcoin has traded between $1,408.15 and $1,219.29, with support located at the 61.80 percent Fibonacci retracement level, now at $1,265.02. The bull bear power indicator has formed a downward pointing at the time of writing.

This may indicate that it will be even more challenging for prices to rise above the $1,384.77 resistance level. Since September 15th, the center of the Bollinger Band has been providing dynamic resistance.

The indicator also revealed the formation of a crunch zone, making a price move over $1,384.77 more difficult.

The 20-day to 250-day simple moving averages are all acting as resistance levels, adding to the downward pressure on the altcoin.

The intraday chart displays a falling triangle formation. In light of the aforementioned, this may indicate to investors and traders that a further correction may occur in the near future.

With present market pressures, a market correction might push the price down to $1,220.35, a 10% decrease.

Speculative Bullish Run – How This May Transpire

If the support at $1,265.02 holds, the resistance at $1,384.77 could be retested. This hypothetical rise is supported by the Chaikin money flow index, which indicates the market is still dominated by buyers to some extent.

Bullish investors can use the CMF as a springboard and a strength boost for the previously mentioned weak support line. Even if the momentum indicator is bearish, it is creating a slow rise.

These variables can assist the price eventually reach the $1,384.77 resistance level and break through it, allowing a rebound to occur. If today’s trading session ends on a poor note, investors and trailers can participate in the price rebound by buying the dip.

ETH total market cap at $162 billion | Featured image from Kryptografen, Chart: TradingView.com

Meme Coin Wars – Floki Inu Vs. Dogecoin And Shiba Inu – Who Wins?

There’s an ongoing meme coin war and it pits a lesser known coin against two other well-entrenched cryptos in the space today.

  • FLOKI is a crypto based on Elon Musk’s dog that has the same name
  • Floki Inu’s market cap is less than $1 billion
  • The crypto has been on a decline after it bottomed in June 2022

Floki Inu (FLOKI), a meme crypto that was inspired by the dog of self-proclaimed “Dogefather” Elon Musk, is aiming to surpass Dogeoin (DOGE) and Shiba Inu (SHIB).

That could prove to be easier said than done as it is losing to its fellow dog-themed cryptoccurencies in several battlefronts.

Total market capitalization is one of these aspects and Floki Inu’s is worlds apart compared to DOGE and SHIB.

Of the three, Dogecoin has the highest market cap, valued at $8.4 billion. Its spin-off token is somehow keeping up as Shiba Inu’s total capitalization stands at a little over $6.5 billion.

FLOKI finds itself in a distance that is very far from the two, as its market cap is only $70.2 million.

In terms of current trading price, DOGE leads the pack. At press time, according to CoinGecko, it is trading at $0.062. SHIB is changing hands at $0.00001109 while FLOKI is at $0.00000754.

Along these lines, Floki Inu needs to grow its market cap 100x just to surpass Shiba Inu. But even after that, Dogecoin will still prove to be a bigger challenge for the crypto.

FLOKI Price Action At A Glance

Even with Floki Inu’s minimal value, it ended up being one of the casualties of the recent bearish streak that plagued the crypto space.

Its price action chart shows the coin bottomed in June 2022 when it reached $0.0000048433 before making an impressive bullish rally, increasing its value by 270% to trade at $0.0000178931.

Source: TradingView.com

However, FLOKI wasn’t able to sustain that run and gain, as it tipped below the crucial $0.0000135356 mark. Since then, it continued to decline and hasn’t been able to make any kind of recovery.

The altcoin is in a precarious position as falling from its support level of $0.0000075326 will mean downward price trend that will send it to another bearish rally.

Floki Inu: Origins And Immediate Goals

Shortly after Elon Musk announced he was naming his dog Floki, an unidentified team worked on the digital currency sharing the same name and eventually launched it.

The Ethereum Blockchain-based Floki Inu was abandoned by its original developers after realizing there was an inflation bug in its initial token contract.

The Floki community did not give up on the asset and formed a team that revived the crypto which they claim is unique compared to other meme coins as it is capable of combining memes and utility.

True enough, the Floki Inu token is actually used to run the metaverse game known as Valhalla.

As for its immediate goals, FLOKI’s marketing chief said over the next year, they’ll have more utility and holders than SHIB.

Meanwhile, it will be interesting to see whether a new meme coin emerges to go head-to-head with Dogecoin and Shiba Inu in the coming bull market.

Will FLOKI muster enough firepower to beat DOGE and SHIB?

SHIB total market cap at $5.99 billion | Featured image from Watcher Guru, Chart: TradingView.com

How These 5 New Crypto Bagged $50 Billion In Market Value In Less Than A Week

Crypto developers seem to be unfazed by the bearish market as they continue to introduce new altcoins or tokens into the space.

It is because of this that digital currency price and information data platform CoinGecko is now tracking 13,201 cryptocurrencies.

Despite the bloody month of September for most cryptos, the collective market capitalization of these digital assets is currently valued at $986 billion.

As expected, Bitcoin and altcoin king Ethereum, continue to assert their dominance as they account for 38% and 16.3%, respectively, of the total crypto market cap.

But while these two pack leaders seem to always be on the limelight, there are other lesser known digital tokens that have just joined the stack. 

Crypto Quintet Accounts For $50 Billion MC

Just this October 7, four days after their initial listing, five new cryptocurrencies accounted for a total market capitalization of $50.75 billion.

These “new entrants” didn’t have to wait for a long time to make a loud noise enough to turn heads in the ever-growing crypto sphere.

Among the five, RIMAUNANGIS (RTX) led the way with its $27.8 billion market cap. At press time, tracking from CoinMarketCap shows the NFT-centered digital asset was trading at $13.89.

GOLCOIN (GLC) and Joystick (JOY) ranked 2nd and 3rd with their fully diluted total value of $17.8 billion and $3.29 billion, respectively. GLC is changing hands at $61 while the JOY gaming token is trading at $0.65.

Joining the three are their fellow newly-introduced cryptocurrencies, ELAN and Shihtzu Exchange (STZU) token.

ELAN is 4th with its $1.04 billion cap while STZU came at the bottom with its $730.2 million market capitalization.

A Quick Reminder For Investors

While the continuously growing number of cryptocurrencies signals strong interest and high expectations for profitability in crypto space, investors are once again urged to be cautious in dealing with newly released crypto assets.

Pump and dump schemes have victimized a lot of crypto investors over the years and have been the go-to move by scammers to score easy money.

It is highly advised that potential investors of different cryptos conduct thorough research about the asset they plan to spend their money for.

More often than not, these fraudsters tend to take advantage of the fear of missing out (FOMO) of individuals and even companies that pin their hopes on new tokens and projects to emulate the success of early Bitcoin investors.

Crypto total market cap at $907 billion | Featured image from Pro Bono Australia, Chart: TradingView.com

SushiSwap: Deciphering How SUSHI Is Posting Unparalleled Price Growth

Positive developments in the marketplace have led to a rise in SushiSwap share price. Asset management business Golden Tree has bet around $5.3 million on SushiSwap.

The news caused a nearly 15% increase in SushiSwap’s share price the day after it was released. Since the uptick of August 31–September 10, this is one of SushiSwap’s most rapid periods of expansion.

The fall that occurred on September 13 as a result of negative macroeconomic pressures was almost entirely erased due to this rally. SushiSwap has a current TVL of $607.51 million.

Increased network activity was also noted, according to Santiment’s analysis of the price spike that was also made public.

They also saw the rise in both network activity and address creation. However, what does this mean for SUSHI generally?

Expanding The Protocol

As stated in a thread on the SushiSwap site, Golden Tree has faith in the potential of the entire Sushi protocol, praising its resilience along with that of the community that supports it.

The company stated that with the funding, they will be able to contribute in the development and expansion of the protocol’s various components, such as Kuro (a loan service) and Trident.

This investment has a tremendous impact on the development aspect of things. This is the significant increase in on-chain development activity.

SushiSwap Served On The Green

The graphs depict this optimistic prognosis for SUSHI. Since October 4, the intraday time scale has displayed green candlesticks until now. The upswing surpassed the $1.1413 resistance level, which had previously resisted a breach.

Image: TradingView.com

The current surge is supported by the middle line of the Bollinger band and the 20, 50, and 100-day simple moving averages. This rally should be viewed with caution, however.

When the bulls reach a substantial level of resistance, a rise of this magnitude may be met by a robust reversal.

Currently, there’s a lengthy rejection of $1.4282. This adjustment is already visible on shorter time scales. On the 1-hour time frame, a downward trend is forming. Currently, bulls have sufficient momentum to challenge the $1.4282 resistance level.

The bulls should defend the $1.1587 support line if the price falls. A long position may be untenable for investors and traders at the moment. Investors and traders can enter the market at the present price and establish a stop loss at $1.4194.

Meanwhile, long-term SUSHI holders can rejoice at this relatively recent rally.

SUSHI market cap at $173 million | Featured image from The Market Periodical, Chart: TradingView.com

BNB Holders Should Brace For This Trend Reversal – Happy Days Over?

BNB, a native token of the Binance cryptocurrency exchange, made it through the bearish month of September with minimal losses.

  • BNB currently trades at $285.40 and is up by 3.4% for the past two weeks
  • The altcoin’s MVRV declines, indicating possible price drop
  • Social volume of BNB dips as interest may be fading

With its $45.8 billion market capitalization, it is the 5th largest digital currency behind Bitcoin, Ethereum and Tether.

At press time, according to Coingecko, the coin first introduced via ICO in 2017 is trading at $281.40, increasing its price by 3.4% during the last 14 days.

The beginning of October is also looking bright for BNB, as its network has witnessed a number of positive developments that could prove beneficial in its attempt to surge even higher in the coming days.

But experts are now giving words of caution for the asset’s holders as metrics and other indicators might be hinting at a possible trading price drop for the Binance Coin.

BNB Metrics To Pay Attention To

Amid BNB’s fine run, those who own the digital asset should keep a vigilant eye to some of its significant metrics.

For one, the MVRV of the Binance Coin went down last week which meant a bearish signal for the cryptocurrency.

The MVRV is the ratio of an asset’s market capitalization versus its realized capitalization.

Source: Santiment

Moreover, for the past seven days, BNB trading volume also experienced a decline. As of this writing, the coin’s 24-hour volume stood at $924.5 million.

BNB holders should also pay attention to its Relative Strength Index as it put the digital asset in an oversold position.

This could trigger price movement on a downward direction in the days to come.

It is also possible that the crypto community’s interest for BNB is fading, as its social volume also fell.

BNB’s Antidote For Metrics Negativity

While metrics are indicating that the good days might be over for BNB holders, the token still has positive things to lean on to.

For the past seven days, a total of 1.73 million new addresses were registered on the altcoin’s network.

During the same period, the BNB Chain also tallied 3.1 million unique active users, putting the daily average to 778,000.

BNB also accounted for 20.7 million transaction counts as its total locked value (TVL) rose to $5.45 billion.

Finally, there were 1495 BNB tokens burned which meant its circulating supply went down a bit in terms of number.

Currently, BNB coins in circulation are 163, 276,974. The asset’s max supply is 165,116,760.

Crypto total market cap at $907 billion |  Featured image from Finbold, Source: TradingView.com

Shiba Inu: How This Newly Found Support Will Boost SHIB Price This Week

Shiba Inu, a meme crypto like the Dogecoin, was the fastest growing digital coin of 2021. The rate at which the asset grew was mind blowing, especially after it recorded a 46,000,000% price increase.

  • Shiba Inu’s trading price is now its resistance marker
  • SHIB token now priced at $0.00001118
  • The meme crypto is forecasted to end 2022 with a price of $0.00001501

Shiba Inu, a meme crypto like the Dogecoin, was the fastest growing digital coin of 2021. The rate at which the asset grew was mind blowing, especially after it recorded a 46,000,000% price increase.

It attracted a lot of investors and is recognized as one of the reasons a huge percentage of cryptocurrency investors found their way to the market.

It was such a hit back then that it made initial investors that were holding $10 worth of SHIB super rich.

But fast forward to the present, the token is already at a point when some are considering that its era has already ended and crypto experts are not seeing any window for the coin to rise once again.

SHIB is currently changing hands at $0.00001118 according to Coingecko at press time. It already lost 87% of its all-time high value achieved on October 28, 2021.

It has been on a steady decline for the past five months.

Shiba Inu: Breaking Through Resistance

Due to its slump and bearish activity, SHIB turned its support range of $0.00001118 into its new resistance mark.

This meant that for the time being, the token’s price won’t see any upward movement, unless it breaks through the resistance.

Sellers are already at play in the market, initiating the pull towards $0.0000103. If they become successful, Shiba Inu could be facing another immediate decline although it is expected to make a recovery rally soon after.

There was a buying spree from June to August this year courtesy of the SHIBArmy. However, the gains the token got from that activity were trimmed by the sellers that entered and pull the price down once again.

SHIB Seen Rising By End Of 2022

Despite suffering for five months now, all is not lost for the meme token as price predictions for the end of 2022 and the year 2023 point at an eventual price increase.

Source: Santiment

Shiba Inu is in the midst of a metaverse platform deal that is expected to propel token price to $0.00001501 by the end of this year. The lowest price of SHIB at this point is expected to be $0.00001307.

Ever since about the middle of September, SHIB’s social influence has been steadily dwindling. Instead, it showed a tiny increase in price. Despite the traction, this reading reflected the SHIBArmy’s assurance.

Meanwhile, an end to the 2022 bear market by the early part of next year will put the crytpocurrency in a better position.

SHIB is forecasted to trade at a maximum value of $0.00002271 in 2023.

SHIB market cap at $6.4 billion | Featured image from Paper Writer, Chart: TradingView.com

This Little Known DeFi Token Is Attracting Investors – Find Out Here

This DeFi token, which only ranks 138th among cryptocurrencies according to total market capitalization, is starting to make some real loud noise in the crypto space this ‘Uptober.’

Even though the market continues to struggle to recover from its dismal September performance, SUSHI – the native token of SushiSwap – is making impressive leaps over the past couple of days.

At press time, according to data from CoinGecko, SUSHI is trading at $1.33 and has been up by 3.5% for the past 24 hours.

It currently carries a 20.1% price increase for the past seven days while its performance for the past 30 days has been equally impressive, recording a 15.5% uptick in value.

While it is still in the lower ranks of cryptocurrencies due to its $255 million market cap, SUSHI is currently the subject of tremendous interest among investors.

SUSHI Sounds Delectable To GoldenTree

Asset management powerhouse GoldenTree recently announced it has invested $5.3 million to SUSHI – a move that was instrumental for the governance token’s recent bullish rally.

During a SushiSwap forum held last Wednesday, the firm admitted they have been following the digital asset for a while now and that they are more excited about it with the upcoming rollout of their crypto-focused GoldenChain Asset Management Arm.

GoldenTree went on to say that the crypto asset has incredible potential and that it “represents the best of DeFi, both in origin and in community.”

The $50 billion privately owned asset manager has full trust in SUSHI as it iterates and innovates “without artificial barriers to completion.”

DeFi Token No Longer Just A Clone

As a digital token, SUSHI had a hard time earning respect from crypto aficionados as it was created as a copy of Uniswap.

Although it attempted to be better than the asset where it was based through liquidity mining and governance features, the token ended up lagging behind its competitors.

But the $5.3 million GoldenTree investment speaks volumes of how much interest the digital currency is now commanding.

The multi-billion dollar company did not dismiss the challenges that plagued SUSHI in the past but at the same time said they are amazed by the resiliency of the core team and the asset’s community of supporters. 

GoldenTree took notice of the top-tier products that SushiSwap has built and released, becoming one of their reasons for the game-changing investment.

SUSHI market cap at $168 million | Featured image from Japan Centre, Chart: TradingView.com

Bitcoin Cash Price: Investors Must Avoid These Levels To Prevent Losses

Investors, who are keeping a close eye on Bitcoin Cash and want to avoid losses, should steer clear of these crucial price points.

As of this writing, Bitcoin is still showing a little bit of bullishness, despite losing a few digits from its price. BTC retreated below the $20K mark, and now trades at $19,998, according to data from Coingecko.

Short-term support for the bears came from rejection wicks at the $20.5k level. Even Bitcoin Cash, the fork of BTC, isn’t immune to this issue.

BCH is in such a jam, despite Bitcoin losing the $20k psychological support.

There have been recent reports regarding a number of developments with potentially profound implications for BCH. This report indicates that Bitcoin Cash’s transaction volume has been below the average of 27,734 daily transactions.

Lower transaction volumes are a negative indicator to both potential and existing investors for BCH, thus this could be an issue.

Bitcoin Cash: Formidable Wall For The Bulls

Bitcoin Cash’s value fell 35.50% between the July 29 rally and the September 19 low, before rebounding 17.40%. After that time, however, Bitcoin Cash’s price remains stable.

These days, you can buy Bitcoin Cash for as little as $96.559 and as much as $166.025. Furthermore, BCH has a support level at $112.246 and a resistance level at $125,912.

Although CCI and Stoch RSI readings are optimistic, the stated resistance level remains a formidable obstacle for BCH bulls to overcome.

Even though the Chaikin money flow index is optimistic, it is establishing a downward trajectory, indicating that the velocity of selling is increasing.

The CMF index’s gloomy prognosis, on the other hand, is more pronounced on the 4-hour time range.

The 4-hour CMF is -0.05, indicating that sellers are gaining control of the BCH market. Currently, the question is whether BCH can still recover.

Possible Recuperation? Or Further Decline?

The BCH support line stays unchanged. However, there are two levels of resistance that investors and traders should target: $125.912 and $138.835.

Source: TradingView

The former level was breached twice on August 23 and September 9, but the bulls were unable to sustain the break, resulting in a price decline to $112.246.

A breach of the $125.912 resistance can be interpreted as a psychological buy signal for investors. Since the fall on September 13, a modest uptrend is building on the 4-hour time period.

A strong closing in today’s trade could aid the bulls in maintaining momentum and finally surpassing the indicated resistance levels.

BCH market cap at $2.28 billion | Featured image from CriptoFacil, Chart: TradingView.com

Hedera: Investors Should Check Out These Data Before Buying HBAR

Hedera shows lots of potential, despite some major hiccups lately. Investors will be better equipped if they examine some key data before acquiring HBAR.

Here’s a quick look at some important numbers:

  • HBAR currently trades at $0.05798
  • Trading volume currently at $36.2 million
  • Hedera circulating supply at 22.97%

Hedera is a new and revolutionary open-sourced crypto network that utilizes a distributed ledger technology that is designed to allow both developers and users to use DApps.

HBAR Up 2.05% As Of Press Time

HBAR’s development activity has seen tremendous growth in such a short span of time since November 2018. Notably, HBAR has ranked third, next to Polkadot (DOT) and Cardano (ADA).

Hedera is designed to solve the nagging problems in terms of scalability, which is a huge problem among blockchains.

Right now, Hedera is seen to be one of the winners in terms of scalability and security when pitted with other blockchains which is why it remains to be one of the most popular and widely used enterprise-grade blockchain in the world.

According to CoinMarketCap, HBAR, the 39th largest cryptocurrency, trades at $0.05798 or shows a spike of 2.05% as of press time.

With its current price, HBAR is noticeably 91% sidetracked from its all-time high.

Hedera Trading Volume Down 89%

On a year-to-date basis, HBAR has also evidently dropped by 408%. The downtrend of HBAR has started following its daily high that registered at $249.68 million seen on May 12.

The trading volume of HBAR is currently at $36.2 million, showing a decline of 89% since its ATH on May 12.

More so, the circulating supply of HBAR has also plunged together with the trading volume and price. The circulating supply is at 22.97 billion or at 46% since January.

The daily chart for HBAR shows the spike of buying pressure that is growing to date.

Meanwhile, it’s worth noting that HBAR liquidations only made up 0.00001% of the total market’s $52.04 million in liquidations during the past 24 hours.

Coinglass reports that the total value of all HBAR trades in the preceding 24 hours was pegged at $6,615.

HBAR market cap at $1.32 billion | Featured image from Freepik, Chart: TradingView.com

Polkadot Seeing Lots Of Development Activity – But Why Is DOT Stuck In The Cellar?

As a result of the new cooperation by Polkadot with the KILT Protocol, the company’s development efforts have been on the rise.

The latter announced via its official Twitter account that the protocol is currently functioning as a Polkadot interface.

The fact that KILT originally operated as a chain on the Kusama network served as a springboard for their transition to operating as a parachain on the Polkadot network.

In addition, KILT stated that they were the first parachain to successfully migrate their whole network to Polkadot.

As a result of these changes, Polkadot’s rate of development has been on the rise since the collapse in July 2022, and it has now surpassed its previous high point in May 2022.

However, in recent weeks, the network’s native token, DOT, has been underperforming, even as the network as a whole has been doing well.

A Major U-Turn For Polkadot

There is now a trading range for DOT between $6.12 and $6.83. This is the range in which the token has traded since the beginning of the most recent decline, which began on September 18 and continued through September 19.

Although news of the development has been good, the price news has not been as favorable.

As of this writing, DOT is trading at $6.47, up 2 percent in the last seven days, data from Coingecko show.

The consistency of the DOT price may indicate that bulls and bears are competing to have the upper hand.

The intraday bull/bear power indicator is close to equilibrium, indicating that a break may occur shortly.

On a 4-hour timeframe, the momentum is fairly optimistic, although this has yet to develop into a gain. As of the time of writing, DOT is developing a bullish cup and handle pattern, which could indicate an imminent rally.

The fear and greed indicator indicates a gloomy view, which will make such a rebound extremely difficult to achieve.

DOT Recuperation In The Long Term?

DOT bulls might consider the $6.12 support line highlighted previously. This is where the crypto has bounced twice, showing that bulls have the momentum to break through the $6.83 78.60 Fibonacci barrier.

However, the bulls should also be careful, as a breach of the $6.12 support could precipitate a further market decline.

It is essential for the bulls to pursue long-term gains in DOT, as this might gradually drive the price upward.

For the time being, though, investors and traders might utilize the cup and handle pattern to justify their next DOT investment.

DOTUSD pair is now trading at $6.48 | Featured image from Cryptopolitan, Chart: TradingView.com

SAND Has Just Been Added On Binance US – Will It Hit $1 In The Coming Days?

SAND is the native token of the Sandbox metaverse and is used to facilitate gameplay transactions such as purchasing digital land and interacting with user-generated content.

  • Sandbox started out as collaboration between Pixowl and developer Onimatrix
  • Binance listed SAND and is already available for trading on its platform
  • The token is responding positively with this development, trading at $0.86 as of press time

Along with the crypto asset and NFT-type LAND tokens, SAND makes it all possible for Sandbox to give its users the best gaming experience.

Released as a mobile game in 2012, Sandbox started out as collaboration between Pixowl and developer Onimatrix.

Six years later, in 2018, Animoca acquired Pixowl and announced intentions to leverage blockchain technology to create a 3D world and take advantage of token economics and user-generated content.

In August of 2020, an Initial Coin Offering (ICO) was held by Sandbox and was able to raise $3 million that was then used in funding its future operations.

SAND Is Now Binance-Listed

Both Binance U.S. and Sandbox has already confirmed that SAND has been listed by the cryptocurrency exchange.

The token responded positively as it showed a considerable price movement. As of this writing, according to tracking from CoinGecko, SAND is trading at $0.8644.

Its current price is higher than its $0.83 closing price on October 4 when the announcement about the listing was made.

With this development, SAND was able to break free from its slump that put it on a downward trend for some time now.

In fact, various indicators such as Awesome Oscillator (AO) and Relative Strength Index (RSI) are signaling a bullish momentum for the Sandbox token.

Rally To The $1 Mark

After this momentous event for the gaming metaverse, crypto enthusiasts are already looking ahead at what will come next for the token.

Daily time frame trend lines indicate a support level of $0.807 as it struggled to surpass the $1.011 resistance marker for the entire duration of September. Because of that failure, SAND’s resistance lowered a bit to $0.90.

Chart: TradingView.com

In the crypto space, the resistance level refers to the point at which an asset’s price has difficulties increasing.

With that being said, a potential rally towards the highly coveted $1 mark could still be jeopardy. However, if SAND is able to move out of its current trading price range, there is a strong possibility that it will hit is target.

One possible thing that can help the asset to realize this goal is the expected growth in buying activity now that it is already Binance-listed and more potential buyers have access to it.

SAND total market cap at $1.29 billion | Featured image from Cryptopolitan, Chart: TradingView.com

XRP Price Could Get A 23% Boost From This Bullish Formation Breakout

XRP is looking good, as Ripple once again scores a procedural victory in its lawsuit battle against the U.S. Securities and Exchange Commission (SEC) that has been ongoing for almost two years now.

  • XRP gains another key victory in its ongoing legal battle with SEC
  • Altcoin is up by 8.5% for the past seven days
  • XRP on its way to the $0.52 resistance level

On September 29, a ruling for the release of emails and other correspondence authored by William Hinman, former SEC Corporation Finance Division Director, was ordered by a U.S. District Court Judge.

Documents being sought after by the court pertain to a Hinman speech where he stated Ethereum is not a security because it was sufficiently decentralized just like Bitcoin.

Ripple, with this development, has put itself in an advantageous position to win the long-running court battle with SEC.

It would appear that XPR’s price is set to respond accordingly, as it is pointing towards a bullish momentum.

XRP In A Rounding Bottom Pattern

In crypto space, the rounding bottom pattern that is being followed by the XRP coin is a bullish reversal model that is normally seen during bearish market bottoms.

Chart: TradingView.com

It usually signals the exhaustion of sellers that follows a downfall and the regaining of trend control by the buyers that usually trigger recovery rally.

During the third week of September, probably due to the positive sentiment surrounding the Ripple-SEC legal bout, the 6th largest cryptocurrency by market capitalization made a significant rally on its way to a four-month high when it traded for $0.5523.

But such gains were trimmed a bit as XRP, according to Coingecko, is currently changing hands at $0.4881.

Still, even with lower price, the altcoin is doing well, tallying 8.5% increase for the past seven days and has been up by 7.1% for the past 24 hours.

XRP Taking A Short Break

Bitcoin’s tendency to waver at the $18,300 support level is triggering effects on majority of altcoins including the XRP.

As for the anticipated bullish rally that comes with the rounding bottom pattern, it can be inferred that the digital asset’s price is taking a short movement break, consolidating at the $0.48 mark at the moment.

It will take substantial volume in order for the expected uptrend to commence. If such condition is met, XRP price is seen to grow by 10% and hit the significant resistance level of $0.52.

The Ripple-owned token is staring at key resistance levels between $0.52 and $0.58. Meanwhile, traders are also looking at support levels of $0.44 and $0.382 for the digital asset.

XRP total market cap at $23.9 billion on the daily chart | Featured image from Cryptopolitan, Chart: TradingView.com

Solana Spikes 4% After Recent Recurring Glitches – A Little Shine For SOL?

There has been some criticism about Solana since it was established in March of 2020. Through a thread he created, Cyber Capital founder Justin Bons exposed the network’s recent “anomalies.” and how it violated decentralization in the sense of DeFi.

The native token of the network had a bullish pullback despite the controversy. Given the fundamental nature of some of the conflicts in which the Solana network finds itself embroiled, this comes as something of a surprise.

Is this price drop a precursor to future gains?

The Barrier To Confusion

At the moment, Bons is the most outspoken Solana critic, having started multiple threads concerning the most recent network developments.

Solana has had many outages this year, the most recent being on October 1, according to his latest thread.

This is a serious issue for the network, since it might undermine trust in the project and its token among investors.

Chart: TradingView.com

An issue with a single validator on Solana’s blockchain led to the outage. As a result, the entire blockchain came to a halt, rendering all transactions suspended for a short time.

The management of Solana then utilized check-pointing to restart the entire cluster. In this way, they broke the decentralization of their ostensibly decentralized system.

Additionally, the developers are the target of the thread. According to the discussion, two network developers posed as 11 other network developers. These two developers then double-counted to increase the TVL figure.

Despite recent issues, SOL gained about 8% during the 3rd and 4th of October, before establishing a downtrend earlier today.

What Does This Imply About Solana?

As of this writing, SOL is trading at $33.35, up 4% in the last 24 hours.

Indicators also present a negative narrative. The bull and bear power indicator has maintained its downward trend, sending investors and traders strong sell indications. Similarly, stochastic RSI values follow this signal, indicating a strong sell sentiment among investors.

This could be a harbinger of worse to come for SOL. Today’s forming downtrend could be the beginning of the token’s free fall.

If things are to worsen significantly, the price should not fall below the 78.60 Fibonacci level, as any negative breach of this level will cause a further sell-off.

SOL total market cap at $11.8 billion on the daily chart | Featured image from Coinpedia, Chart: TradingView.com

Bitcoin Price Soars This ‘Uptober’ As BTC Barrels Past $20,000

As Bitcoin passes $20,000, the market is expecting a strong October. The crypto is now trading between $19,712 and $20,479 at the time of writing.

Since the crash of September 13 rattled the global financial system, this is the highest trading price BTC has reached.

As BTC bulls have been trying to break through this resistance level for almost a month, the breaking of the $20k psychological barrier is a major event.

To those looking to acquire Bitcoin or add to their existing holdings, however, the breakthrough may serve as a powerful buy signal.

Perhaps this market uptick is what the cryptocurrency industry needs to end the crypto winter.

Taking The Bull By The Horns

CryptoQuant claims numerous indicators can provide reliable buy indications for traders. Depletion of foreign-exchange reserves is one such factor.

Decreased Bitcoin exchange reserves are an optimistic indicator since it suggests an increase in Bitcoin purchases.

A shift in the outflow of foreign exchange is always a consideration in this context. On October 4, the value of the exchange outflow was $47,655.83.

A high number for this indicator indicates reduced Bitcoin selling pressure. The fear and green index is also rising, offering investors and traders strong buy signals.

A rising RSI value may indicate an increase in investor confidence due to recent developments in the cryptocurrency market or the psychological resistance level of $20,000.

Chart: TradingView.com
Extended Accumulation In The Offing

Bitcoin’s price increase is not unexpected. Recent reports indicate that Bitcoin is witnessing a prolonged accumulation.

Since September 27, the number of Bitcoin addresses holding between 100 and 10,000 Bitcoins has surged dramatically.

As of this writing, the 7-day moving average is providing dynamic support for Bitcoin’s ascent. Current support is located at $18,548, with resistance at $20,473.

With the current flow on the bullish side, we may anticipate a price increase in the coming days. Meanwhile, Bitcoin is still fighting to surpass the $20,472 resistance level.

A breach of this price level will eventually drive the price over the 78.60 Fibonacci retracement level, which is located at $21,229.

BTCUSD pair loses $20K handle, now trades at $19,954 on the daily chart | Source: TradingView.com

Featured image from Fintwit, Chart: TradingView.com

Polygon Spikes 6.5% In Last 24 Hours As MATIC Investors See Bullish Momentum

Polygon (MATIC) is currently having a rally of its own as it recovered from its range low of $0.721 recorded last September 22.

  • MATIC is the only asset in top 20 cryptocurrencies to record double-digit gains for the past week
  • Buyers are back and so is the buying pressure, propelling the asset to go higher
  • Polygon now has two versions of SynFutures mainnet

At press time, data from CoinGecko shows the crypto is trading at $0.837 and has been up by 13.1% for the last seven days.

Among the top 20 cryptocurrencies based on market capitalization that includes Bitcoin, Ethereum, XRP and Cardano, MATIC is the only one to register double-digit price increase for the past week.

Source: Coingecko

Analysts believe that this bullish rally now indicates that buyers are back, exerting tremendous buying pressure causing the asset to climb higher for the past days.

Polygon Uptick Has Other Reasons, Too

The month of October this year is starting to shape up as a friendly one for cryptocurrencies, paving the way for bounce-backs of different levels.

Bitcoin, for example, currently changes hands at $20,237 while altcoin king Ethereum is trading at $1,354.

Both assets are performing better compared to how they did last month.

While the recovery of the pack leaders may contribute for Polygon’s rally, there seems to be other reasons that fuel this run.

A quick glance at MATIC’s market value to realized value (MVRV), which currently stands at 1.924%. 

This suggests that investors are putting faith in this bullish run in hopes of gaining profit this month of October.

An asset’s MVRV can be utilized to determine if price is above or below fair value in order to measure market profitability.

MATIC Joins Elite Company As Polygon Gets Busy

A recent report released by Santiment mentioned MATIC as one of the digital currencies that are registering increase in unique network addresses.

It ranks the crypto 5th behind Bitcoin, Ethereum, Litecoin and Tether.

This could mean investors are finally paying more attention to the carbon-neutral project, potentially triggering the recent uptick, which at one point reached 6.5% in a span of 24-hours.

Polygon is also not lacking in network activity as it becomes busy amid its token’s resurgence.

The second version of SynFutures mainnet was recently launched on the MATIC network, making it the first ever system to do so.

This is good news for investors, as it will give them more chances of accessing derivative market by utilizing the SynFutures protocol.

MATIC total market cap at $7.24 billion on the daily chart | Source: TradingView.com

Featured image from Zipmex, Chart: TradingView.com

Celsius Investors May Be Left Dismayed As CEL Drops 6.5% In Last 7 Days

To everyone’s surprise, the Celsius Network is still operating after the drama surrounding its bankruptcy in July. Alex Mashinky, the company’s CEO, quit on September 27 despite the announcement of a revival.

The Securities and Exchange Commission joined the chorus of agencies that came down hard on the company. When the SEC ruled that interest-paying crypto investments must be registered, Celsius found itself under a microscope.

The native token of Celsius, CEL, was impacted by these events, but what’s more unexpected is that CEL is still being used. However, investors of CEL tokens will be even more dissatisfied now that controversy surrounds the token.

As of this writing, CEL is trading at $1.37, down 6.5 percent in the last seven days, data from Coingecko show.

A Chill In The Air At Celsius

Unlike most widely traded currencies, trading in CEL right now is extremely light, as evidenced by the gaps in the candle chart. Recent data shows a decline in CEL token trading volume from 19.8 million to 4.49 million. The percentage reduction in business activity was staggering, at 77.3%.

This is hardly surprising given that other on-chain signals also do not bode well for CEL. The market capitalization has decreased from a weekly high of $655,331,055 to $582,698,525. The coin’s trading activity is comparable to tokens with minimal activity.

This is simply CEL burning off over time. Recently, though, the graphs are green.

Is It Doable, Or Not?

CEL is still a tradable asset on the broader crypto market, making it open to speculation despite the fact that it is barely alive.

According to CoinGecko, CEL has gained 2.6% in value over the previous 24 hours. Given that there are gaps in the charts where little to no activity was recorded, this is a major surprise. However, this may not be a true recovery.

Taking into account everything discussed previously, CEL may be on its last legs. Recent reports indicate that CEL’s active addresses have drastically decreased during the past month.

This decline in active CEL trading addresses is a pessimistic indication to potential investors that could boost CEL’s price recovery.

CELUSD pair trying to keep its balance at $1.36 on the daily chart | Source: TradingView.com

Featured image from Forkast, Chart: TradingView.com

Uniswap Rally Could Be In Jeopardy, Despite UNI’s Solid Social Engagement

Uniswap (UNI) started with a bearish stride in 2022 along with Ripple and most other cryptocurrencies but it has been gaining some impressive price action as seen in the past few weeks.

  • UNI’s social engagement up by 53.62%
  • Supply of unique wallet addresses surged since September 12
  • UNI price looking bullish; up by 4.15%

According to CoinMarketCap, UNI’s price has been looking bullish and spiked by 4.15% or trading at $6.77 as of this writing.

UNI Shows Impressive Social Dominance

More so, UNI has been outperforming other cryptocurrencies when it comes to its social metrics. UNI’s social engagements have spiked by 53.62% while social mention has grown by 62.15%.

In the past couple of weeks, Uniswap is seen to gain social media dominance plus also improved in terms of development activities.

In addition, Uniswap’s weighted sentiment is positive as shown from September 28 to September 30. On the other hand, the weighted sentiment dropped immensely as witnessed on October 1.

As a consolation, the development activity of UNI has grown rapidly since last week or September 29 and has been fairly consistent ever since.

The impressive uptick in terms of development activity is said to be triggered mainly by the network’s Swap widget update.

Chart: Santiment

These continuous advancements and upgrades are said to be hinting at a bull run and attract more investors.

On the other hand, despite the recent UNI updates, it has not helped its TVL as it has been stuck on the same level since September. The thing is, even if the whales were dubious of Uniswap’s DeFi protocols, users are gaining more interest in UNI.

Meanwhile, the top wallet addresses were also seen to surge in terms of supply since September 12, especially since whale interest is very important for the token’s progress.

Uniswap Velocity Down In Last 7 Days

On the downside, UNI’s velocity is seen to drop in the past couple of days implying a reduced number of wallet addresses.

UNI price has dipped in the past two weeks as precipitated by the market turmoil triggered by the inflation happening around the world but it is seen to currently recover a bit.

Meanwhile, it is said to get even worse as predicted by many crypto analysts after the coin has dropped by as much as 72.56% over the past year.

UNI’s moving averages witnessed a bearish movement specifically at its 100-day EMA and SMA saw at $5.62 and $5.66; respectively.

Its RSI is currently at 43.66 which signifies a spike in sell action and shows that investors may potentially lose more in the coming days.

With that being said, the sentiment of analysts on Uniswap is generally negative, especially with its lack of significant utility value.

UNI total market cap at $5.17 billion on the daily chart | Source: TradingView.com

Featured image from Cryptopolitan, Chart: TradingView.com