Injective Votes On Major Upgrade To Make INJ Even More Deflationary: Will Prices Recover?

Injective Protocol, a blockchain for decentralized finance (DeFi) and derivatives trading, is voting on a proposal to significantly reshape the platform’s tokenomics and introduce a new era dubbed Injective 3.0.

According to Injective, through a post on April 19, the proposal is now open for voting via the Injective Hub. For the next four days, stakers and validators are free to participate. 

Community Voting On Injective 3.0

Over the months since launching in 2023, Injective caught the crypto community’s attention. The team aims to launch a platform for users to launch DeFi-focused protocols in a low-cost, scalable, and yet Ethereum-compatible environment. Though INJ, the native currency of the platform, remains one of the top performers, changes introduced by Injective 3.0 will likely push prices even higher.

According to developers, Injective 3.0 aims to make INJ a deflationary asset. A big part of this will be to reduce token minting by controlling the rate of token creation. If the community approves what’s laid out in the proposal, the team will change on-chain parameters to slow down token minting. 

At the same time, Injective 3.0 plans to make INJ’s inflation rate more responsive to staking. Under this model, inflation will slow down as more INJ is locked away via staking, making the coin scarcer. 

Proposers predict the network to be more robust and secure if INJ becomes more deflationary. Usually, token prices of scarce assets tend to be higher. However, it should be noted that changes to tokenomics don’t immediately lead to favorable price repricing. For prices to soar, there must be utility, driven mainly by community interest.

Millions Of INJ Burned, Will Prices Break $30?

Injective 2.0 is currently live following its activation in August 2023. Under the current regime, there is a token auction burn, where decentralized applications (dapps) running on the platform are free to participate in token burning. According to the Injective Protocol, over 5.9 million INJ have been withdrawn.

Injective price trending downward on the daily chart | Source: INJUSDT on Binance, TradingView

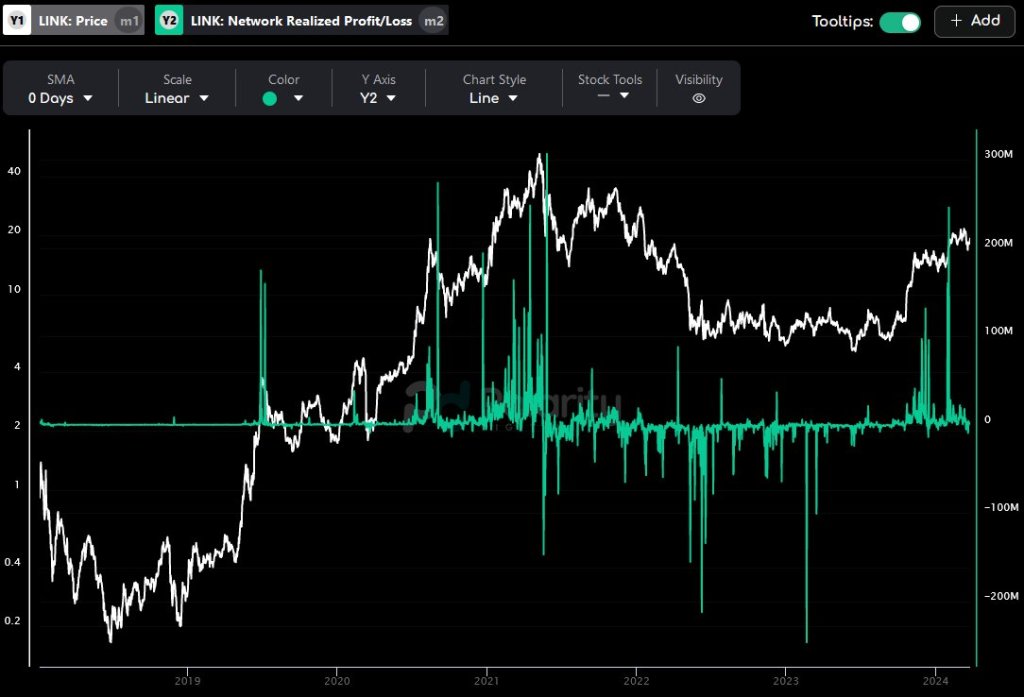
So far, INJ remains under pressure, sliding down, shedding 50% from March 2024 highs. The coin has been moving horizontally in the past few trading sessions. However, it is under immense selling and within the April 12 bear bar.

The level at $30 is a crucial resistance level. Conversely, if INJ prices dip below this week’s lows at $23, the coin will slip towards April 13 lows of around $18.

Bitcoin: Expect The Unexpected – Analyst Sees Unconventional Bull Run Post-Halving

Bitcoin has been moving lower ahead of the Halving event, going against analysts’ expectations. This price action has been unexpected and shows how the coin tends to go against predictions, basically charting its path. 

Bitcoin Breaking The Mold

In light of Bitcoin’s randomness, especially in the past few months following the approval of spot exchange-traded funds (ETFs), one analyst expects the coin to continue defying expectations by clocking in a bull run that defies historical trends.

4-year simple moving average for Bitcoin | Source: Analyst on X

The analyst cites two recent instances where Bitcoin defied expectations to justify this bullish outlook. First, following the rapid expansion in the 2020 to 2021 bull run that saw Bitcoin soar from less than $10,000 to fresh all-time highs of around $70,000, prices sharply contracted in 2022. 

Then, the United States Federal Reserve shifted its monetary policy to curb raging inflation by rapidly increasing interest rates. Following this and other market-related events, Bitcoin prices dipped below the all-time high of the previous cycle of $20,000.

By November 2022, prices fell to as low as $15,000, accelerated by the collapse of FTX. This retest of previous highs and fall below $20,000 had never happened before. 

Another anomaly occurred last month. For the first time, Bitcoin prices expanded and broke the previous all-time highs of around $70,000 before the Halving event. As Bitcoin’s past price action shows, prices only rally to fresh all-time highs after Halving.

However, this changed when BTC soared to $73,800, possibly paving the way for bulls to join in and push the coin back to unchartered territory post-Halving. 

Is BTC Ready For A Multi-Year Rally?

With this in mind, the analyst believes Bitcoin will continue uniquely shaping its path, deviating from history. For instance, the analyst thinks BTC will outperform altcoins in the coming months.

The analyst adds that increased regulatory scrutiny following high-profile collapses like FTX and Luna could dampen altcoin enthusiasm. 

The coin will ride on the fact that it is the only one with an ETF from the United States SEC receiving investments. As a result of this capital injection, Bitcoin will likely register a multi-year “up only” phase, just like gold did once its ETF was approved.

Bitcoin price trending sideways on the daily chart | Source: BTCUSDT on Binance, TradingView

Prices remain depressed ahead of this. Though prices are increasing at spot rates, the coin is within a bear formation. Currently, BTC has local resistance at around $65,000.

Arbitrum Launches Fraud Proofs In Testnet: Why Is ARB Down?

Arbitrum, the largest Ethereum layer-2 scaling solution by total value locked (TVL), is taking steps towards decentralization. In an update on April 16, Offchain Labs–Arbitrum developers–said they have deployed the permissionless version of their fraud proofs, dubbed Bounded Liquidity Delay (BOLD), to testnet.

Ethereum Layer-2s Are Popular, But There Is A Big Problem

Ethereum layer-2 solutions have been gaining prominence over the years. According to L2Beat data on April 17, these platforms control over $37 billion of assets. Protocol developers and users can send transactions cheaply through Arbitrum, Optimism, Base, and other alternatives. 

Top layer-2 platforms by TVL | Source: L2Beat

However, while they are popular and command billions in TVL, most of these platforms’ fraud proofs are being developed. Typically, when users transact all chains, all transactions must be confirmed by a web of miners or validators, depending on the consensus mechanism. 

This differs in layer-2 options, which must reroute transactions and process them off-chain. There is no way of proving whether queued transactions are valid before being batched and confirmed on-chain.

The fraud proofs, such as those presented by Arbitrum and other optimistic rollup solutions, are designed to address a critical issue in layer-2 solutions. Specifically, once live and integrated into Arbitrum, BOLD will serve as a safety net, ensuring the validity of transactions processed off-chain. This mechanism is crucial in maintaining the integrity of transactions while enabling efficient off-chain processing.

In compliance with blockchain principles, BOLD will be decentralized. As such, the community will run nodes, which differs from the current setup. As it is, transaction validation in Arbitrum is centralized, and only a few validators are tasked with this.

Arbitrum Deploys BOLD In Testnet, ARB Prices Falling

With BOLD in the testnet, Arbitrum is opening up its rails so that anyone can participate in network security and validate withdrawals back to Ethereum. This move will be critical in building a more decentralized ecosystem and making the platform more robust.

Arbitrum becomes the first Ethereum layer-2 to launch its fraud proofs in testnet. In a post on X, Ryan Watts of Optimism also notified the community that plans are underway to create a decentralized fraud-proof system for the second-most largest layer-2 by TVL.

ARB prices trending downward on the daily chart | Source: ARBUSDT on Binance, TradingView

Even with this major milestone, ARB prices are stable and under pressure.

Related Reading: Crypto Analyst Says Don’t Buy Altcoins Just Yet – Here’s Why

The token is down 50% from March 2024 highs at spot rates and remains under immense selling pressure. If buyers reverse the April 12 and 13 sell-off, the token might recover strongly, racing towards $1.5.

Bitcoin Analyst Set Sight On $79,591: Urges Traders To Be Patient

While Bitcoin prices hover around 15% below their all-time highs, with some skeptics predicting more losses, one analyst on X expects the coin to bounce strongly, even breaking above all-time highs.

Taking to X, the trader argues that Bitcoin has yet to breach the Golden Ratio Multiplier’s Cycle Top, currently sitting at $79,591. Supposedly, the analyst continues, this target price increases the longer it remains unchallenged. 

Bitcoin price action favors bulls | Source: Analyst on X

Bitcoin Traders Need To Be Patient

So far, BTC is trending lower and is technically within a bear breakout formation following sharp losses on April 13. As the coin struggles for gains and is boxed inside the bear bar, the odds of further upswings like those registered in Q1 2024 remain muted. 

However, even as BTC bulls are muted, the analyst emphasizes the prices are “respecting data points” despite prices dumping lower and taking longer to break higher.

Most traders expect prices to rise higher following March 2024’s impressive surge. However, the analyst believes traders need to have patience.  

Bitcoin price trending downward on the daily chart | Source: BTCUSDT on Binance, TradingView

Looking at how BTCUSDT prices are unfolding, it is clear that momentum is fading, and participation is low. CoinMarketCap data shows that trading volume on the last day is flat, at $46 billion. 

Overall, trading volume–a measure of engagement and trader interest– has dropped since mid-March, when the coin soared to all-time highs of approximately $74,000.

Whales Are Keeping Off From The Market

Parallel data from IntoTheBlock reveals that addresses holding at least 0.1% have also been slowing down in their accumulation, making the drop even more severe.

According to a CoinDesk report, when BTC fell on March 19, prices bounced strongly on March 20 following aggressive buying pressure whales. IntoTheBlock data showed they bought 80,000 BTC, forcing prices back to over $71,000.

Technically, by tracking whale movements, traders and investors can gauge overall market sentiment and their confidence for gains. This, in turn, could impact the sustainability of trends.

Their heavy involvement could precede sharp price gains, lifting the broader crypto markets. The fact that whales appear to be keeping off could suggest that they expect prices to drop even more. 

Moreover, other factors, such as the pace of inflows into spot Bitcoin exchange-traded funds (ETFs), point to a bleak future. CryptoQuant data shows that inflows have been stagnant in the past trading week. At the same time, IBIT, the spot BTC ETF offered by BlackRock, has been the only product out of the eight registering inflows.

Bitcoin Readying For A 12-Year Bull Run To $650,000 If Bulls Take Charge: Analyst

Even with Bitcoin prices facing pressure from sellers, Willy Woo, an on-chain analyst, thinks the coin will reach new highs thanks to the launch of new Bitcoin exchange-traded funds (ETFs). In a post on X, Woo said the coin could soar to as high as $91,000 in a bear bottom but soar to as high as $650,000 in a bull market top.

However, Bitcoin will only soar to these mega valuations, assuming that leading asset managers will fully deploy their recommended allocations to the world’s most valuable crypto asset.

Bitcoin In A Wide Range

At spot rates, Bitcoin looks shaky. Even after the surge to all-time highs of over $73,000 in mid-March 2024, the coin has been under pressure. So far, prices are within a range. There are caps at $73,800, or an all-time high, on the upper end and around $61,000 on the lower end of its current range. 

As long as prices are inside this zone, the uptrend remains. This preview considers the formation established in the better part of Q1 2024 after the first spot of Bitcoin ETFs in the United States was approved.

Bitcoin price trending upward on the daily chart | Source: BTCUSDT on Binance, TradingView

In the post on X, the analyst should note that the rise to $91,000 and $650,000 are long-term targets and not for the current market cycle. Most importantly, Woo added, it will depend on how fast and aggressively asset managers like BlackRock add BTC to their diversified portfolios.

Even so, this projection excludes inflows from non-custodial wallets. Capital flows from these wallets are projected to be higher due to rising crypto adoption.

Here’s How BTC Will Soar In The Coming Years

In Woo’s assessment, asset managers manage around $100 trillion globally. If they decide to invest 2% of their holdings in Bitcoin as Fidelity recommends, the asset could receive around $2 trillion. Additionally, considering the coin’s value, based on on-chain movement, worth around $561 billion, the total investment would reach $2.56 trillion.

Using the Market Value to Realized Value (MVRV) ratio, Woo said BTC could soar to a market high of $650,000 in a bull cycle. The MVRV is a metric that compares market capitalization to on-chain investment.

Conversely, BTC could reach a swing low of $91,000 if the crypto market crushes. The MVRV ratio is typically 5X in bull market tops and 0.7X in bear market bottoms.

Woo thinks Bitcoin, like gold, is ready for a 12-year bull run. Even so, adoption and emerging regulations in Europe and Asia will shape the path to $91,000 and $650,000.

Bitcoin “Looks Healthy” After 2 Months, Backs BTC To Rally Above $74,000

Bitcoin, one analyst notes on X, is looking healthy for the first time since the coin soared to over $70,000, printing all-time highs back in March 2024. The assessment is due to funding rates dropping to within ordinary levels, an indicator that volatility is also falling and moments of fear of missing out (FOMO) are fading. 

BTC funding rate is dropping | Analyst on X

Funding Rates At “Normal Levels” As FOMO Dissipates

In crypto perpetual trading, the funding rate is the fee exchanged between market participants. These fees are market-determined and are adjusted every eight hours or so. 

Depending on market conditions, they can be positive or negative. However, they play a critical role in determining momentum. Of note, bulls pay a fee to bears When perpetual prices are higher than the spot price. This, in turn, discourages buying in the perpetual market and incentivizes buying into the spot, bringing prices closer. 

Whenever prices rally, as has been the case since the start of the year when Bitcoin has generally been in the green, those who enter long have to pay sellers to keep prices from deviating, as mentioned above. 

However, at spot rates, the rate leveraged buyers are paying is slightly lower as FOMO drops. Once prices rapidly expand, ideally above March 2024 highs, this funding rate will likely increase to February and March 2024 levels.

Bitcoin price trending upward on the daily chart | Source: BTCUSDT on Binance, TradingView

So far, Bitcoin is changing hands above $70,800 at spot rates and within a bullish formation. Of note is that buyers are in charge of reversing losses posted on April 8. 

Even so, for the uptrend to remain, prices must break out above $72,500 and the April 8 high on rising volume. BTC will likely float to over $73,800 and enter price discovery in that case.

Bitcoin Rises After CPI Data In The United States, Institutions Pouring In?

With FOMO dissipating and “normalcy resuming,” the analyst said the coin is now better positioned to soar higher, backed by organic momentum generated from market participants. After dipping slightly on April 9, the coin rose following positive news about the Consumer Price Index (CPI) in the United States. 

While the “hot” CPI pushed other assets lower, Bitcoin prices bounced to spot levels. Experts say the coin might benefit as risk-averse traders shift to safe-haven coins to shield their value from raging inflation.

Beyond this, analysts expect demand for spot Bitcoin exchange-traded funds (ETFs) to rise in the months ahead. As institutions pour in, buying shares of spot BTC ETFs issued by players like Fidelity, the demand for the underlying coin might soar to fresh levels, lifting prices. Moreover, some analysts are bullish, saying prices will benefit once GBTC stops offloading coins. 

Bitcoin Tumbles on Hot CPI Data, But This Analyst Stays Ultra Bullish: Here’s Why

The better-than-expected United States Consumer Price Index (CPI) released on April 10 is already sending shock waves through the financial market. Bitcoin and most crypto assets are trading lower, extending losses recorded on April 9, weighing negatively against optimists.

United States CPI Data Came In Hot

According to Trading Economics data on April 10, CPI, a key economic metric for gauging inflation, rose 0.4% in March, pushing the annual inflation rate to 3.5%. Notably, this surpassed economist predictions and, most importantly, dashed hopes for the United States Federal Reserve (Fed) to slash rates aggressively this year.

United States CPI data | Source: Trading Economics

However, amidst the market jitters, Matt Hougan, the CIO of Bitwise Asset Management, offered a contrarian perspective as fear permeated the Bitcoin and crypto market. In a post on X, Hougan downplayed the influence of the CPI data on Bitcoin’s long-term trajectory. 

The executive argues that investors and traders should track other market factors like spot Bitcoin exchange-traded fund (ETF) inflows and rising government deficits. In Hougan’s assessment, these can strongly influence price, even lifting Bitcoin higher since they are currently aligned.

Time To Buy The Bitcoin Dip?

As such, even with the fall in BTC, the drop could offer potential buying opportunities for long-term holders. Some supporters believe the “hot” CPI data only exposes the vulnerabilities of fiat currencies. This would potentially drive investors to use Bitcoin as a hedge. 

Moreover, this upbeat sentiment is backed by solid demand for gold, a store of value asset preferred by traditional finance investors. Analysts anticipate Bitcoin will follow a similar path as investors seek to protect value amid rising inflation.

Further bolstering the bullish sentiment is the possibility of a spot Bitcoin ETF launch in Hong Kong before the end of April.

The Hong Kong Securities and Futures Commission (SFC) has been assessing various applications. Leading Chinese asset managers have submitted some. If the product is approved, it could further channel more capital to BTC, boosting inflows from the United States.

Bitcoin price trending sideways on the daily chart | Source: BTCUSDT on Binance, TradingView

When writing, BTC is steady but under pressure. April 9’s losses have been confirmed. The coin might track lower if bulls fail to push prices above all-time highs of around $74,000.

Bitcoin remains in a broader bullish formation, technically moving inside a rising wedge. This bullish outlook will only be invalidated if prices tank below $61,500 in the sessions ahead.

Bitcoin To $150,000 Is “Programmed” With Halving Approaching: Analyst

With Bitcoin ripping higher and closing in on breaking all-time highs, one analyst on X thinks $150,000 post-halving is “programmed.” The analyst remains upbeat in a post, highlighting several fundamental developments that could drive the world’s most valuable coin to new valuation and more than 2X from spot rates. 

Currently, the path of least resistance remains northward. Buyers have shaken off the bears of the past trading month, finding anchor from the March 20 bull bar.

On April 8, the coin soared above the key liquidation level at around $71,800. Bitcoin has since cooled off, but the leg up remains, and it may form the basis of another breakout above $74,000. 

Bitcoin price trending upward on the daily chart | Source: BTCUSDT on Binance, TradingView

For bulls to be firmly in control and align with the analyst’s outlook, there should be a follow-through of the April 8 surge, ideally with rising trading volumes. This could catalyze demand, even placing Bitcoin above $74,000 and fresh 2024 highs before the highly anticipated Halving event.

Eyes On Bitcoin Halving: A Supply Squeeze In The Making?

As the analyst explains, the “Halving” event is a crucial catalyst for this potential surge. Less than ten days away, this event is a protocol-driven occurrence that will see the network reduce block rewards to 3.125 BTC, down from the current 6.25 BTC.

This reduction, combined with sustained demand, will likely create a scarcity of Bitcoin, potentially driving up its price.

Bitcoin halving countdown | Source: Coinwarz

Ahead of Bitcoin’s Halving, the analyst said the amount of BTC held by exchanges is dwindling. To illustrate, Coinbase’s holdings stand at a six-year low. However, this is not an isolated event; data shows that major exchanges like Binance are seeing decreasing supply.

At the same time, over-the-counter (OTC) desks, which handle large, private cryptocurrency transactions, are reportedly running low on Bitcoin, indicating strong institutional demand. This suggests a potential supply squeeze set to only worsen in the coming months. 

Impact Of Spot BTC ETFs: London, Hong Kong In The Picture

Already, spot Bitcoin exchange-traded funds (ETF) issuers, the analyst added, are on a buying spree, gobbling up over $300 million of BTC every day. Since these issuers are acting on behalf of investors, both retail and institutions, they are actively infusing capital into the market, a huge boost for prices.

It should be noted that the surge from Q4 2023 to early January was primarily because of the anticipated spot Bitcoin ETFs. The spillover effect and the billions flowing into the asset make BTC more liquid and resilient against aggressive sellers.

Spot BTC ETF tracker | Source: Lookonchain on X


Additionally, the London Stock Exchange plans to list exchange-traded notes (ETNs) backed by Bitcoin in Q2 2024. Like the spot ETFs in the United States, this product will inject liquidity into the market and legitimize the coin as a worthy asset class, similar to gold.

In Asia, the Securities and Futures Commission (SFC) of Hong Kong will likely approve multiple spot Bitcoin ETFs. Some of the noteworthy applicants include leading Chinese asset managers.

Bitcoin Can Reach $140,000 After This Rare Signal Prints: Analyst

Bitcoin may be hovering below its all-time highs, but analysts are turning bullish based on a rare chart formation. Taking to X, the analyst observed that BTC has closed two consecutive months above the upper Bollinger Band on the monthly chart. 

Bitcoin rides the Bollinger Bands | Source: Analyst on X

A Rare Bollinger Band Signal Prints: BTC To $140,000?

The analyst said that historically, when Bitcoin closes two consecutive months above the upper Bollinger Band on the monthly chart, prices tend to double within three months. If this pattern holds, Bitcoin will surge to over $140,000 by July 2024, just three months after the Bitcoin halving event.

Bitcoin is trading below $73,800, the all-time high registered in March 2024. However, after weeks of lower lows, the sharp recovery earlier on April 8 suggests buyers could be flowing back. At press time, the coin is changing hands above $71,800, convincingly breaking above the liquidation level of around $72,000. 

Bitcoin price trending upwards on the daily chart | Source: BTCUSDT on Binance, TradingView

Despite the bullish breakout, whether the uptrend continues remains to be seen. Of note is that BTC prices tend to collapse before the Halving, which is set to take place in the coming weeks, dumping to as low as 20%. BTC fell after peaking at $73,800, dropping to around the $60,000 level before snapping back higher to current levels.

A refreshing close above $74,000 might form the basis of even more gains in the days ahead, perhaps towards $100,000 in the weeks ahead.

BTC might breakout | Source: Analyst on X

Another analyst suggests that Bitcoin could rally to $140,000 within four weeks, especially if it follows a similar price pattern to December 2020. After breaking above the $20,000 high of 2017, Bitcoin continued to rally, peaking at around $70,000 for a nearly 3X surge.

Currently, buyers are eyeing the $74,000 mark and the all-time high. If this level is surpassed, as it was in late 2020, the possibility of Bitcoin at least doubling to $140,000 becomes more likely.

Will Halving, Macroeconomic Factors, And Spot ETFs Drive Prices?

The current bullish sentiment might continue. Possible drivers include interest in spot Bitcoin exchange-traded funds (ETFs). So far, billions have been channeled to these products, lifting demand and thus prices. The upcoming Halving event could further buoy demand, lifting prices even higher in the coming months. 

Beyond Bitcoin-driven fundamentals, analysts are also looking at market events, especially in the United States. Some speculate that the United States Federal Reserve (Fed) might not slash interest by at least three times this year as labor conditions become firm and inflation slows down.

If the Fed reduces interest rates, reversing their hawkish outlook, BTC could lead other safe havens in an uptrend.

History Favors Bitcoin Bulls Despite Crypto Hedge Funds Increasing Shorts

Bitcoin may be dripping lower at spot rates. Still, one analyst is unfazed, expecting the coin to reverse recent losses and snap up firmly before peaking in December 2024. At spot rates, BTC is down roughly 11% from 2024 peaks and struggling to generate sufficient buying pressure, looking at the formation in the daily chart.

Will History Support Bitcoin And Rally To Fresh Highs?

Taking to X, the analyst highlights historical price patterns using the 2-week Fisher Transform indicator, a tool for picking out potential reversal zones like double tops or bottoms. Though the technical indicator lags, it has accurately picked out peaks in the past. 

In 2021, when Bitcoin soared to over $69,000, the Fisher Transfer indicator printed a signal, highlighting potential peaks. In the coming weeks following this signal, prices crashed. 

Fisher transform indicator on BTC | Source: Analyst on X

By the end of 2022, Bitcoin had fallen to as low as $16,000, accelerated by the collapse of FTX and the bankruptcy of several other popular crypto hedge funds, including Three Arrow Capital (3AC).

The analyst also emphasizes the importance of the indicator in differentiating between a double top, mirroring 2017 and 2021, and a potential single peak later this year. 

Bitcoin prices trending sideways on the daily chart | Source: BTCUSDT on Binance, TradingView

Presently, the trader said prices are approaching 2017 levels. Then, prices created what the analyst described as a “more subtle initial rise” before peaking six months later at over $20,000. 

If this leads, and the indicator “pauses” where it is, Bitcoin will likely record a “single top.” However, only time will tell where this top will be at.

Hedge Funds Were Selling At Tops?

This prediction comes amid significant bearish bets by leveraged hedge funds. Data from the United States Commodities Futures Trading Commission (CFTC) reveals that these funds held record “short” positions in Bitcoin futures contracts by last week. 

Observers note this was the largest short position since 2017, at over 16,000 contracts. By shorting, they expected prices to dump, which is precisely what’s happening at spot rates. 

However, even as hedge funds short, another analyst, responding to the trend, said the futures premium remained high. This is a development that some of these crypto hedge funds are taking advantage of.

The number of shorts could increase in the days ahead as United States Federal Reserve officials appeared to be hawkish and upbeat economic data started pouring in. Being a data-driven central bank, the Federal Reserve might not slash rates as fast as initially projected.

Bitcoin: Will This “Dry Powder” and Historical Trends Fuel A Price Boom?

While Bitcoin has dipped from its recent highs of around $74,000, some analysts are urging investors to stay calm and even see this as a buying opportunity. So far, Bitcoin prices have remained under pressure, trickling lower in the past trading week.

Are There Similarities With The Bitcoin Bull Run Of 2020?

Though the downward momentum is slowing down, and there has been no confirmation of the April 2 dump, the failure of bulls to convincingly flow back and drive the coin above $71,000 remains a concern for some traders. 

Bitcoin price trending sideways on the daily chart | Source: BTCUSDT on Binance, TradingView

Even so, taking a bullish stand, one analyst on X compares the current formation with that of 2020. Pointing to the cyclic nature of prices and the inevitability of retracements from bottoms and peaks, the trader expects prices to bounce.

The trader said that in 2020, when Bitcoin prices fell, shaking out weak hands, the recovery sparked a bull run that forcefully saw the coin surge above previous all-time highs of $20,000. The analyst seems to allude to the retracement before the breakout as a catapult that eventually fed the “legendary” bull run, which saw Bitcoin float to as high as $70,000.

BTC historical performance | Source: Analyst on X

Based on this comparison, the trader is adamant that it may, reading from history, be the best time to “sell” at around spot levels. Still, for now, buyers can consider doubling down until there is a clear trend definition and shake-off of the current bear formation. Currently, BTC has strong rejections in the $71,700 to $72,000 liquidation zone, marking last week’s highs.

Watch Out For The “Dry Powder”

Besides technical candlestick formation, another trader thinks buyers better HODL even with sellers in control.

In a post on X, the analyst said Tether Holdings, the issuer of USDT, and Circle, the issuer of USDC, recently minted billions. On April 2, Tether issued 1 billion USDT on Tron, while Circle issued 250 million USDC on Solana. 

This development, the analyst said, means there is “plenty of dry powder.” Stablecoins like USDT and USDC offer stability in the crypto markets, providing a refuge for crypto holders whenever prices tumble. 

Tether minting USDT on Tron | Source: Analyst on X

However, they can also act as conduits of liquidity from the traditional market, providing an avenue for interested users to get exposure to top coins or even engage in activities such as decentralized finance (DeFi). 

In the past, prices often edged higher when there were huge stablecoin mints.

Bitcoin At Crossroads Ahead Of Halving: Will BTC Fall To $53,600?

Bitcoin prices are volatile, recently dropping from the peak of over $73,000 in March to the current spot levels. Analysts are turning to historical data for insights with mounting selling pressure and some investors being concerned about potential short-term losses. This historical analysis is crucial in determining whether we’ve reached a market top or if this is just a temporary pause before the trend resumes.

Will The Depth Of This Correction Depend On This?

In a post on X, one analyst said the depth of the current correction will largely depend on whether Bitcoin is “parabolic” or not. Whenever an asset registers “parabolic” prices, it means valuation has increased sharply, and, at some level, analysts think it is unsustainable.

Bitcoin price action | Source: Analyst on X

In that case, prices tend to cool off later, but after key resistance levels and even all-time highs have been broken. If this is the case, then the current cool-off could suggest the formation of a potential “first cycle top” at the March 2024 all-time high of $73,800.

This formation will be similar to those seen in April 2013 and 2021.

Bitcoin price trending lower on the daily chart | Source: BTCUSDT on Binance, TradingView

However, in another scenario, traders should expect a different arrangement, assuming the recent price growth wasn’t unsustainable or parabolic. Assuming this is the case, Bitcoin will likely continue bleeding and revisit established support levels.

The analyst predicts a possible correction to as low as the $53,600 support in the coming sessions. This retracement, the analyst continues, will allow the formation of a “smoother curve like 2016 – 2017.”

The Influence Of Bitcoin Halving

Aside from this assessment, another analyst is roping in the concept of the Bitcoin pre-halving cycle. Usually, and looking at historical formations, prices tend to collapse leading up to the halving event, which is set for the third week of April.  

In a post on X, the analyst said the current rejection and the failure of bulls to push prices higher suggest that the coin might consolidate between $60,000 and $70,000 in the coming weeks.

BTC in pre-halving cycle | Source: Analyst on X

Bitcoin continues under pressure and will likely register even more losses in the days ahead. Based on the daily chart formation, BTC prices are trending below the middle BB. Notably, it is finding strong rejection from the $71,700 zone.

Even though the uptrend remains, buyers will only be in control should prices rise, reversing current losses, preferably with increasing participation levels.

Ethereum And Altcoins Crash: Why Is This Analyst Super Bullish?

Altcoins like Ethereum, Cardano, Solana, and the rest might be lower at spot rates. However, according to one analyst who sees a parallel in the current formation to the 2020 market cycle, they are gearing up for a potential surge. 

In a post on X, the analyst says that often, after a period of accumulation and a retest of previous highs, altcoins tend to be volatile. The crypto analyst also notes that Bitcoin has pulled back from its all-time highs and is preparing for a possible retest of this level registered in March. 

Bitcoin accumulating | Source: Analyst on X

Though altcoins have been decimated, looking at price action in the past 24 hours, altcoins are on a bullish path, similar to the last cycle registered in 2020. The analyst says Bitcoin will catalyze the altcoin swing to fresh levels and valuations.

Will Altcoins Repeat The 2020 Cycle?

For now, it is hard to predict the exact valuation of top altcoins. However, the analyst notes a similar formation in the current price action. 

When altcoins consolidated after surging, prices tended to recover strongly. This spike was evident, especially once Bitcoin broke through critical liquidation levels and entered “price discovery” or fresh all-time highs. 

Bitcoin price trending upward on the daily chart | Source: BTCUSDT on Binance, TradingView

Currently, Bitcoin is in this position. The coin is trading lower and cooling off from all-time highs. Even after higher highs last week, bulls didn’t break the $71,700 level in the daily chart. With BTC collapsing, altcoins also fell, with Ethereum, Solana, and top coins slipping below support levels. 

Will Ethereum And Other Altcoins Bounce Back Strongly?

The altcoin season might come earlier this time, especially once Bitcoin recovers. Possible triggers include the upcoming Bitcoin halving event. Analysts claim that halving will likely create a supply crisis, causing scarcity. If institutions funnel the same demand level, BTC will likely rip higher, breaking $71,700 and even $73,800 all-time highs.

Beyond this, upcoming network upgrades in Ethereum, like the recently mentioned “Purge” and Firedancer integration in Solana, might trigger demand. Developers are working towards Voltaire in Cardano. All these changes plan to make the top smart contracts platform more reliable and enhance performance. 

Besides network upgrades, analysts are considering the possible approval of spot Ethereum exchange-traded funds (ETFs). If the United States Securities and Exchange Commission (SEC) approves this product, ETH might benefit by lifting others. It might also accelerate the drafting of fitting laws, especially now that BlackRock thinks tokenization and real-world assets (RWAs) are the future of finance. 

Bitcoin Ready To Rip? Indicator Prints Bullish Signal After 9 Years

One analyst on X thinks Bitcoin bulls may be in for a treat in the coming months after one key indicator printed a buy signal for the first time in nearly a decade. While pointing to a bullish crossover on the 2-month chart’s Golden Moment Indicator, the analyst said the signal is again flashing green in almost nine years. 

Further cementing this outlook, this is forming as yet the Supertrend indicator, which has historically preceded every major Bitcoin uptrend, is also bullish.

BTC bull signals print | Source: Analyst on X

Bitcoin On A Bullish Path?

Though the analyst might be bullish on the world’s most valuable coin, the asset remains consolidated.  Technically, reading from the formation in the daily chart, the coin is slowly losing the uptrend momentum. This week, Bitcoin failed to build on to late last week’s spike to push above $72,000 in a buy trend continuation.

Bitcoin price trending upward on the daily chart | Source: BTCUSDT on Binance, TradingView

In the daily chart, Bitcoin is trading above the 20-day moving average. However, prices have been moving horizontally below $72,000. Despite this, traders are hopeful. 

Whether bulls will flow back and thrust the coin to fresh highs above $74,000 will depend on many other factors.

Inflows Into Spot BTC ETFs Pick Up Momentum

A key influencer on price and sentiment remains spot Bitcoin exchange-traded funds (ETFs) and their flow trend. Since launching, nine out of the ten spot Bitcoin ETFs have accumulated over 500,000 BTC, or roughly 2.5% of the total supply. 

When Grayscale’s BTC holding is factored in, all spot Bitcoin ETF issuers in the United States control 830,000 BTC. Cumulatively, this figure translates to roughly 4% of the total supply.

Of note, after last week’s slowdown, inflows continued throughout this week, pushing their holdings even higher—a net positive for the price and, most importantly, investor confidence. By March 28, Lookonchain data shows that 21Shares led the charge, adding 2,924 BTC. 

Spot Bitcoin ETF issuers accumulating | Source: Lookonchain via X

Despite the general lull in Bitcoin prices, the uptick in demand for these derivative products indicates growing interest among institutional and retail investors.

It remains to be seen how prices react going into April, an important month. In less than four weeks, the network will halve miner rewards from 6.25 BTC to 3.125 BTC, making the coin scarce. If the current level of demand remains, BTC prices will likely rise as market forces automatically adjust prices. 

Are Old Bitcoin Whales Selling Or Mitigating Risks Using Spot BTC ETFs?

Ki Young Ju, the founder of CryptoQuant, a blockchain analytics firm, has noticed a curious trend. In a post on X, the founder shared a snapshot suggesting that Bitcoin “old whales” might be shifting their holdings to “new whales,” mainly traditional finance heavyweights like Fidelity and BlackRock.

The United States Securities and Exchange Commission (SEC) recently approved these new whales to list spot Bitcoin exchange-traded funds (ETFs) for all investors. 

Bitcoin old whales moving holding | Source: Analyst on X

“Old Whales” Moving Coins: Selling Or Risk Mitigation?

While a definitive sell-off isn’t confirmed, commentators replying to the founder’s post believe these “old whales” could be mitigating risk. In their assessment, moving their Bitcoin stash from self-custody to a regulated investment vehicle like spot Bitcoin ETFs is a better measure of covering unexpected eventualities.

If this is the approach, then it could prove strategic. Bitcoin holders can transact without depending on a third party. Notably, this development coincides with a significant drop in BTC inventory on major exchanges like Coinbase and Binance, as well as at GBTC.

The decline has accelerated since the introduction of spot Bitcoin ETFs, hinting at a potential departure from exchanges. Meanwhile, the operators of GBTC are unwinding the product and converting it to a spot Bitcoin ETF following a court decision.

Will Spot BTC ETFs Gain Traction?

Even so, that “old whales” are moving their coins to centralized products like ETFs contradicts the core philosophy of BTC as a tool for financial self-sovereignty. Whether more users, mainly retailers, will choose to own spot Bitcoin ETF shares rather than the underlying coins directly remains to be seen.

Institutions might be obliged by law to use a regulated product if they need to be exposed to BTC. However, retailers can choose to buy directly from exchanges or mine. This freedom might lead to more retailers opting to buy BTC.

Bitcoin price trending upwards on the daily chart | Source: BTCUSDT on Binance, TradingView

This trend emerges ahead of the highly anticipated Bitcoin halving. This event is set for mid-April 2024 and will further reduce BTC’s circulating supply, potentially driving higher prices. Before then, BTC prices are firm, steady above $70,000 at the time of writing.

Will Bitcoin Break $74,000 Driven By TradFi FOMO?

Willy Woo, an on-chain analyst, believes the Bitcoin upswing is far from over. Citing the development in the Bitcoin Macro Oscillator and the possibility of traditional finance jumping on the bandwagon (FOMO), the odds of BTC rallying in at least two strong legs up in the coming session could not be discounted. 

On-Chain Data Signals More Upside For Bitcoin

In a post on X, Woo remains confident about what lies ahead for the world’s most valuable cryptocurrency. Based on on-chain development, there are indicators that the coin may firmly push higher, breaking above the current lull.

Bitcoin remains mostly range-bound when writing, trading within a tight zone capped by $73,800 on the upper end and $69,000 as immediate support. Even with analysts being confident of what lies ahead, the coin has failed to overcome strong selling momentum from sellers to breach all-time highs in a buy-trend continuation.

Bitcoin price trending upward on the daily chart | Source: BTCUSDT on Binance, TradingView

From how the coin is set up, the current sideways movement may be accumulation or distribution, depending on the breakout direction. For instance, any upswing above $72,400 might spur demand, lifting the coin towards $73,800. Conversely, losses below $69,000 and the middle BB might see BTC slump to March 5 lows or even lower.

Will TradFi FOMO And Short Squeeze Lift BTC?

Even with the slowdown in upside momentum, Woo says there is strong potential for “another solid leg up.” The analyst also added that there could be two surges if TradFi investors “FOMO” into Bitcoin. In the 2017 bull run, the rally to $20,000 was primarily due to retailers jumping in and FOMOing on the coin. 

With spot Bitcoin exchange-traded funds (ETFs) available in the United States, speculation is that more institutions and high-net-worth individuals are buying the coin. If BTC rips higher, breaking $74,000, more inflow will likely be into the multiple spot Bitcoin ETFs, fueling demand.

This bullish outlook comes when other analysts expect Bitcoin to surge in the sessions ahead. In a post on X, one analyst says the incoming short squeeze will likely propel the coin above March highs. Whenever a short squeeze happens, prices rise, forcing sellers to buy back at higher prices, accelerating the uptrend.

The assessment is behind a record-breaking gap between institutional investors betting on price increases and hedge funds selling the coin. 

Chainlink Facing Strong Rejection From Profit-Taking, Will CCIP Recharge Demand?

One analyst on X notes that Chainlink is facing a tug-of-war between bullish momentum and strong upside resistance from profit-taking traders. For bulls to add to their longs and extend the uptrend, the existing oversupply must be moped, paving the way for more gains above immediate liquidation levels. 

LINK profit taking | Source: Analyst on X

Profit Taking Slowing Down LINK Bulls

Looking at the LINK price action in the daily chart, it is clear that buyers have the upper hand. Bulls have been relentless since the token bottomed out in September 2023. 

Since then, LINK has doubled, even breaking above the psychological round number at $20. At press time, buyers are still in control, snapping back to trend despite the market-wide cool-off after Bitcoin crashed last week. 

Chainlink prices trending upward on the daily chart | Source: LINKUSDT on Binance, TradingView

LINK is within a broader range, with clear caps at around $17.9 on the lower end and $21.7 on the upper end. After protracted expansion from September, the emergence of a ranging market could suggest that traders are exiting their positions, slowing down the uptrend.

This has been confirmed by on-chain data that the analyst tagged, explaining the recent slowdown. Indeed, on-chain data suggests investors have been cashing in on the recent expansion.

As a result, the excess supply needs to be absorbed by the market before LINK Bulls builds enough momentum to drive the coin to new 2024 highs above $21.8.

 Chainlink CCIP Adoption To Recharge Demand?

Despite the short-term headwinds, Chainlink bulls are banking on the widespread adoption of the Chainlink Cross-Chain Interoperability Protocol (CCIP) as a demand catalyst. CCIP is critical for blockchain interoperability. The solution allows secure communication between smart contracts of linked blockchains and external data sources.

CCIP has been adopted by, among others, Metis, a layer-2 scaling solution for Ethereum. Circle, the issuer of USDC, a stablecoin, is also leveraging the platform to enhance interoperability.

Recent data shows a surge in CCIP revenue, pointing towards increased adoption of this multichain bridging platform. As of March 26, Dune Analytics data shows that the CCIP has generated over $484,000 in revenue. This figure will likely increase as CCIP finds adoption and Chainlink integrates with even more protocols, businesses, and blockchains. 

CCIP revenue | Source: Dune Analytics

Still, the pace at which LINK breaks above March highs and registers fresh 2024 highs will also demand the performance of other coins, including Bitcoin and Ethereum. A resurgent BTC could draw more capital, lifting altcoins, including LINK, in the process.

Bitcoin is “Overheating” For The First Time Ever Before Halving

Bitcoin, the world’s most valuable coin, is once again deviating from historical norms. According to an analysis by one crypto analyst, the coin is in the “overbought” territory of the Relative Strength Index (RSI) for the first time in the lead-up to halving. The RSI is a popular technical indicator analysts use to gauge the price momentum of traded instruments. 

Bitcoin Overheating? RSI Stands Above 70

The analyst points out that the Bitcoin RSI on the monthly chart is currently above 70, indicating an overbought condition and overheating. This is a significant development as it’s the first time in Bitcoin’s history that this has happened before a halving. 

BTC overheating | Source: Analyst on X

The Bitcoin network is set to halve miner rewards in mid-April. This event, which occurs roughly every 200,000 blocks, will cut rewards distributed to miners by 50% from the current level of 6.125 BTC. Miners play a vital role in confirming transactions and maintaining network security. 

The fact that Bitcoin prices appear to be “overheating” just before halving is net bullish for the coin. It suggests that prices are not only breaking from historical trends but also building strong momentum.

Besides the strong upside momentum, the analyst notes that Bitcoin now trades above a critical dynamic level on the monthly chart.

The confluence of these positive developments could explain why traders are upbeat. Most analysts agree that the coin will likely break higher in the weeks ahead, clearing the recent all-time high of around $73,800.

BTC Pinned Below $73,000 And Consolidating 

Thus far, Bitcoin prices are firm, increasing as evident in the daily chart. After sharp contractions in the past few trading sessions, the welcomed reversal over the weekend lifted the coin towards the elusive $70,000 level and a previous all-time high.

Bitcoin price trending upward on the daily chart | Source: BTCUSDT on Binance, TradingView

However, judging from the candlestick arrangement in the daily chart, a break above $73,800 would likely catalyze more demand. So far, prices are moving sideways within a broad range despite signals of strength relayed from other indicators.

While some investors are bullish, expecting prices to rise, caution should prevail. A close above $74,000 would thrust Bitcoin into unchartered territory. Beyond this, the analyst uses technical indicators to make projections. These tools use historical parameters and lag. As such, they may not be as accurate and, thus, misleading in some instances.

Bitcoin Market Cap Hints at Potential Price Surge After Retesting 2021 Highs

A crypto analyst on X is confident that Bitcoin has bottomed and is poised for major gains in the sessions ahead. Interestingly, the bullish outlook hinges on the Bitcoin market cap retesting all-time highs at press time. 

Will BTC Rally? Market Dynamics Changing

So far, the Bitcoin price is around 2021 highs in USD terms but recently broke all-time highs, peaking at around $73,800. This fluctuation is also reflected in its market cap. It currently stands at $1.25 trillion, down 5% in the past 24 hours.

Notably, it is at the same price level as in 2021, when Bitcoin prices peaked, recording new all-time highs.

Bitcoin market cap at 2021 highs | Source: Analyst on X

While optimism abounds and the trader expects more sharp price expansions in the days ahead, it is not immediately clear whether the coin will rip higher, aligning with this forecast. Bitcoin is volatile and has remained so despite changing market dynamics. 

At the same time, unlike in the past, Bitcoin prices are driven not only by retail forces but by institutions. These institutions are regulated by the United States Securities and Exchange Commission (SEC), which also approved the spot Bitcoin exchange-traded fund (ETF). 

This Bitcoin derivative product has been the primary driving force in the past ten weeks. This is from looking at how prices have evolved since its approval in mid-January 2024. 

However, since BlackRock and Fidelity are regulated by the United States SEC, unlike retailers, they cannot act as they wish. Considering the millions and billions of dollars at play, their comments or assessments on the coin, now and in the future, can greatly impact sentiment.

Sentiment Is Dented, BTC Facing Headwinds

Sentiment has been dented when writing. Even with the United States Federal Reserve (Fed) ‘s decision to hold rates at 5.5%, the highest in 2023, lifting prices, there has been no solid follow-through in price action. The coin remains steady below $70,000.

Bitcoin price trending downward on the daily chart | Source: BTCUSDT on Binance, TradingView

Whether prices will rally over the weekend remains to be seen. However, for now, there are some headwinds to consider.

First, there has been a slowdown in inflows to spot BTC ETFs. At the same time, outflows from the Grayscale Bitcoin Trust (GBTC) have increased. Second, after rallying sharply from October 2023, a cool-off before halving might see the coin trend lower.