Bitwise Heralds Coinbase (COIN) As The ‘Next Amazon’: Price Targets

In a recently published report by Bitwise, the leading crypto index fund manager, a striking comparison has been drawn between Coinbase and Amazon, highlighting a significant yet under-reported aspect of Coinbase’s business — the Base Layer 2 network. Titled “It’s All About That Base (and Other Thoughts on Coinbase),” the report authored by Matt Hougan and Juan Leon delves deep into the financial and strategic shifts underpinning Coinbase’s latest successes and potential future.

Amazon Of Crypto? Bitwise Projects Stellar Future For Coinbase

Coinbase’s latest financial results have been a revelation, demonstrating robust growth and operational efficiency. The company reported $1.6 billion in net revenue, marking a 116% increase year-over-year, significantly surpassing Wall Street’s expectation of $1.36 billion.

Profits were equally impressive, reaching $1.2 billion with total cash reserves swelling to $7.1 billion. Each of Coinbase’s business lines showed notable growth: consumer trading revenue rose by 93%, institutional trading by 105%, stablecoin revenue by 15%, blockchain rewards by 59%, and custodial services by 64%.

Despite these strong numbers, the stock has trended downwards, suggesting that the market may not fully appreciate the depth of the company’s strengths. However, Bitwise highlights a less conspicuous but potentially transformative element of Coinbase’s portfolio: the Base Layer 2 network.

Launched in August atop Ethereum, Base aims to enhance the blockchain’s throughput while lowering costs. It operates similarly to a bar tab, aggregating transactions and settling them in batches, thereby reducing transaction costs to under $0.01 and speeding up processing times to less than one second.

The adoption rate of Base has been staggering. The network saw a 74% increase in transactions quarter-over-quarter in the first quarter, with a 40% increase in April alone compared to the entire first quarter. The exponential growth in the number of developers using Base, which increased eightfold, underscores the network’s rising significance and the broader industry’s interest.

From a financial perspective, Base has been lucrative for Coinbase. In the first quarter alone, the network generated $27.4 million in transaction fees, of which Coinbase retained $15.5 million. This high-margin revenue stream continued into April, adding another $11 million to Coinbase’s profits. Given these trends, Bitwise predicts that Base could soon be contributing $10 million to $20 million in monthly profits to Coinbase.

The analogy with Amazon is rooted in the transformation potential of Base. Just as Amazon evolved from a simple online bookstore into a retail giant and later a dominant force in cloud computing through Amazon Web Services (AWS), Coinbase could similarly evolve from a crypto brokerage to a fundamental infrastructure provider for the crypto industry.

This shift could redefine Coinbase’s role and impact within the market, positioning it as a central infrastructure entity in the crypto ecosystem, akin to how AWS underpins much of today’s web services.

The report concludes by reflecting on the significance of Base for Coinbase’s strategic direction. “[T]he early returns on Base suggest that Coinbase could end up becoming something even greater: a core infrastructure provider to the crypto ecosystem. And that would be a very big deal indeed.”

COIN Price Analysis

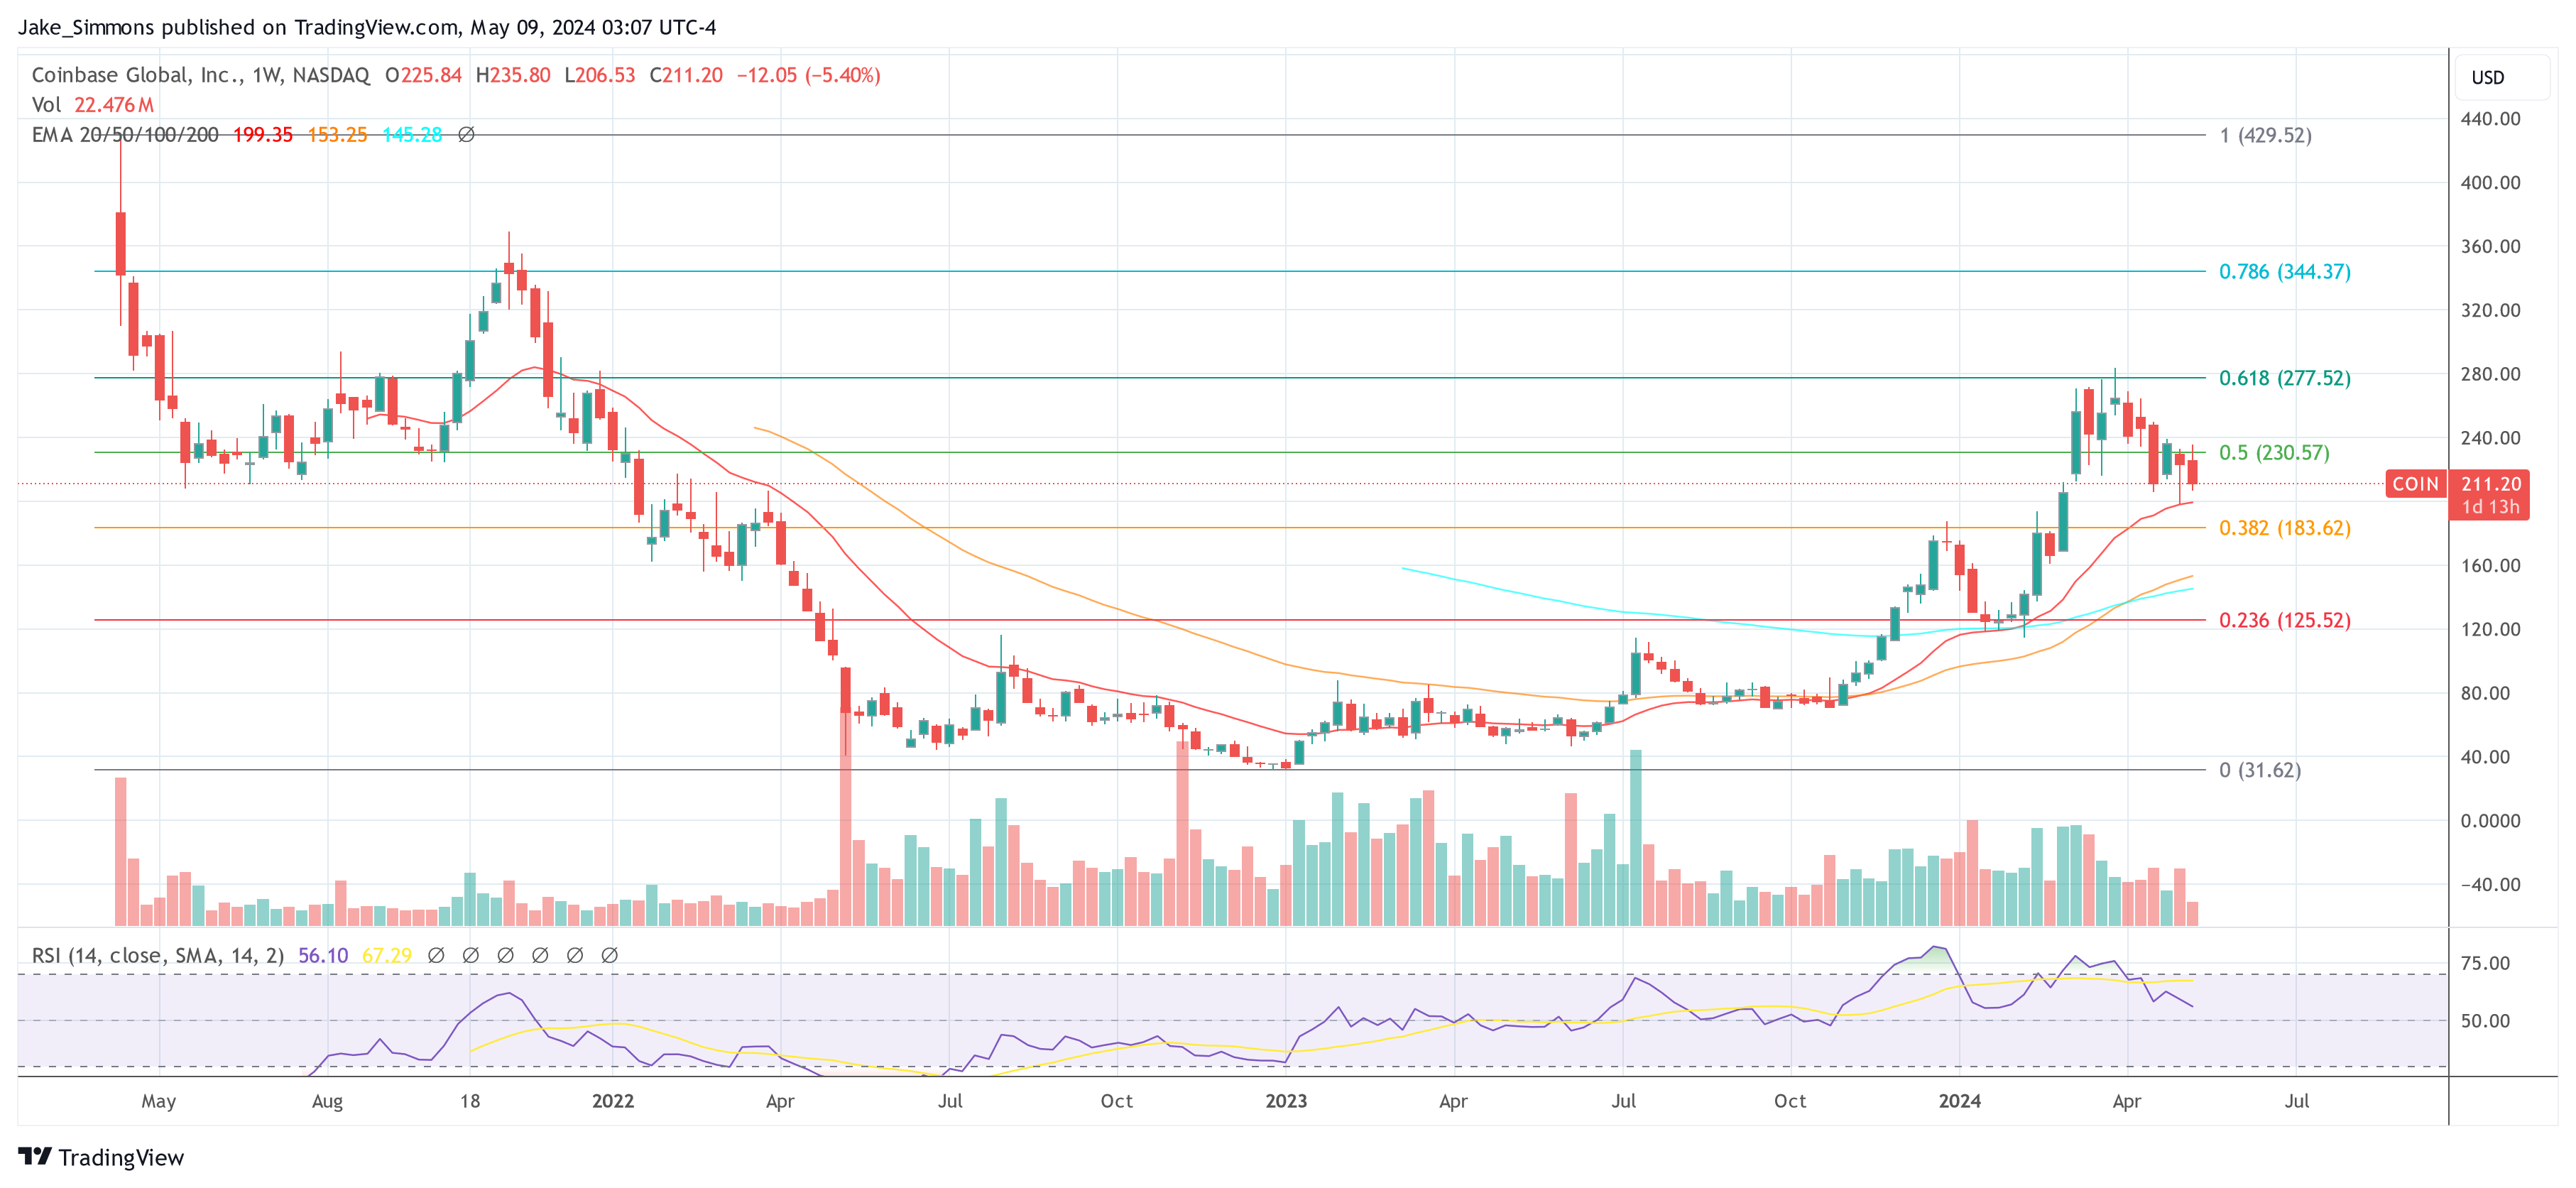
Analyzing the technical landscape, the price of Coinbase (COIN) currently faces a pivotal moment. After dropping to $211.20 (as of press time), down 11.4% from a weekly high of $235.79, the stock is testing significant resistance and support levels that could dictate its short-term trajectory.

The Fibonacci retracement tool, applied from a low of $31.62 to a high of $429.52, identifies critical price points. Presently, COIN is contending with the $230.57 level (0.5 Fibonacci level), which acts as the primary resistance. The 20-week Exponential Moving Average (EMA) provides crucial support at $199.35, with the stock recently bouncing off this level.

The Relative Strength Index (RSI) stands at 56.10, suggesting a balanced dynamic between buying and selling pressures, with a slight tilt towards buying. The recent price behavior, characterized by a candlestick with a small body and longer wicks, reflects the ongoing uncertainty and cautious sentiment among traders.

Coinbase COIN price

Cardano Update: ADA Faces Make-Or-Break Price Level For Bullish Revival

The Cardano (ADA) price is down 46% since its yearly high and is currently facing a make-or-break price level for a bullish reversal. Here’s what you need to know:

Cardano Price Analysis: Daily Chart

The daily ADA/USD chart is currently charting a path within a descending channel, which has defined the bearish trend since the beginning of March. On Monday, the ADA price peaked near $0.475, encountering substantial resistance at the channel’s upper boundary and from the critical 20-day Exponential Moving Average (EMA), which stands currently at $0.47.

Cardano price

In the short-term, this resistance level is crucial as it coincides with historical price rejection points, confirming its significance. As of press time, ADA is trading at approximately $0.44.

The convergence of the 20-day EMA ($0.47), 50-day EMA ($0.54), and 100-day EMA ($0.51) above the current price level illustrates a dense zone of resistance. The 200-day EMA at $0.52 reinforces this barrier, emphasizing a strong bearish momentum.

The Relative Strength Index (RSI) on the daily chart is currently at 38, which does not venture into the oversold territory (below 30) but indicates a bearish momentum with potential for further decline unless a reversal occurs.

For a bullish reversal, ADA needs a sustained break above the $0.47 mark (20-day EMA) with accompanying high volume to confirm the breakout from the descending channel and shift the market sentiment. Then, the cluster of EMAs becomes the central resistance zone.

Crossing this band is of utmost importance in order to build up bullish momentum for a break above the yearly high of $0.81 from March. If not, the ADA price could trend towards the midline of the channel and drop below $0.40.

In-Depth Weekly Chart Overview

Transitioning to the weekly chart, the broader picture also underscores the bearish sentiment that has dominated ADA since it reached its peak at $3.17 in late 2021. The series of lower highs and lower lows is a textbook representation of a downtrend.

Cardano price

The price action currently remains suppressed below the long-term moving averages: the 20-week EMA at $0.52, 50-week EMA at $0.48, 100-week EMA at $0.51, and 200-week EMA at $0.52, all of which slope downwards, underscoring the persistent selling pressure in recent weeks.

The Fibonacci retracement levels, drawn from the high of $3.17 to the low of $0.22, provide further insights. Currently, ADA trades near $0.44, which is above the major psychological and technical support at $0.40.

The closest significant Fibonacci retracement level is the 0.236 level at $0.918, which ADA has struggled to surpass. A breach above this level could open the path toward higher Fibonacci levels at $1.348 (0.382) and $1.697 (0.5), which would require a significant shift in momentum and buying interest.

Overall, for ADA to shift from its bearish constraints, attention should be focused on the daily resistance at roughly $0.47 (descending channel breakout). Overcoming this barrier would be pivotal for confirming a bullish reversal. Until this level is decisively broken with substantial volume, the outlook remains tilted towards bearish continuation.

Bitcoin Gets A ‘Monster’ Whale Boost With $1.2 Billion ETF Purchase

Susquehanna International Group, a behemoth in asset management with a trading volume handling numerous financial products globally, has made a substantial investment in Bitcoin through various exchange-traded funds (ETFs). A disclosure to the Securities and Exchange Commission (SEC) on May 7 revealed that Susquehanna held approximately $1.2 billion in spot ETFs during the first quarter of 2024.

The Bitcoin ‘Monster Whales’ Are Here

The details of the investment are particularly notable for their scale and diversity. Susquehanna now holds 17,271,326 shares in the Grayscale Bitcoin Trust (GBTC), which alone is worth approximately $1.09 billion as of March 31, 2024. This single investment represents a significant portion of the entire BTC investment, indicating Susquehanna’s preference for Grayscale due to its high liquidity.

Further diversification in Susquehanna’s holdings includes 1,349,414 shares of Fidelity‘s spot Bitcoin ETF (FBTC), valued at roughly $83.74 million. In addition, the firm has significantly increased its stake in the ProShares Bitcoin Strategy ETF (BITO), which offers exposure to BTC futures contracts. Susquehanna owned 7,907,827 shares of BITO as of the same date, valued at approximately $255.42 million — this represents a 57.59% increase from a February filing that listed 5,021,149 shares.

Additionally, Susquehanna’s Bitcoin ETF portfolio includes stakes in other high-profile funds such as the BlackRock ETF, ARK21 ETF, Bitwise ETF, Valkyrie ETF, Invesco Galaxy ETF, VanEck ETF Trust, and WisdomTree ETF. The firm’s strategic selection of funds illustrates its comprehensive approach to capitalizing on different aspects of Bitcoin’s investment potential.

Julian Fahrer, CEO and co-founder of Apollo, commented on the magnitude of this development, stating, “HUGE: Susquehanna International Group is the biggest Bitcoin ETF whale yet! $1.2 Billion held across 10 ETFs! The monsters are here.” This enthusiastic endorsement reflects the growing optimism and institutional interest in cryptocurrency investments.

Despite these considerable stakes, Susquehanna’s allocation to BTC remains a relatively minor fraction of its total portfolio. With total investments surpassing $575.8 billion, the $1.2 billion in Bitcoin ETFs constitutes approximately 0.22% of the firm’s holdings, signaling a cautious yet significant entry into the digital asset space.

This move by Susquehanna has far-reaching implications for the market. Bitcoin ETFs got off to a roaring trading start and have seen interest wane in recent weeks. The rise in institutional investment, as evidenced by Susquehanna’s activities, is expected to enhance Bitcoin’s credibility and stability as a financial asset.

Moreover, Susquehanna’s diverse investment is not just limited to direct Bitcoin exposure. The company also reported indirect exposure through its holdings in MicroStrategy stock, which possesses a substantial Bitcoin reserve on its balance sheet. However, in a recent rebalancing, Susquehanna reduced its stake in MicroStrategy by nearly 15%, adjusting its exposure in line with its strategic portfolio adjustments.

At press time, BTC traded at $62,352.

Bitcoin price

This Week’s Crypto Watchlist: Top Coins Poised For Gains

In a post on X, crypto analyst Miles Deutscher laid out his strategic predictions for high-performing cryptocurrencies in the upcoming week to his 501,700 followers. His analysis delved deep into Bitcoin’s trading patterns, the surging AI-driven altcoin sector, and specific tokens that are displaying considerable potential due to recent developments and broader market dynamics.

Bitcoin And AI Crypto Tokens Are Set To Dominate This Week

At the forefront of Deutscher’s analysis, Bitcoin has recently returned to its previous trading range between $60,000 and $69,400 after experiencing a sharp drop. This movement was characterized as a significant deviation, suggesting manipulation or a shakeout of weak hands before a potential rally.

“Bitcoin is at the top of my watchlist for this week. Had a big fakeout/deviation to the downside, and now back within the range,” Deutscher stated. He pointed out that the key factor to watch is whether the current range’s lower boundary will hold, which could serve as a strong foundation for an upward trajectory.

Bitcoin price

Moreover, the AI sector has been particularly resilient and robust recently, bouncing back significantly amidst broader market recoveries. Deutscher highlighted the sector’s potential for outperformance, driven by several upcoming major events.

These include Apple’s Worldwide Developers Conference (WWDC), NVIDIA’s earnings announcement, and the anticipated release of ChatGPT 5. “AI is one of those unique narratives that retains constant mindshare due to its endless real-life news flow/hype,” Deutscher explained.

One specific AI token which Deutscher watches closely due to its alleged partnership with Apple is Render (RNDR), making it a prime candidate for speculation around the upcoming Apple event. Historically, RNDR has also led the AI token sector during market rotations.

Furthermore, Deutsches focuses on Near Protocol (NEAR), Fetch.ai (FET), AIOZ Network (AIOZ). He grouped these tokens together due to their correlation but noted their recent technical performance, where they bounced cleanly off daily support levels and established higher lows.

More Altcoins To Watch

TON: Recently the center of attention, TON experienced a drop after the Token2049 event in what Deutscher described as a “sell-the-news” scenario. However, recent investments by firms like Pantera signal continued interest and potential undercurrents of growth.

Ethena (ENA): With the market sentiment turning bullish again, Deutscher anticipates a return to positive funding rates, which typically benefit tokens like Ethena. Recent activity from the Ethena team, including increased reward boosts and optimistic social media posts from its founders, further bolster the bullish case. “Also hearing rumors of a T1 exchange listing,” Deutscher added, suggesting an impending increase in liquidity and exposure.

Jito (JTO): Jito is reportedly developing what Deutscher referred to as the “Eigen Layer of Solana,” aiming to replicate the success and hype surrounding the Eigen project’s layer solutions. Despite the challenges of a recent airdrop, Deutscher sees potential if the team executes well, particularly as the restaking narrative has not yet fully penetrated the market.

PopCat (POPCAT): Despite facing some fear, uncertainty, and doubt (FUD) related to copyright issues over the weekend, POPCAT continues to exhibit strong price action, pushing toward new highs. “POPCAT seems the best contender, for now, not a single cat meme coin has yet to hit a $1B market cap,” noted Deutscher, highlighting its standout performance.

Ethereum Finance (ETHFI): In the realm of liquidity reward tokens (LRT), ETHFI remains a notable mention despite a broader sector sell-off post-Eigen. Deutscher believes the selling may have been overreactive, and with total value locked (TVL) still on the rise, a reversion to mean on prices could be imminent.

SEI Network (SEI): As anticipation builds for the launch of the new layer one blockchain, Monad, later this year, SEI is seen as a strategic play. Categorized within the parallelized Ethereum Virtual Machine (EVM) narrative, SEI experienced a substantial sell-off but is poised for recovery as the market focus shifts towards upcoming launches.

Friend (FRIEND): After recommending FRIEND at $1.30, Deutscher continues to see upside potential, particularly as it approaches more significant centralized exchange listings. He advises keeping an eye out for major pullbacks as opportunities to buy.

The Next Big Catalyst For Bitcoin? What Michael Saylor Predicts

In an interview with journalist Natalie Brunell, Michael Saylor, executive chairman and co-founder of MicroStrategy, laid out his vision for what could next propel the price of Bitcoin. His insights come at a time when the digital currency landscape is experiencing pivotal regulatory and institutional developments.

The Next Big Catalyst For Bitcoin Price

Saylor pinpointed the specific moment he believes heralded the onset of a new era for Bitcoin. “January of 2024 marked the beginning of the period of corporate adoption of Bitcoin,” he stated. The significance of this shift, according to Saylor, is tied closely to regulatory approvals and the distinctive path Bitcoin is carving for itself amidst a sea of digital assets.

The crux of Saylor’s argument is the US Securities and Exchange Commission’s (SEC) decision-making process regarding cryptocurrency spot Exchange-Traded Funds (ETFs). He described the SEC’s approval of Bitcoin spot ETFs as the “first big catalyst.” This regulatory nod not only legitimizes Bitcoin in the eyes of institutional investors but also enhances its appeal as a viable corporate treasury asset.

Now, Saylor argues that the next decisive moment will hinge on the SEC’s handling of other cryptocurrencies. “The second big catalyst will be the SEC’s denial of every other crypto application for spot ETFs,” Saylor explained. By denying these applications, the SEC would effectively position Bitcoin as the premier, unreplicated choice among cryptocurrencies, an outcome Saylor sees as critical for dispelling doubts about Bitcoin’s long-term viability and uniqueness.

“And when we actually see the regulators deny the applications of the copies of other crypto assets, then we will have checked the box. It won’t be banned, it won’t be copied,” Saylor remarked.

Expanding on the implications of such regulatory decisions, Saylor employed a metaphor involving the choice of materials in large-scale engineering projects. He compared the decision-making process in corporate investment in Bitcoin to choosing between steel or bronze for constructing a skyscraper.

“Once you realize there’s just steel and there is no second best metal for structural civil engineering, the project moves forward,” he noted. In this analogy, Bitcoin is likened to steel — the foundational material without substitute — clearing any hesitation about its adoption in corporate portfolios.

Notably, this narrative is timely as the crypto sector watches the SEC closely, particularly with regard to Ethereum, the second-largest cryptocurrency by market cap. The final deadline for the SEC to approve or deny the VanEck spot Ethereum ETF is May 23, 2024, a decision that has been postponed repeatedly.

Bloomberg’s senior ETF analyst, Eric Balchunas, noted a decrease in the likelihood of approval in March, citing a lack of communication between the SEC and ETF applicants, which he viewed as a negative signal for Ethereum’s immediate ETF prospects.

At press time, BTC traded at $63,835.

Bitcoin price

Crypto Analyst Reveals 6 Must-Buy Altcoins With The Most Potential

As the crypto market exhibits signs of a burgeoning altseason, crypto analyst Alex Wacy has shared a strategic forecast with his 175,000 followers on X. Wacy predicts a selective yet explosive growth phase for altcoins, emphasizing the critical nature of asset selection and market timing.

Crypto Market Outlook And Asset Selection Strategy

Wacy’s recent thread underscores the anticipation of a massive altseason: “Only ~15% of altcoins will bring 10-100x in this hyper growth. Asset selection matters more than ever. One slip-up, and you’re out.” His analysis highlights the potentially selective nature of the upcoming market phase, suggesting significant disparities in performance among altcoins.

Wacy believes the market is currently undervalued and primed for a significant uptick. He suggests that the consolidation of the total altcoin market cap above $700 billion would confirm the bull trend, signaling the onset of altseason. This perspective is rooted in current market behaviors where sentiment remains largely bearish, presenting a contrarian opportunity for growth.

TOTAL 3 crypto market cap

He categorizes the current sentiment into three types of capitulation—price, time, and growth—indicating varied investor behaviors that often precede market recoveries. The prevailing fear of further drops, according to Wacy, will likely clear out weak hands, setting the stage for a supercycle driven by Fear of Missing Out (FOMO) and subsequent strong buying activities.

Top 6 Altcoins With The Most Potential

#1 And #2: WIF as well as PEPE are the memecoins highlighted by Wacy as potential early movers in the anticipated altseason. “Look at WIF and PEPE, structurally similar to DOGE during its meteoric rise. These coins have cultivated a community and meme appeal that could very well parallel SHIB’s market cap in the previous cycle,” Wacy asserts. He notes that PEPE appears particularly poised for a breakout, whereas WIF, though currently weaker, has the potential for quick shifts in market sentiment.

PEPE WIF Dogecoin comparison

#3 Ondo Finance (ONDO): This Real World Asset (RWA) focused coin is characterized by its robust buy support during price dips. Wacy sees ONDO as an undervalued asset with a significant upside. “ONDO has a resilient buy floor; even slight retractions to around $0.64 could offer lucrative entry points ahead of substantial upward trajectories,” he advises. His first target is the $1.62 price zone.

#4 Arweave (AR): Known for its decentralized data storage solutions, Arweave is praised by Wacy for its strong market structure and resilience during downturns. Moreover, Arweave is building AO, a decentralized computer network which can be run from anywhere. “Arweave isn’t just storage; it’s a foundational technology in a decentralized future. A consolidation above $49 would likely be the catalyst for an explosive growth phase,” he predicts.

#5 Echelon (PRIME): Wacy discusses PRIME’s multifaceted ecosystem, which encompasses a trading card game and an AI-powered game, both of which are gaining traction. “Echelon stands at the confluence of gaming and blockchain technology, attracting a broad audience with its innovative gameplay and decentralized features,” he remarks. From a technical analysis perspective, the PRIME price is near a favorable buying zone from $14.97 to $17.5. “Hoping that altcoins are already entering the altseason, would like to see a V-shaped reversal,” Wacy states.

#6 Ethena (ENA): This synthetic dollar protocol offers an alternative to traditional banking and is poised for growth. “Ethena’s pattern on the weekly charts typically precedes major price movements. With the next major unlock event slated for April 2025, the buildup could be substantial,” Wacy explains. He likens ENA’s current price trajectory with the one of SEI.

ENA vs SEI comparison
Strategic Profit-Taking

Wacy also provides strategic advice on profit-taking, anticipating that the altcoin market index, TOTAL3, could ascend to between $2 trillion and $2.3 trillion during the altseason. He suggests considering partial profit-taking once the market reaches approximately $1.6 trillion. His rationale is based on historical patterns where many investors fall prey to greed, resulting in substantial losses.

The analyst further advises preparing a profit-taking strategy in advance, advocating for the reservation of 10-15% of positions for potential further growth beyond initial targets. He warns that the last surge in a growth phase often triggers excessive greed, suggesting that recognizing such signals could be crucial for timely exits before the onset of bear market conditions.

At press time, WIF traded at $3.58.

WIF price

Here’s When Bitcoin Could Peak In This Accelerated Bull Run: Analyst

The current Bitcoin price behavior and its deviations from expected cyclical patterns remain a central theme of analysis. Crypto analyst Rekt Capital (@rektcapital) recently shared new insights on X concerning Bitcoin’s potential peak during the ongoing bull run, which is progressing at an atypical pace compared to historical data.

When Will Bitcoin Peak This Cycle?

In a detailed post, Rekt Capital pointed out that as of mid-March 2024, Bitcoin had not only reached new all-time highs but had done so approximately 260 days ahead of its traditional halving-induced cycles. This marked a significant acceleration. “When Bitcoin rallied to new All Time Highs in mid-March 2024, Bitcoin was accelerating in its cycle by 260 days compared to traditional Halving Cycles,” stated Rekt Capital.

However, this rapid pace has not been sustained. Over the past two months, Bitcoin has been in a phase of consolidation, which has altered its trajectory. The acceleration advantage has decreased to about 210 days compared to previous cycles. This deceleration is a critical factor, as it could lead to a re-synchronization with the typical halving cycle. Typically, BTC peaks 518-546 days after a halving event.

The analyst suggests shifting the predictive focus from just halving events to the periods after Bitcoin surpasses its previous all-time highs. Historically, BTC price tends to reach a bull market top within 266 to 315 days after breaking these thresholds. Given that this milestone was achieved again in mid-March 2024, the projected window for the next bull market peak could be set between late November 2024 and late January 2025.

Nevertheless, a notable trend is the increasing duration for which Bitcoin maintains levels beyond its old highs. In 2013, this period lasted 268 days, in 2017 it extended to 280 days, and by 2021, it had increased to 315 days.
This pattern suggests an incremental extension of approximately 14 to 35 days per cycle. “Historically, the amount of days that Bitcoin has spent beyond old All Time Highs has increased by approximately 14 days to 35 days,” explained Rekt Capital.

Adding these increments to the initial range of 266 to 315 days post-old highs, the peak could potentially extend to between 280 and 350 days post-breakout. This adjustment shifts the expected peak time frame to between mid-December 2024 and early March 2025.

Bitcoin cycle analysis
Potential Synchronization With Halving Cycles

Despite the current accelerated cycle, there remains a possibility that further deceleration could align Bitcoin more closely with its halving cycle. In past cycles, such as those between 2015-2017 and 2019-2021, Bitcoin peaked at 518 and 546 days post-halving, respectively. If Bitcoin’s rate of acceleration continues to decrease, the cycle may eventually resynchronize, potentially delaying the peak to between mid-September and mid-October 2025.

Rekt Capital elaborates, “But if Bitcoin continues to reduce its current acceleration in the cycle, it would resynchronize with traditional Halving cycles.” This could result in a peak more aligned with historical patterns, diverging from the current accelerated timeline.

At press time, BTC traded at $64,262.

Bitcoin price

Why This Crypto Bull Run Might Not Live Up To The Past: Analyst

In a detailed analysis shared with his 788,000 followers on X (formerly Twitter), renowned analyst Pentoshi has forecasted a more restrained outlook for the current crypto bull run, suggesting that it may not mirror the explosive growth seen in previous cycles. His insights provide a deep dive into the underlying factors that could temper the market’s performance.

Why Crypto Investors Have To Expect Diminishing Returns

Pentoshi began his analysis by stating, “This cycle should have the largest diminishing returns of any cycle,” attributing this prediction to several key market conditions. Primarily, he noted that the base market capitalization for cryptocurrencies has increased significantly in each successive cycle, setting a higher starting point that makes further exponential growth increasingly challenging.

“Each cycle has set a floor about 10x the previous lows in terms of market cap,” Pentoshi explained. He provided a historical context, recounting that when he entered the crypto market in 2017, the market cap for altcoins was only around $12-15 billion, a figure that ballooned to over $1 trillion during peak periods. He argued, “That growth isn’t repeatable,” pointing out that the decentralized finance (DeFi) sector, which was then nascent, played a significant role in driving previous cycles’ exceptional returns.

Another significant factor Pentoshi highlighted is the dramatic increase in the number of altcoins and the corresponding market dilution. “Today, however, there are a lot more alts, and a lot more dilution,” he remarked, indicating that the proliferation of new tokens spreads investment thinner across the market, reducing the potential for individual tokens to achieve substantial price increases.

Pentoshi also touched upon the demographic shifts in crypto ownership. He contrasted the early days of crypto adoption, when approximately 2% of Americans were involved in the market, to the present, where over 25% of Americans have some form of crypto investment. “It just requires more capital to move the markets, and there will continue to be a lot more alts, spreading it out further,” he noted, emphasizing the logistical and financial challenges of replicating past growth rates in a much more saturated market.

An often-overlooked aspect of market dynamics, according to Pentoshi, is the role of token liquidity and its impact on price stability. He detailed that recently, tokens amounting to about $250 million were unlocked daily, though not necessarily sold. “Assuming they all got sold, that is the inflows you’d need just to keep prices stable for 24 hours,” he explained, highlighting the delicate balance required to maintain current market levels, let alone drive prices upward.

Looking forward, Pentoshi was conservative in his expectations for the Total3 index, which tracks the top 125 altcoins (excludes Bitcoin and Ethereum). He estimated, “My best guess is that this cycle we don’t see Total 3 go 2x past the 21′ cycle ATH. So 2.2T max for Total3.” This projection underscores his broader thesis that while the market continues to offer daily opportunities, the era of “easy, outsized gains” might be behind us.

Pentoshi concluded his analysis with advice for investors, suggesting a more cautious approach to market participation. “If you believe the cycle is 50% over, you should be taking out more than you are putting in and building up some cash and buying other assets with lower risk in the meantime,” he advised, stressing the importance of securing gains and diversifying holdings to mitigate risk.

Reflecting on the psychological aspects of investing, he added, “Most people never really learn. Because if you can’t control your greed, and defeat it, you are destined to give back your gains repeatedly.” His parting words were a reminder of the cyclical and often predatory nature of financial markets, urging investors to secure profits and protect themselves from foreseeable downturns.

At press time, TOTAL3 stood at $635.565 billion, which is still more than -43 % below the last cycle high.

crypto TOTAL3

Buy Crypto In May, Go Away: Arthur Hayes Shares His Top Altcoin Picks

In his most recent publication dated May 2, 2024, Arthur Hayes, the founder of exchange BitMEX, shared his insights into the crypto market’s recent tumultuous behavior and the broader macroeconomic signals shaping potential future trends. Titled “Mayday,” his essay directly addresses the crypto market, which has experienced significant volatility since mid-April.

Stealth Money Printing Is Commencing

Hayes begins by noting the observable distress in the crypto markets, which he attributes to a confluence of factors including the end of the US tax season, anticipatory fears about Federal Reserve policy decisions, the Bitcoin halving event, and stagnating growth in the assets under management (AUM) for US Bitcoin exchange-traded funds (ETFs).

He interprets these factors as a necessary purge of speculative excess, stating, “The tourists will sit out the next phase on the beach… if they can afford it. Us hard motherfuckers will hodl, and if possible, accumulate more of our favorite crypto reserve assets such as Bitcoin and Ether, and/or high-beta shitcoins like Solana, Dog Wif Hat, and dare I say Dogecoin (the OG doggie coin).”

A significant portion of Hayes’ analysis focuses on the Federal Reserve’s recent adjustment to its quantitative tightening (QT) program. Previously set at a reduction of $95 billion per month, the Fed has dialed this back to $60 billion.

Hayes interprets this as a covert form of quantitative easing, injecting an additional $35 billion per month into the dollar liquidity pool. He explains, “When you combine the Interest on Reserve Balances, RRP payments, and interest payments on US Treasury debt, the reduction in QT increases the amount of stimulus provided to the global asset markets each month.”

Hayes also scrutinizes actions by the US Treasury, particularly under Secretary Janet Yellen. He discusses the Treasury’s Quarterly Refunding Announcement (QRA), which outlines the expected borrowing and cash balances for upcoming quarters. For Q2 2024, the Treasury anticipates borrowing $243 billion, a figure Hayes points out is $41 billion higher than the previous forecast, due to lower-than-expected tax receipts.

He predicts this increased supply of Treasuries could lead to higher long-end rates, a situation Yellen may counter with yield curve control measures—a scenario that could catalyze a significant rally in Bitcoin and crypto prices.

Hayes touches on the failure of Republic First Bank, emphasizing the response by monetary authorities as a key indicator of systemic fragility. He criticizes the federal safety net that ensures all depositors are made whole, arguing that it masks deeper vulnerabilities within the US banking system and leads to a stealth form of money printing, as uninsured deposits are effectively guaranteed by the government. This, Hayes argues, is a fundamental misalignment that could lead to significant inflationary pressures.

Buy Crypto In May, Go Away

Hayes is candid about his investment strategies in the current environment. He advocates buying now. “I’m buying Solana and doggie coins for momentum trading positions. For longer-term shitcoin positions, I’m upping my allocations in Pendle and will identify other tokens that are ‘on sale.’ I will use the rest of May to increase my exposure. And then it’s time to set it, forget it, and wait for the market to appreciate the inflationary nature of the recent US monetary policy announcements.”

He concludes with a broad prediction that, despite the market’s recent volatility, the underlying liquidity conditions created by US monetary and fiscal policies will provide a floor for crypto prices, leading to a gradual upward trend. “While I don’t expect crypto to fully realize the recent US monetary announcements’ inflationary nature immediately, I expect prices to bottom, chop, and begin a slow grind higher,” he states, signaling his bullish outlook.

For Bitcoin, Hayes predicts that the premier cryptocurrency will recapture the key $60,000 level and then move in a range between $60,000 and $70,000 until August because of the annual summer lull.

At press time, BTC traded at $59,393.

Bitcoin price

Bitcoin Bull Run Over? Analyst Predicts What To Expect Now

The recent plummet in Bitcoin’s value below the $60,000 mark has sparked widespread speculation within the crypto community, raising questions among investors and market watchers about the future direction of its price. Marco Johanning, a well-known crypto analyst and founder of The Summit Club, took to X (formerly Twitter) to provide his insights on the current market conditions and what might be expected next.

According to Johanning, the recent price action does not signify a market downturn but rather a correction within an ongoing bull market. He emphasizes, “Bitcoin lost the range. What now? First and foremost, a reminder: we are in a bull market, and this is a correction. This is not a rally in a bear market. Or in other words, the high time frame trend is up no matter what.”

He supported this assertion with several indicators of a continued bullish trend. First, Bitcoin reached its bear market bottom in November 2022 and subsequently broke above the 200-day moving average, a critical indicator of long-term market trends. Following a drop below the 200-day moving average, there was a significant breakout above this level and THE major high time frame resistance in October 2023.

Moreover, Bitcoin achieved a new all-time high in March 2024. Over the last 18 months, Bitcoin has consistently recorded higher highs and higher lows, which are typical characteristics of a bullish market.

“This can’t be a bear market,” Johanning explained. “These elements underscore a fundamental bias crucial for assuming that the current drop is part of a broader bull market trend. Therefore, Bitcoin will eventually find a local bottom and ascend higher.”

Bitcoin Price Analysis: What To Expect Next?

Johanning provided a detailed breakdown of possible future scenarios based on technical analysis. His first scenario is based on the monthly chart where the most crucial level is at $48,000-$49,000. This level is key because it was a major hurdle overcome in February 2024. Now, it might serve as the perfect point for a bullish retest.

Furthermore, there’s a significant market imbalance down to the $48,000-$49,000 range, coinciding with the 0.5 Fibonacci retracement level from the last monthly swing low. This setup suggests a strong potential for price stabilization and reversal at this level, according to Johanning.

Bitcoin price analysis

The second scenario grounds on the weekly chart where the important level is at $52,000. This level acts as a major high time frame support/resistance, marked by a weekly imbalance that extends up to $52,000, and it matches the 0.382 Fibonacci retracement from the bottom to the top of the last major rally, and the 0.618 level from the last swing low to the top.

Bitcoin price analysis

The third scenario is based on the lower timeframes. Here, the most significant level is at $57,000. This mark is critical as it represents the 0.5 Fibonacci level from the last swing low and was a key area during the February climb. This level might serve as the stage for a potential deviation or price trap.

Bitcoin price analysis

“The recent bearish engulfing pattern breaking the monthly levels, followed by a bearish retest, signals significant market shifts,” noted Johanning. “If Bitcoin swiftly reclaims these key levels, particularly the $57,000 mark, we could see a deviation scenario unfold. Otherwise, the $52,000 or $48,000-$49,000 levels will likely be tested, each representing a higher low in the ongoing uptrend.”

Impact on Altcoins And Market Strategy

Altcoins have displayed remarkable resilience in the face of Bitcoin’s volatility, which Johanning finds particularly promising. “Usually, a significant drop in Bitcoin accompanied by a loss of a higher time frame range would lead to severe declines in altcoins. However, their strength yesterday is a good indicator that the worst may be over for altcoins,” he commented.

Johanning concluded his analysis with an optimistic outlook for both Bitcoin and altcoins, expressing confidence in the continuation of the bull market. He is actively accumulating more at current prices, anticipating substantial returns: “No matter which scenario plays out, I am committed to this trend until proven otherwise. I’m investing heavily, and if we truly remain in a bull market, the potential for profit is tremendous.”

At press time, BTC traded at $58,328.

Bitcoin price

Buy Dogecoin Now? Analyst Believes DOGE Is Primed For A Surge

In an analysis shared via X, crypto analyst Ali Martinez elaborated on the ongoing price correction of Dogecoin (DOGE), positing that it is a consistent precursor to major bull runs, drawing on historical patterns to forecast future price movements.

Martinez’s commentary centers on the chart pattern known as the “descending triangle.” This is a bearish formation that occurs when the price follows a downward trendline intersecting a flat support line. Typically, this pattern indicates a continuation of a downward trend, but in the context of Dogecoin, Martinez suggests it precedes significant bullish breakouts.

“The ongoing Dogecoin price correction is part of its usual behavior before massive bull runs! Let’s dive in,” Martinez shared. He explained the historical significance of this pattern in Dogecoin’s trading history: “In 2017, DOGE broke out of a descending triangle. Then, DOGE retraced by 40% before entering a 982% bull run!”

Martinez further analyzed more recent cycles to reinforce his observations, “In 2021, DOGE broke out of a descending triangle again. Then, DOGE retraced by 56% before skyrocketing by 12,197%!” According to Martinez, these retracements are not random but are characteristic of how Dogecoin has behaved in previous cycles, setting the stage for explosive gains.

The analyst drew parallels to the current market conditions: “Now, in 2024, DOGE has yet again broken out of a descending triangle! It is currently undergoing a 47% price correction, very similar to previous cycles, which could ignite the next DOGE bull run!” This assertion suggests that the current market downturn might be an opportune buying moment ahead of potential gains.

DOGE price analysis

Martinez’s analysis underscores the cyclical nature of Dogecoin’s price movements, suggesting a pattern of sharp declines followed by dramatic recoveries. “Over the years, Dogecoin appears to mirror its previous bull cycles! All you need is a little bit of patience,” he concluded.

Short-Term Dogecoin Price Analysis

Amidst this optimistic prediction, the Dogecoin price is in a precarious scenario in the short-term. Since mid-April, DOGE has experienced significant technical resistance. Particularly, the DOGE price was consistently rejected at the 50-day EMA over multiple instances, indicating strong selling pressure at higher price levels.

Amid a broader market downturn, the trajectory was accentuated when Dogecoin’s price broke below the crucial 100-day EMA. This level, often watched by traders for signs of medium-term market direction, had previously offered support. The breach underscores a weakening market sentiment and could signal extended losses.

Dogecoin price

As of press time, Dogecoin’s price hovered near $0.1259 after narrowly holding above the 200-day EMA yesterday, a key psychological and technical barrier. This moving average is now a pivotal point for Dogecoin; its sustained breach on the daily chart could significantly alter the market structure, potentially triggering a slide towards the $0.1005 support level.

The Relative Strength Index (RSI) is at 31.63, edging close to the oversold territory but not conclusively signaling an imminent reversal. This indicates that while the market is nearing oversold conditions, the selling pressure has not fully abated. One last leg down might be necessary to get DOGE into “oversold” territory in order to mark a local bottom.

Bitcoin Price Dips Below $57,000: 4 Key Reasons

Bitcoin (BTC) has witnessed a significant drop, falling to $56,556 during Wednesday morning in Europe, marking the lowest point since late February. This downturn represents the sharpest monthly decline since November 2022, with BTC tumbling approximately 7.5% within the last 24 hours and breaching the previously stable $60,000 support late Tuesday.

#1 Derisking Before Today’s FOMC Meeting

Anticipation and anxiety are high in financial circles as the Federal Open Market Committee (FOMC) is set to announce its interest rate decision later today. This event is crucial as the crypto market, notably Bitcoin, has grown increasingly reactive to macroeconomic signals.

Recent data, reflecting a slowdown in GDP growth coupled with persistent inflation, has significantly reduced expectations of interest rate cuts by the Federal Reserve. “Bitcoin and other risk assets are currently feeling the pressure from a stagflationary environment, geopolitical tensions, and seasonal liquidity variations,” remarked Ted from TalkingMacro.

Initially, up to seven rate cuts were anticipated by the end of 2024, a sentiment that has shifted dramatically with the market now pricing in only one potential cut by December 2024. This shift comes amidst an environment where inflation data is trending upwards, challenging the Federal Reserve’s position and potentially leading to a more cautious approach from Jerome Powell, the Fed Chairman.

“For the first time in recent memory, the market is calling the Fed’s bluff, quickly front-running the idea that the Fed may not cut at all in 2024,” noted Ted.

#2 Cyclical Bitcoin Correction Phase

Following an exceptional rally since the year’s start, the market is undergoing a natural correction phase. Prior to the price crash, Charles Edwards, founder of Capriole Investments, noted: “We are a day short of breaking the record set in 2011 for days without a meaningful dip [-25%],” emphasizing the extraordinary nature of Bitcoin’s recent performance.

Scott Melker, known as “The Wolf Of All Streets,” highlighted technical indicators that suggested an impending correction. “Broke and retested range lows as resistance. […] My biggest concern I have been discussing for months [was] that RSI never made the trip to oversold. Almost there now, all lower time frames oversold. This is still ONLY A 23% correction, very shallow for a bull market and consistent with other corrections on this run. We are yet to see a 30-40% pull back during this bull market, like those of the past.”

#3 Profit-Taking

Traditional finance markets and seasoned investors are seizing the opportunity to take profits following substantial gains. “TradFi/Boomers are taking profits: CME Open Interest is decreasing rapidly, April 29th 135,6k coins, April 30th 123,9k coins, topped around 170.4k coins (March 20th),” explained crypto analyst RunnerXBT.

This trend confirms a broader profit-taking strategy post significant events like the ETF approval and the anticipation around the Bitcoin halving. “That […] confirms my thesis that a lot of these guys longed in October 2023 because of ETF approval and BTC halving, trade played out and now they are taking profits (yes they are still up a lot), because they longed BTC not dead altcoins.”

#4 US ETF Flows And Hong Kong Disappointment

The dynamics surrounding spot Bitcoin ETFs have shown significant strains, evidenced by recent activities in both US and Hong Kong markets. In the United States, Bitcoin exchange-traded funds (ETFs) faced substantial outflows, indicating a cooling investor sentiment.

According to recent data, the total outflows from US spot Bitcoin ETFs amounted to $161.6 million. Notably, the Grayscale Bitcoin Trust (GBTC) experienced outflows of $93.2 million, while Fidelity and Bitwise registered outflows of $35.3 million and $34.3 million, respectively. BlackRock had zero net flows once again. These numbers suggest a retreat in institutional interest, which has traditionally been a bulwark against price volatility.

Parallel to the US, the debut of Bitcoin ETFs in Hong Kong also faltered significantly below expectations. Six newly launched ETFs, intended to capture both Bitcoin and Ethereum markets, collectively reached just $11 million in trading volume, starkly underperforming against the anticipated $100 million. The spot Bitcoin ETFs accounted for $8.5 million in trading volume. This was markedly lower than the launch day volumes of US-based spot Bitcoin ETFs, which had reached $655 million on their first day.

#5 Long Liquidations

The market has also been impacted by substantial long liquidations, with a total of $451.28 million liquidated in the last 24 hours alone. The largest single liquidation was an ETH-USDT-SWAP on OKX valued at $6.07 million, but Bitcoin-specific liquidations were significant as well, totaling $143.04 million, according to data from CoinGlass. These liquidations have amplified the selling pressure on Bitcoin.

At press time, BTC traded at $57,715.

Bitcoin price

If History Repeats, This Is How Bitcoin Price Will Perform In The Next 6 Months

In a recent thread on X (formerly Twitter), renowned on-chain analyst Checkmate provided an analysis regarding the future trajectory of Bitcoin. Currently, the premier cryptocurrency hovers around the $60,000 mark, a pivotal moment that echoes historical patterns within the Bitcoin market cycle.

What Will The Next 6 Months Bring For Bitcoin?

Checkmate argues that Bitcoin is positioned in a “chopsolidation” phase—a term coined to describe a stagnant yet volatile period. He suggests that this could last approximately six months, based on previous cycles, and potentially usher in a period of parabolic growth that could last between six to twelve months. “Bitcoin history tends to rhyme, and thus far, this cycle is no different,” Checkmate noted. “The song sung during the last two cycles paints around 6-months of chopsolidation ahead of us, followed by 6-12 months of parabolic advance.”

Bitcoin Index Performance Since Cycle Low

Supporting his analysis, Checkmate refers to April 2021 as a significant high point for Bitcoin for “many good reasons,” noting that despite a considerable monthly drop of over $8,250 in April, such movements are typical and often signify healthy market corrections. “It’s an -11.2% monthly pullback, and is extremely common during uptrends, and corrections are healthy and necessary,” he stated, reinforcing his confidence in Bitcoin’s resilience and potential for recovery.

Bitcoin Monthly Price Performance

Further statistical backing comes from historical data focused exclusively on Bitcoin halving years (2012, 2016, 2020, and 2024), which Checkmate used to illustrate that such month-over-month corrections are not outliers but rather common occurrences within the digital asset’s cyclical trends. The end of each year post-halving has historically shown strong performance, supporting the notion that the current price point could be a precursor to significant gains.

Bitcoin Index Performance Since Cycle ATH
Sell In May And Go Away?

Checkmate also retweeted a post from Charles Edwards. The founder of Capriole Investments commented on the market’s unprecedented bullishness, implying that a deeper correction is to be expected.

“This is starting to get ridiculous. Bitcoin has not had a run like this since inception. We are now 1 day short of the record set in 2011 for days without a meaningful dip [more than 25%]. If you are not prepared to accept some downside in this asset class, you shouldn’t be here. Especially now,” said Edwards. His remark highlights the unusual lack of severe downturns in the market, suggesting that investors should be prepared for potential volatility.

In another post on X, Edwards added a cautious note to the otherwise optimistic outlook. He advised, “Sell in May and go away. This looks like distribution to me. As long as we trade below $61.5K, scenario (1) is technically more likely. A strong reclaim of $61.5K would give some hopes to the bulls for scenario (2). A flush would also be good for the sustaining continuation of the bull market, the sooner we get one, the better the long opportunities are.”

Bitcoin price analysis

This perspective suggests a strategic withdrawal may be wise in the short term, implying that current market conditions might be more bearish than they appear and that a significant correction could potentially strengthen the market’s long-term prospects.

At press time, the BTC plunged to $57,691.

Bitcoin price

PEPE Chart Heats Up: Crypto Analyst Calls It One Of The Most Attractive

Cold Blooded Shiller (@ColdBloodShill), a well-known figure in the crypto analysis community, recently shared a technical analysis of the PEPE/USDT pair on Binance, marking it as one of the most promising charts in the current market landscape. With his analysis, posted to his 272,000 followers on X, he describes the potential movements of PEPE, both bullish and bearish, as it approaches a critical juncture on its trading chart.

Why PEPE Is One Of The Most Attractive Crypto’s Right Now

The chart, set on a four-hour time frame, details PEPE’s price action and its interaction with significant technical levels. A key focal point of Shiller’s analysis is the resistance-turned-support zone between approximately $0.0000063 and $0.0000062. This level, highlighted in green, previously acted as a strong resistance zone, and its conversion to support suggests a foundational shift in market sentiment towards PEPE.

PEPE price analysis

Moreover, PEPE is currently approaching a crucial resistance marked by a descending trend line in red, indicating a potential breakout point. However, Shiller cautiously notes that while the asset is on the verge of breaking this downtrend, there’s a risk of what he terms a “fakeout.” This scenario could see the price initially breaking above the trend line only to retract back below it, potentially leading to a decline of about 13% towards the established support zone at $0.0047423.

Should this support hold against market volatility—a common challenge in the crypto trading sphere—it may serve as a springboard for PEPE. Shiller speculates a possible rally that could result in a 47.47% increase from the support level, targeting an upper price level of $0.000011. Such a movement would not only confirm the strength of the current support but also signify a strong bullish market phase for PEPE.

The analysis also pays close attention to the Relative Strength Index (RSI) hovering near the 50 mark, a neutral territory that indicates the asset is neither overbought nor oversold. This positioning suggests the potential for significant price movement in either direction, emphasizing the importance of the upcoming potential breakout or fakeout scenario.

Cold Blooded Shiller’s analysis concludes with a nod towards taking a chance on PEPE if it begins to show signs of a firm breakout. His detailed observation and the technical markers he highlights suggest that, despite potential risks, the reward could indeed be substantial should favorable conditions prevail.

“PEPE [is] one of the sexiest looking charts out there right now. Consolidating above it’s former significant level. Does it have the chance for lower and some fuckery with a fakeout? Yes. Is it worth the opportunity shot if it starts to breakout? Absolutely yes,” he stated.

At press time, PEPE was trading at $0.000006976. Thus, the meme coin is approaching the 200-EMA at $0.000006677. If this support does not hold, a retest of the red support zone seems plausible.

PEPE price

XRP Price Edges Up As Ripple Forms Major Partnership In Japan

Ripple has announced a major partnership with Tokyo-based HashKey DX, a consulting company of the HashKey Group, to deploy XRP Ledger (XRPL)-powered enterprise solutions in Japan’s burgeoning blockchain sector. The announcement led to an immediate 1.9% increase in XRP’s price, although this gain was slightly pared back; as of the latest data, XRP stands 1.1% higher since the news broke.

The Ripple And HashKey Partnership: Details

The collaboration leverages the substantial success HashKey Group has seen in mainland China. HashKey‘s blockchain-powered solutions for supply chain finance have registered over 4,000 companies, including 23 banks and 4,300 suppliers. The total transaction volume through these solutions has exceeded $7 billion, with almost $3 billion in financing transactions.

In Japan, these blockchain solutions will be adapted and deployed through a partnership involving Ripple and SBI Ripple Asia, a joint venture between SBI Holdings and Ripple. The XRPL will be the foundational technology platform. This blockchain specializes in tokenizing and exchanging both crypto-native and real-world assets.

Andy Dan, a representative from HashKey DX, highlighted the efficiency and suitability of XRPL for their needs, stating, “The XRPL was the ideal blockchain infrastructure for us to build our proven supply chain finance solution. With its proven enterprise track record and unmatched performance metrics, including rapid settlement speeds, low costs, and scalability, we are confident in our ability to drive meaningful transformation and introduce innovative, cutting-edge solutions for businesses in Japan.”

Emi Yoshikawa, Vice President of Strategic Initiatives at Ripple, echoed this enthusiasm for the partnership: “We are excited to join forces with HashKey DX and SBI Ripple Asia to introduce XRP Ledger-powered solutions to Japan. This collaboration exemplifies our shared commitment to advancing blockchain technology and delivering tangible value to businesses.”

XRP Price Analysis

The initial spike in XRP’s price post-announcement reflects the market’s optimistic reception of Ripple’s strategic moves. However, the broader price action context reveals more complexity.

Over recent weeks, XRP has experienced volatility, notably breaking down from a symmetrical triangle pattern on the weekly chart that began forming in September 2021. This pattern typically indicates a period of consolidation, with the eventual breakout direction suggesting the prevailing market force.

XRP price

Currently, the breakdown suggests that sellers have gained the upper hand, with the triangle now acting as a resistance zone. XRP faces multiple hurdles ahead as it is currently trading below several critical exponential moving averages (EMAs) – 20, 50, 100, and 200-week EMAs, all nested within the former triangle pattern. This setup presents significant resistance levels that need to be overcome for bullish momentum to resume.

The Relative Strength Index (RSI), currently at 49, hovers near the neutral 50 mark, indicating that neither bulls nor bears have definitive control. This neutral position underlines the market’s current uncertainty, waiting for a catalyst that could drive the next significant price movement.

Should the bulls regain control and push the price above the triangle’s resistance, the 0.236 Fibonacci retracement level at $0.68410 could initiate a shift in sentiment and potentially more robust gains for XRP.

Legendary Trader Predicts When Bitcoin’s Bull Run Will End

In a recent analysis, veteran trader Peter Brandt delved into the price behavior of Bitcoin, suggesting that the cryptocurrency might have reached its peak for the current cycle. According to Brandt, Bitcoin is exhibiting signs of “Exponential Decay,” indicating a weakening in the momentum of its bull market cycles over the years.

“Does history make a case that Bitcoin has topped? It’s called Exponential Decay — and it describes Bitcoin,” Brandt wrote. He further explained, “The fact is that the bull market cycles in Bitcoin have lost a tremendous amount of thrust over the years… I don’t like the Exponential Decay occurring in Bitcoin — Bitcoin is one of my personal largest investment positions.”

Brandt provided a historical breakdown of Bitcoin’s bull cycles, noting a consistent decrease in the magnitude of gains:

  • The bull cycle from December 21, 2009, to June 6, 2011, demonstrated a staggering 3,191X advance.
  • The subsequent cycle from November 14, 2011, to November 25, 2013, showed a reduced yet impressive 572X advance.
  • The period from August 17, 2015, to December 18, 2017, recorded a further diminished 122X advance.
  • More recently, the cycle from December 10, 2018, to November 8, 2021, saw just a 22X advance.

Bitcoin Reached Its Cycle Peak With A Probability Of 25%

Drawing on these historical patterns, Brandt extrapolated that the current cycle, which began on November 21, 2022, would likely see an approximate 4.5X gain from its low of $15,473, predicting a potential high near $72,723. Notably, this peak has already been nearly met with a price of $73,835 recorded on March 14, 2024. Brandt underscores this observation with a caution, “The magnitude of each bull cycle has been roughly 20% of its predecessor, indicating significant energy loss.”

In his analysis, Brandt does not shy away from addressing the implications of Bitcoin’s halving events, which have historically been catalysts for substantial price increases. Despite this, he emphasizes the undeniable presence of the decay pattern: “But for now, we need to deal with the fact of Exponential Decay. It has happened. It is real. You may not want to believe it, but I place a 25% chance that Bitcoin has already topped for this cycle.”

In a communication on X, Brandt responded to a counter analysis by fellow analyst @Giovann35084111, who argued that Bitcoin follows a power law over time, suggesting the potential for ongoing growth despite the observed decay. Brandt acknowledged the validity. “Quite a thorough analysis,” Brand commented.

@Giovann35084111’s analysis extends beyond cyclical trends by illustrating how deviations from the power law at specific intervals, particularly around halving events, provide a structured prediction model. This approach projects systematic patterns in Bitcoin’s price movements, reinforcing a bullish outlook. The analyst predicts a significant rise in Bitcoin’s price, estimating the next top at the end of 2025 to reach between $210,000 and $250,000.

In a later post, Brandt emphasized that his main prediction is an ongoing bull market into September/October 2025. He explained, “I give more credence to a report I issued in February. Here is a chart from that analysis — projecting a bull market until Sep/Oct 2025,” indicating that his views are influenced by evolving market data and theoretical models.

At press time, BTC traded at $62,450.

Bitcoin price

Alarm Bells Ring For Dogecoin: Bearish Signal Points To 40% Crash

Crypto analyst Josh Olszewicz is once again warning of a looming Dogecoin price crash. The analysis hinges on the Ichimoku Cloud, a comprehensive indicator that provides information on support/resistance levels, momentum, and trend direction. Olszewicz’s analysis points to two specific technical phenomena on the 1-day (1D) chart of DOGE against the US dollar (DOGE/USD). Via X, he remarked “1D DOGE: bearish TK cross + bearish Kumo breakout.

Bearish Signals For Dogecoin

The bearish TK cross refers to the bearish crossover between the Tenkan-Sen (conversion line) and the Kijun-Sen (baseline) within the Ichimoku Cloud system.

Dogecoin price analysis

The Tenkan-Sen, which is a faster-moving line typically calculated as the midpoint of the highest high and lowest low over the last nine periods, crossing below the Kijun-Sen, a slower line computed as the midpoint of the highest high and the lowest low over the past 26 periods, is considered a bearish signal.

It suggests that short-term prices are falling below the base level of prices over the last month, indicating potential further downward movement.

The Bearish Kumo breakout: The ‘Kumo’, which translates to ‘cloud’, is part of the Ichimoku Cloud indicator and is formed between two other lines: the Senkou Span A and the Senkou Span B. It represents a key area on the chart that can act as support or resistance.

In the context of Olszewicz’s analysis, a ‘bearish Kumo breakout’ implies that the price has broken through the cloud downwards. This breakout is seen as a confirmation of a bearish trend. The fact that the price is below the Kumo suggests that the overall market sentiment for DOGE is negative, with the Kumo now likely acting as resistance to any upward price movement.

The chart by Olszewicz shows DOGE trading at $0.15 with the cloud plotted behind the price action, appearing green above and red below the price lines. The cloud turning green represents a bullish future potential, but the price below both the cloud and the Tenkan-Sen/Kijun-Sen crossover indicates bearish current circumstances.

A 40% Price Crash Looming?

This gives weight to Olszewicz previous DOGE price analysis. As NewsBTC reported, the crypto analyst warned of a potential Head and Shoulders (H&S) formation on the DOGE/USD 12-hour chart which could be validated soon.

The formation is characterized by two shoulders flanking a distinctive head, with the neckline at approximately $0.14 being pivotal. Should Dogecoin’s price break below this critical support, the prophecy of the H&S pattern would likely manifest, potentially triggering a sell-off towards the $0.10 to $0.09 region.

This target area aligns with the 1.618 and 2.0 Fibonacci extension levels, suggesting a price crash of around 40% from the neckline. While the pattern has not yet been confirmed, with the price still above the crucial $0.14 support level, its presence serves as a cautionary signal to the market.

The technical confluence of the bearish TK cross and the bearish Kumo breakout in Olszewicz’s recent analysis only reinforces the possible bearish scenario that lies ahead for Dogecoin. Market participants are recommended to keep a close watch on the $0.14 level, as a decisive break below could validate the bearish outlook and set the stage for the anticipated decline.

At press time, DOGE traded at $0.1413.

Dogecoin price

After WIF, BONK, BODEN: Top Crypto Trader Now Buys These 2 Memecoins

Memecoins are once making waves in the crypto market. In the last 24 hours, 4 of the 10 best-performing cryptocurrencies in the top 100 are meme coins. The biggest gainers include BONK (+10.2%), PEPE (+4.8%), WIF (+4.7%) and FLOKI (+4.1%). With meme coins slowly regaining, crypto traders are seemingly focusing on lesser-known coins.

Top Crypto Trader Focuses On These 2 Memecoins

According to data from on-chain analysis service Lookonchain, the renowned crypto trader known as “paulo.sol” has been making significant moves into new memecoin territories. Paulo.sol, who has previously amassed substantial profits from meme coins like BONK, WIF, and BODEN, is now shifting his focus to acquiring significant stakes in PUPS and POPCAT.

Lookonchain’s recent posts on X (formerly Twitter) provide a deep dive into paulo.sol’s past and present investment patterns. “What a legend! Paulo.sol has realized profits of $9.51M on WIF, $7.04M on BODEN, and $6.28M on BONK,” Lookonchain tweeted. In total, the crypto trader has made $22 million in realized profits.

The posts further reveal that paulo.sol bought into BONK early in November 2023, capturing substantial gains as its value surged. “As early as Nov 11, 2023, paulo.sol noticed the rising of BONK and bought BONK. He made ~$6.28M by buying BONK at low prices and selling at high,” the data provider stated.

The crypto trader continued his strategy by investing in WIF and BODEN in December 2023 and March 2024, respectively, following their sharp price increases. Notably, “paulo.sol did not buy WIF and BODEN when they first went online, but paid attention to and bought heavily when they first rose sharply,” Lookonchain observes.

As of now, paulo.sol continues to hold 12.87 million BODEN tokens valued at approximately $7.6 million and 1.87 million WIF tokens worth around $5.7 million. However, his most recent activities show a pivot towards new meme coins, PUPS and POPCAT, sparking interest among investors and analysts alike.

Lookonchain noted, “We noticed that paulo.sol is buying PUPS and POPCAT recently. He spent $1.77M to buy 4.3M POPCAT at $0.42 today. And he has spent $5.97M to buy 101,712 PUPS at $59 since Apr 11, becoming the largest holder of PUPS on Solana.”

The impact of paulo.sol’s investment has been palpable in the market dynamics of the newly favored meme coins. Despite a general downturn in the memecoin sector, POPCAT’s price surged by 52% today, trading at approximately $0.51 with a trading volume increase of 51% to $166 million. Over the past nine days, POPCAT has risen a whopping 410%.

On the other hand, PUPS is seeing a price drop of 4.2% today, trading at $36.96, with a 27% fall in trading volume to $2.82 million. Since reaching an all-time high above $152 on April 14 (on Coinex), the PUPS price is down more than 78%.

PUPS price

Crypto Bull Run Set To Return Next Week, Predicts Arthur Hayes

Arthur Hayes, co-founder and former CEO of the cryptocurrency exchange BitMEX, took to X to provide a detailed analysis of the US economic landscape and its potential effects on the crypto market. With a reputation for incisive commentary and a deep understanding of both traditional and digital finance, Hayes’s insights are closely watched by industry participants.

Why The Crypto Bull Run Will Return As Soon As Monday

In a post, Hayes noted a significant increase in the Treasury General Account (TGA), which he attributed to an influx of approximately $200 billion from tax receipts. “As expected tax receipts added roughly $200bn to TGA,” Hayes stated, setting the stage for a broader discussion on potential implications for financial markets.

Hayes then shifted focus to upcoming decisions by US Treasury Secretary Janet Yellen concerning the management of the TGA. With a tone mixing respect and sternness, he outlined several potential scenarios, each with profound implications for market liquidity. “Forget about the May Fed meeting. The 2Q24 refunding announcement comes out next week. What games will [Janet] Yellen play, here are some options,” Hayes remarked.

Firstly, he suggested that by “stopping issuing treasuries by running down the TGA to zero,” Yellen could unleash a $1 trillion liquidity injection into the economy. This strategy would involve using the accumulated funds in the TGA for federal spending without issuing new debt, thus directly boosting the money supply.

Secondly, Hayes speculated about “shifting more borrowing to T-bills, which removes money from RRP,” resulting in a $400 billion liquidity boost. This maneuver would involve the Treasury opting for shorter-duration debt instruments, which typically carry lower interest rates but increase the turnover of government securities. This could potentially draw funds away from the overnight reverse repo market, where financial institutions temporarily park their excess cash.

Combining these two approaches, according to Hayes, could lead to “a $1.4 trillion injection of liquidity” if Yellen decides to both cease long-term bond issuance and ramp up the issuance of bills while depleting both TGA and RRP accounts. Hayes emphatically noted, “The Fed is irrelevant, Yellen is a bad bitch, you best respect her.” This statement underscores his belief in the significant impact of Treasury actions over Federal Reserve policies in the current economic setup.

Hayes predicted that these actions could lead to a bullish response in the stock market and, more crucially, a rapid acceleration in the crypto market. “If any of these three options happen, expect a rally in stonks and most importantly a re-acceleration of the crypto bull market,” he explained.

The implications of such fiscal strategies are significant. Increased liquidity typically diminishes the appeal of low-yield investments like bonds and encourages the pursuit of higher returns in riskier assets, including equities and cryptocurrencies. Moreover, a shift in market sentiment toward ‘risk-on’ could see substantial capital flows into the crypto space, perceived as a high-growth, albeit volatile, investment frontier.

In conclusion, Hayes’ analysis suggests that the coming week – the refunding announcement comes on Monday, April 29 – could be critical for market watchers. His perspective, drawing from deep financial expertise, points to a possible pivotal shift in US fiscal policy that could ripple through global markets. For crypto investors, these developments could signal important movements, underlining the need for vigilance and readiness to respond to new economic signals.

At press time, BTC traded at $64,483.

Bitcoin price