Here’s When Bitcoin Could Peak In This Accelerated Bull Run: Analyst

The current Bitcoin price behavior and its deviations from expected cyclical patterns remain a central theme of analysis. Crypto analyst Rekt Capital (@rektcapital) recently shared new insights on X concerning Bitcoin’s potential peak during the ongoing bull run, which is progressing at an atypical pace compared to historical data.

When Will Bitcoin Peak This Cycle?

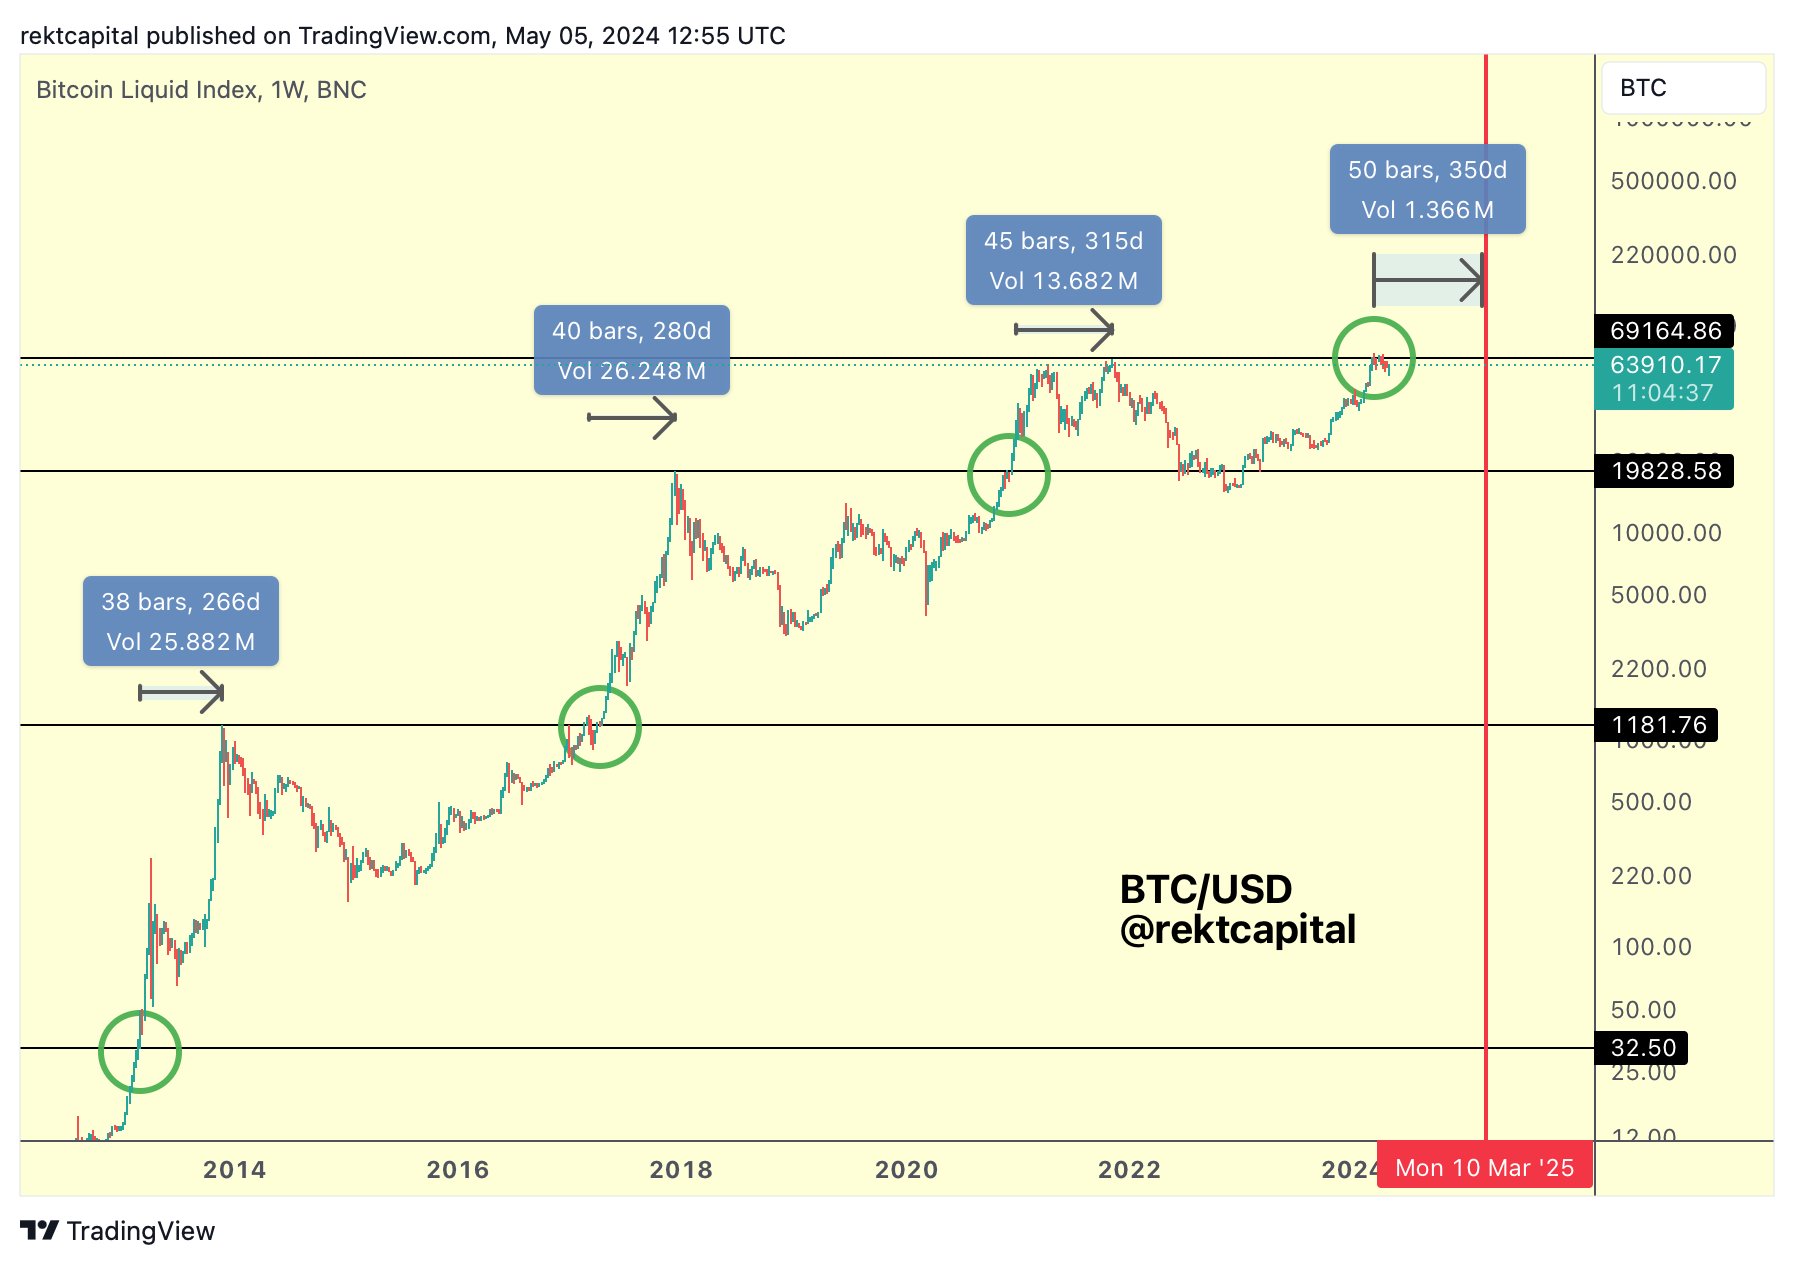
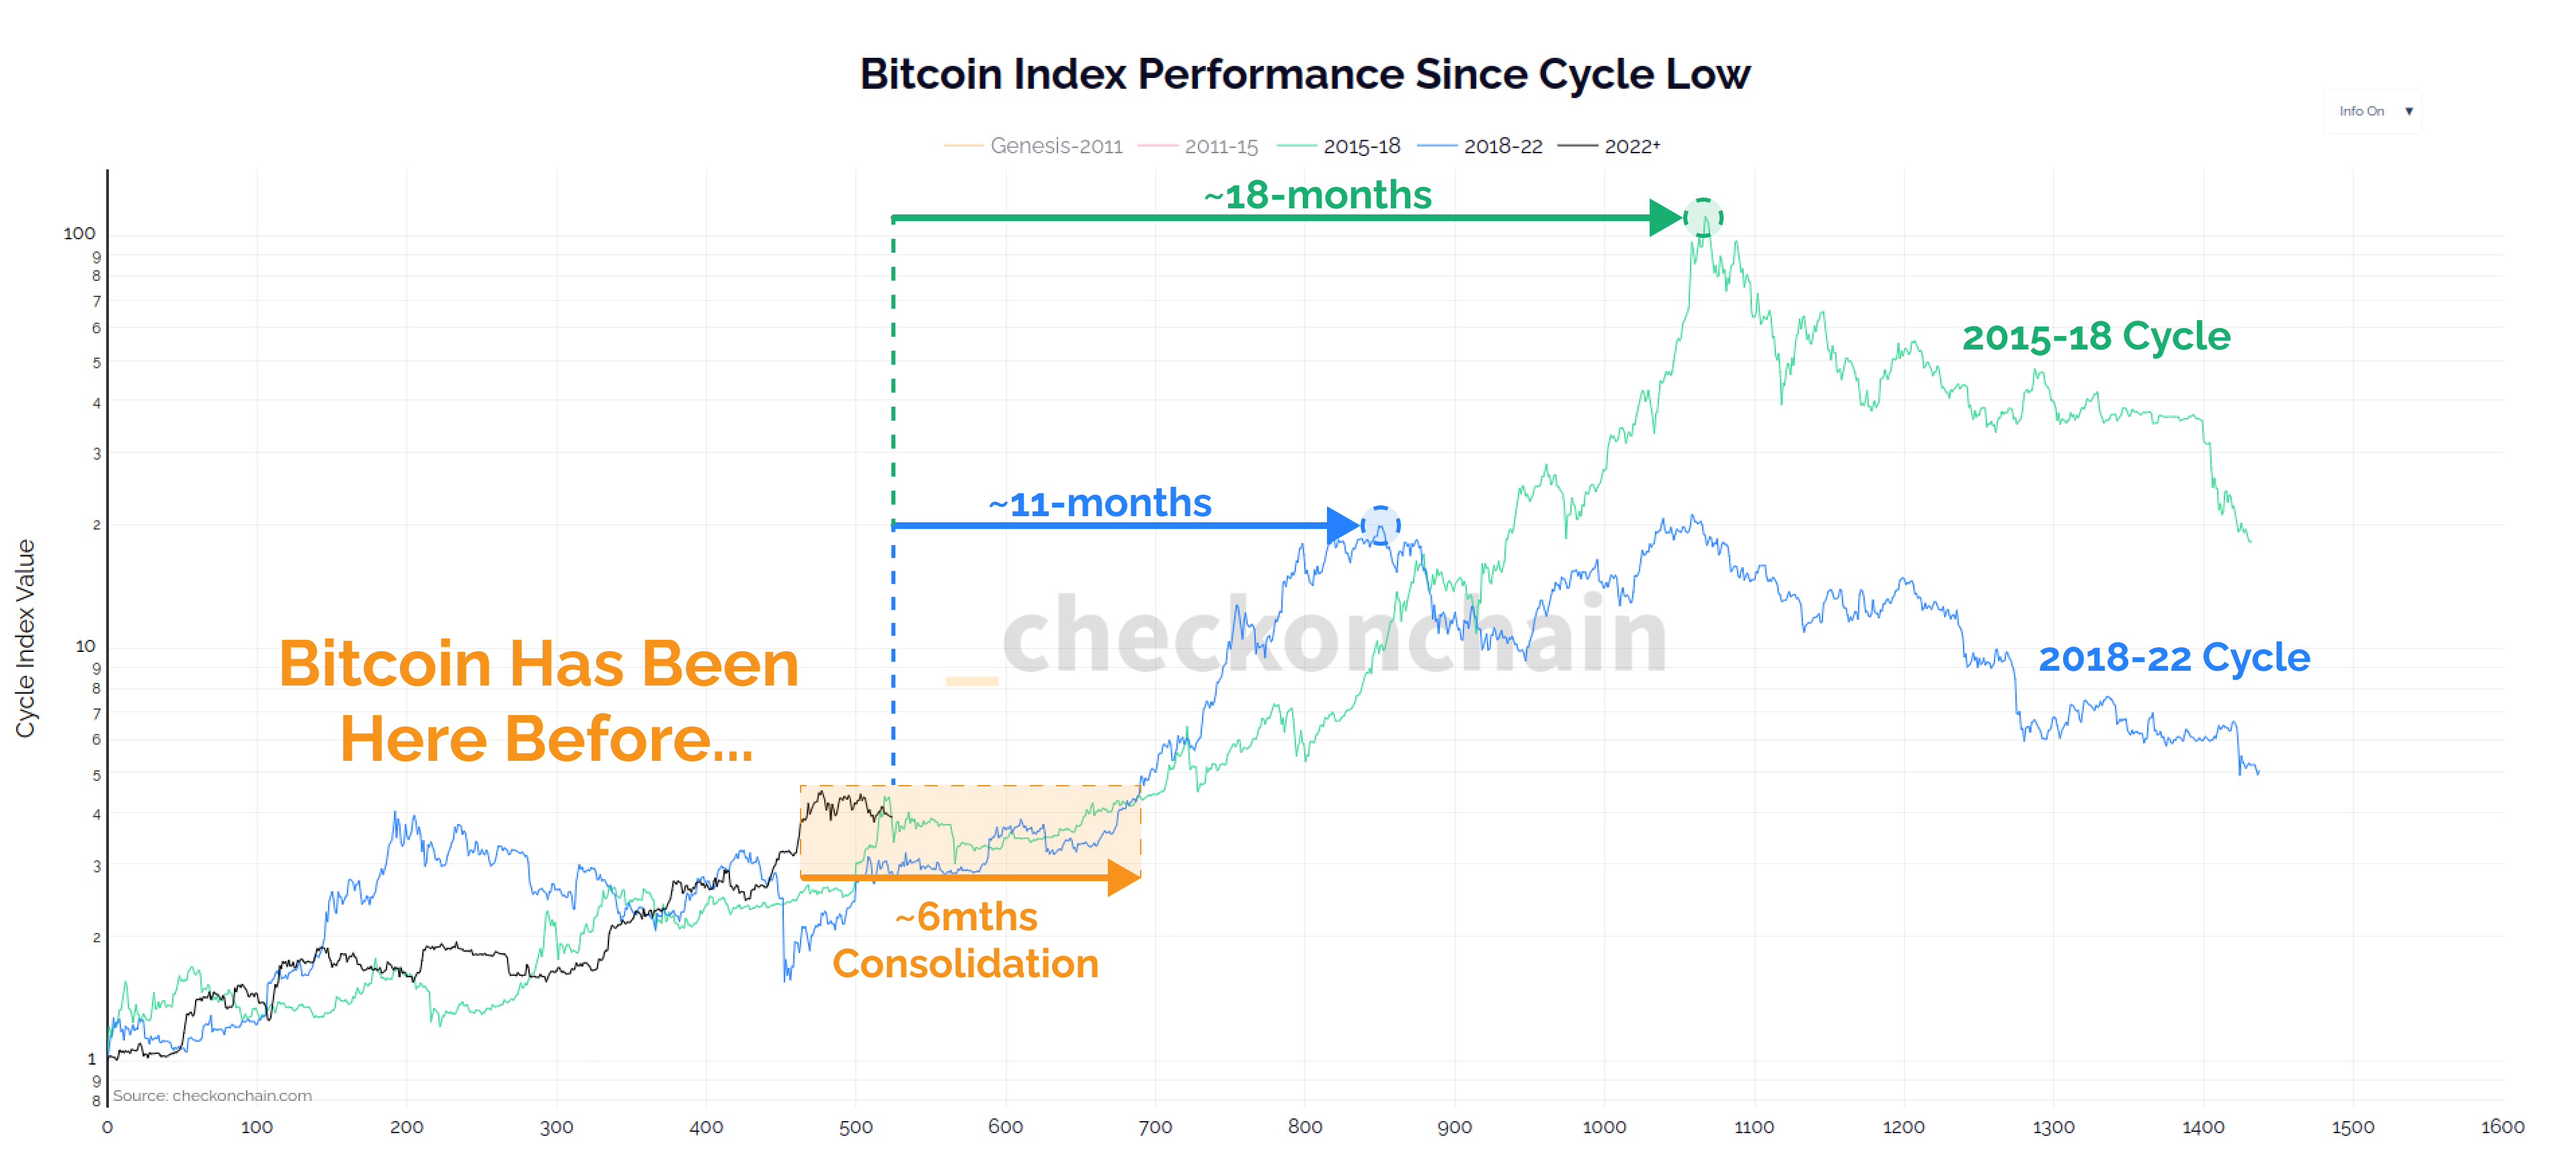
In a detailed post, Rekt Capital pointed out that as of mid-March 2024, Bitcoin had not only reached new all-time highs but had done so approximately 260 days ahead of its traditional halving-induced cycles. This marked a significant acceleration. “When Bitcoin rallied to new All Time Highs in mid-March 2024, Bitcoin was accelerating in its cycle by 260 days compared to traditional Halving Cycles,” stated Rekt Capital.

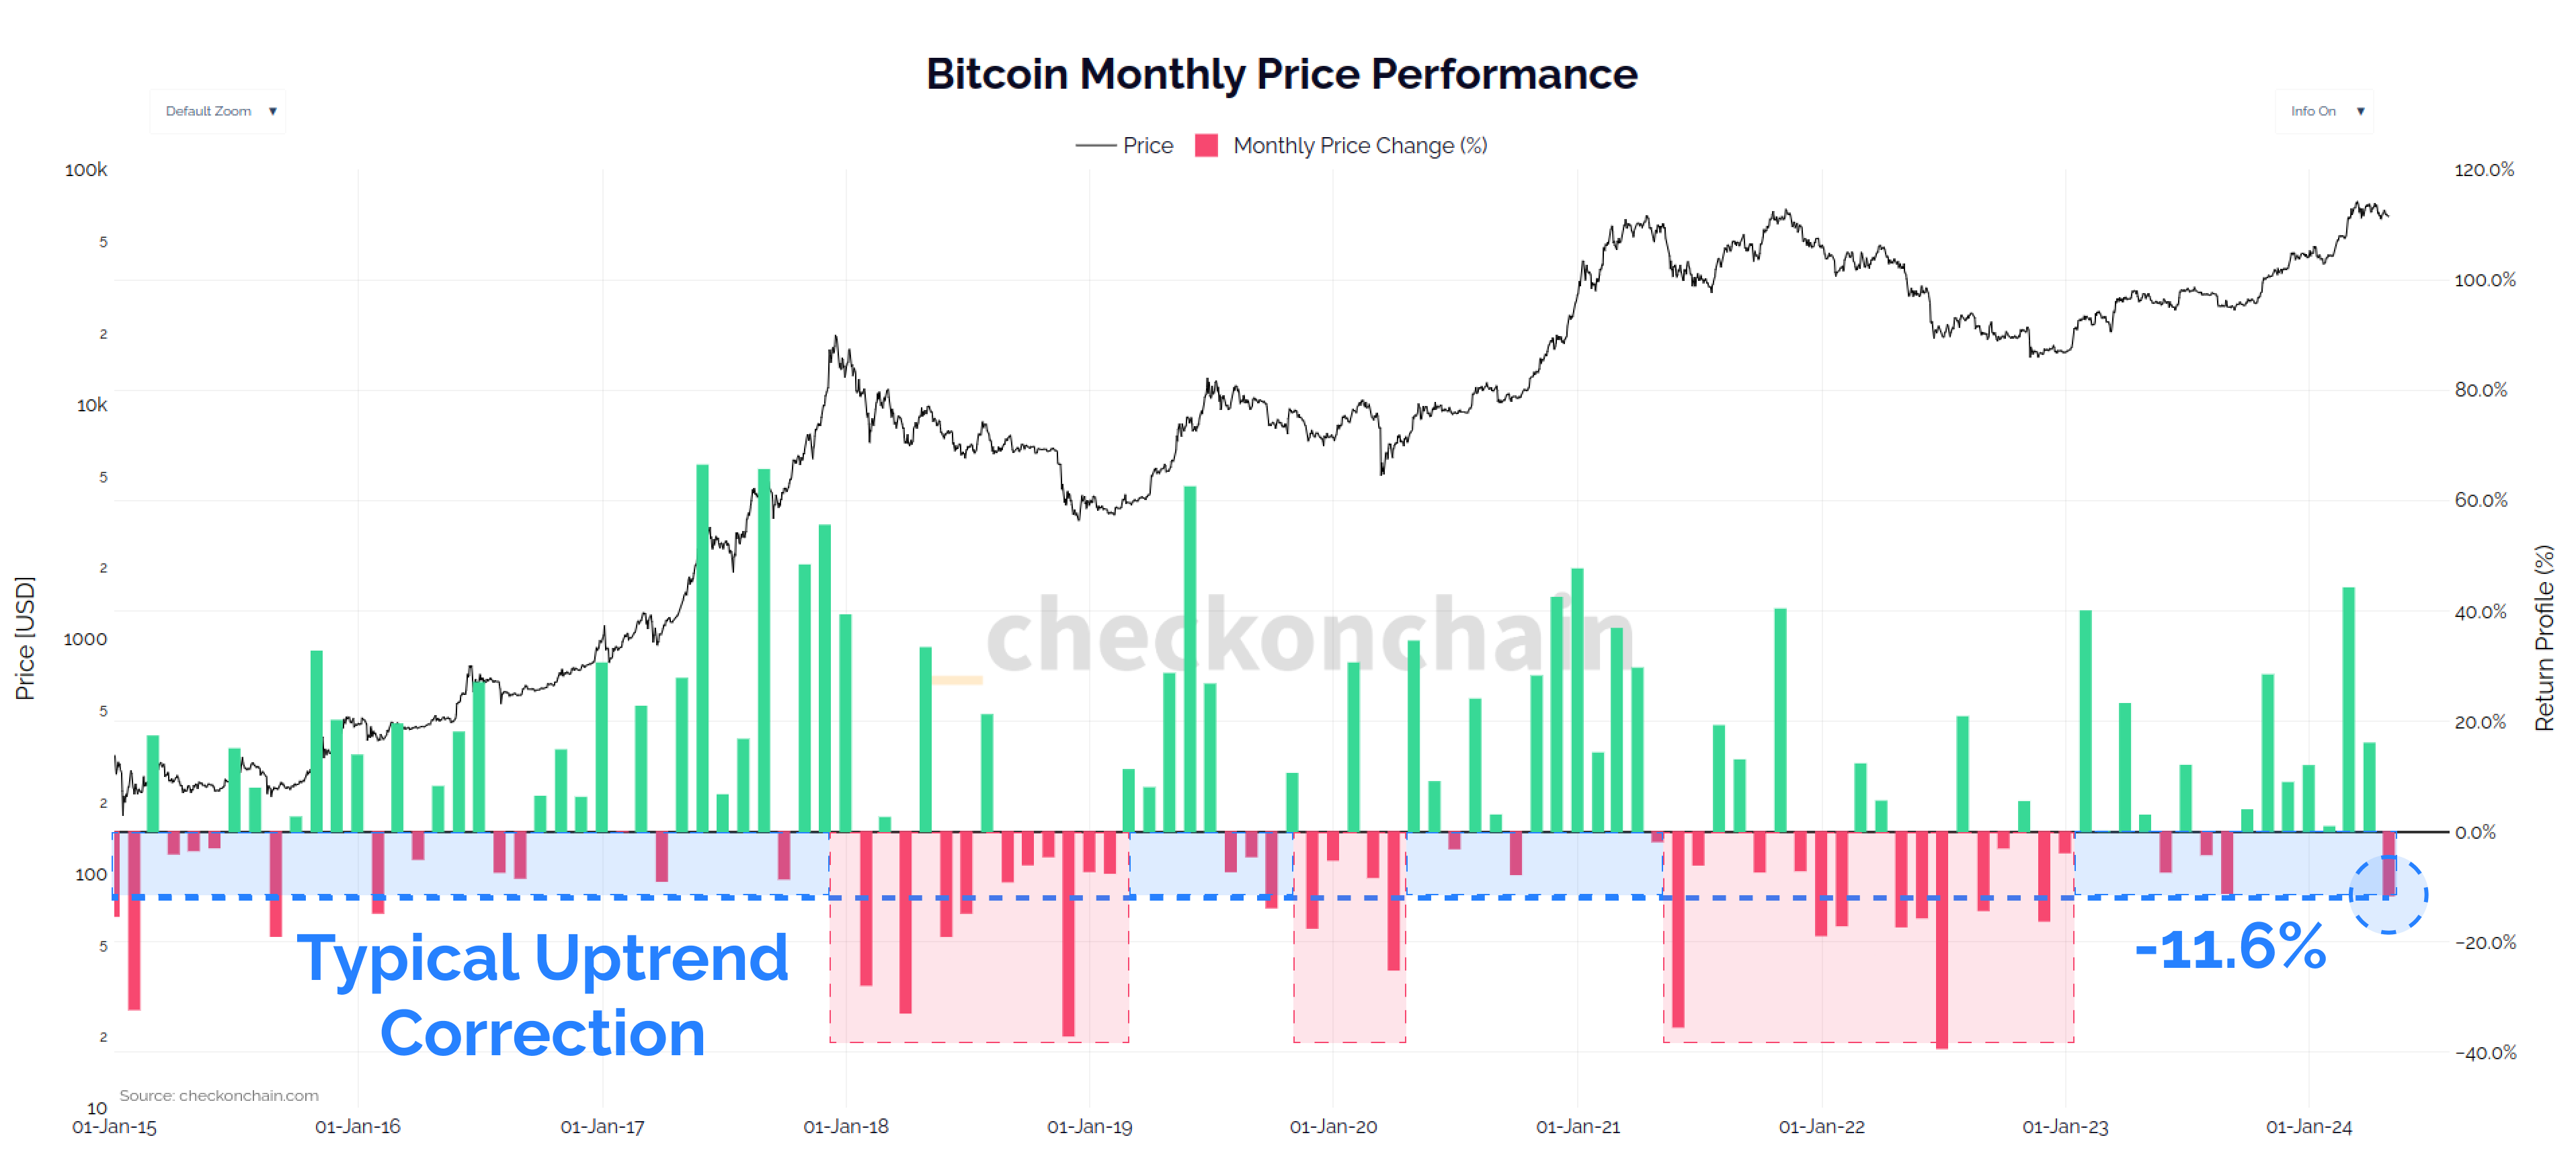
However, this rapid pace has not been sustained. Over the past two months, Bitcoin has been in a phase of consolidation, which has altered its trajectory. The acceleration advantage has decreased to about 210 days compared to previous cycles. This deceleration is a critical factor, as it could lead to a re-synchronization with the typical halving cycle. Typically, BTC peaks 518-546 days after a halving event.

The analyst suggests shifting the predictive focus from just halving events to the periods after Bitcoin surpasses its previous all-time highs. Historically, BTC price tends to reach a bull market top within 266 to 315 days after breaking these thresholds. Given that this milestone was achieved again in mid-March 2024, the projected window for the next bull market peak could be set between late November 2024 and late January 2025.

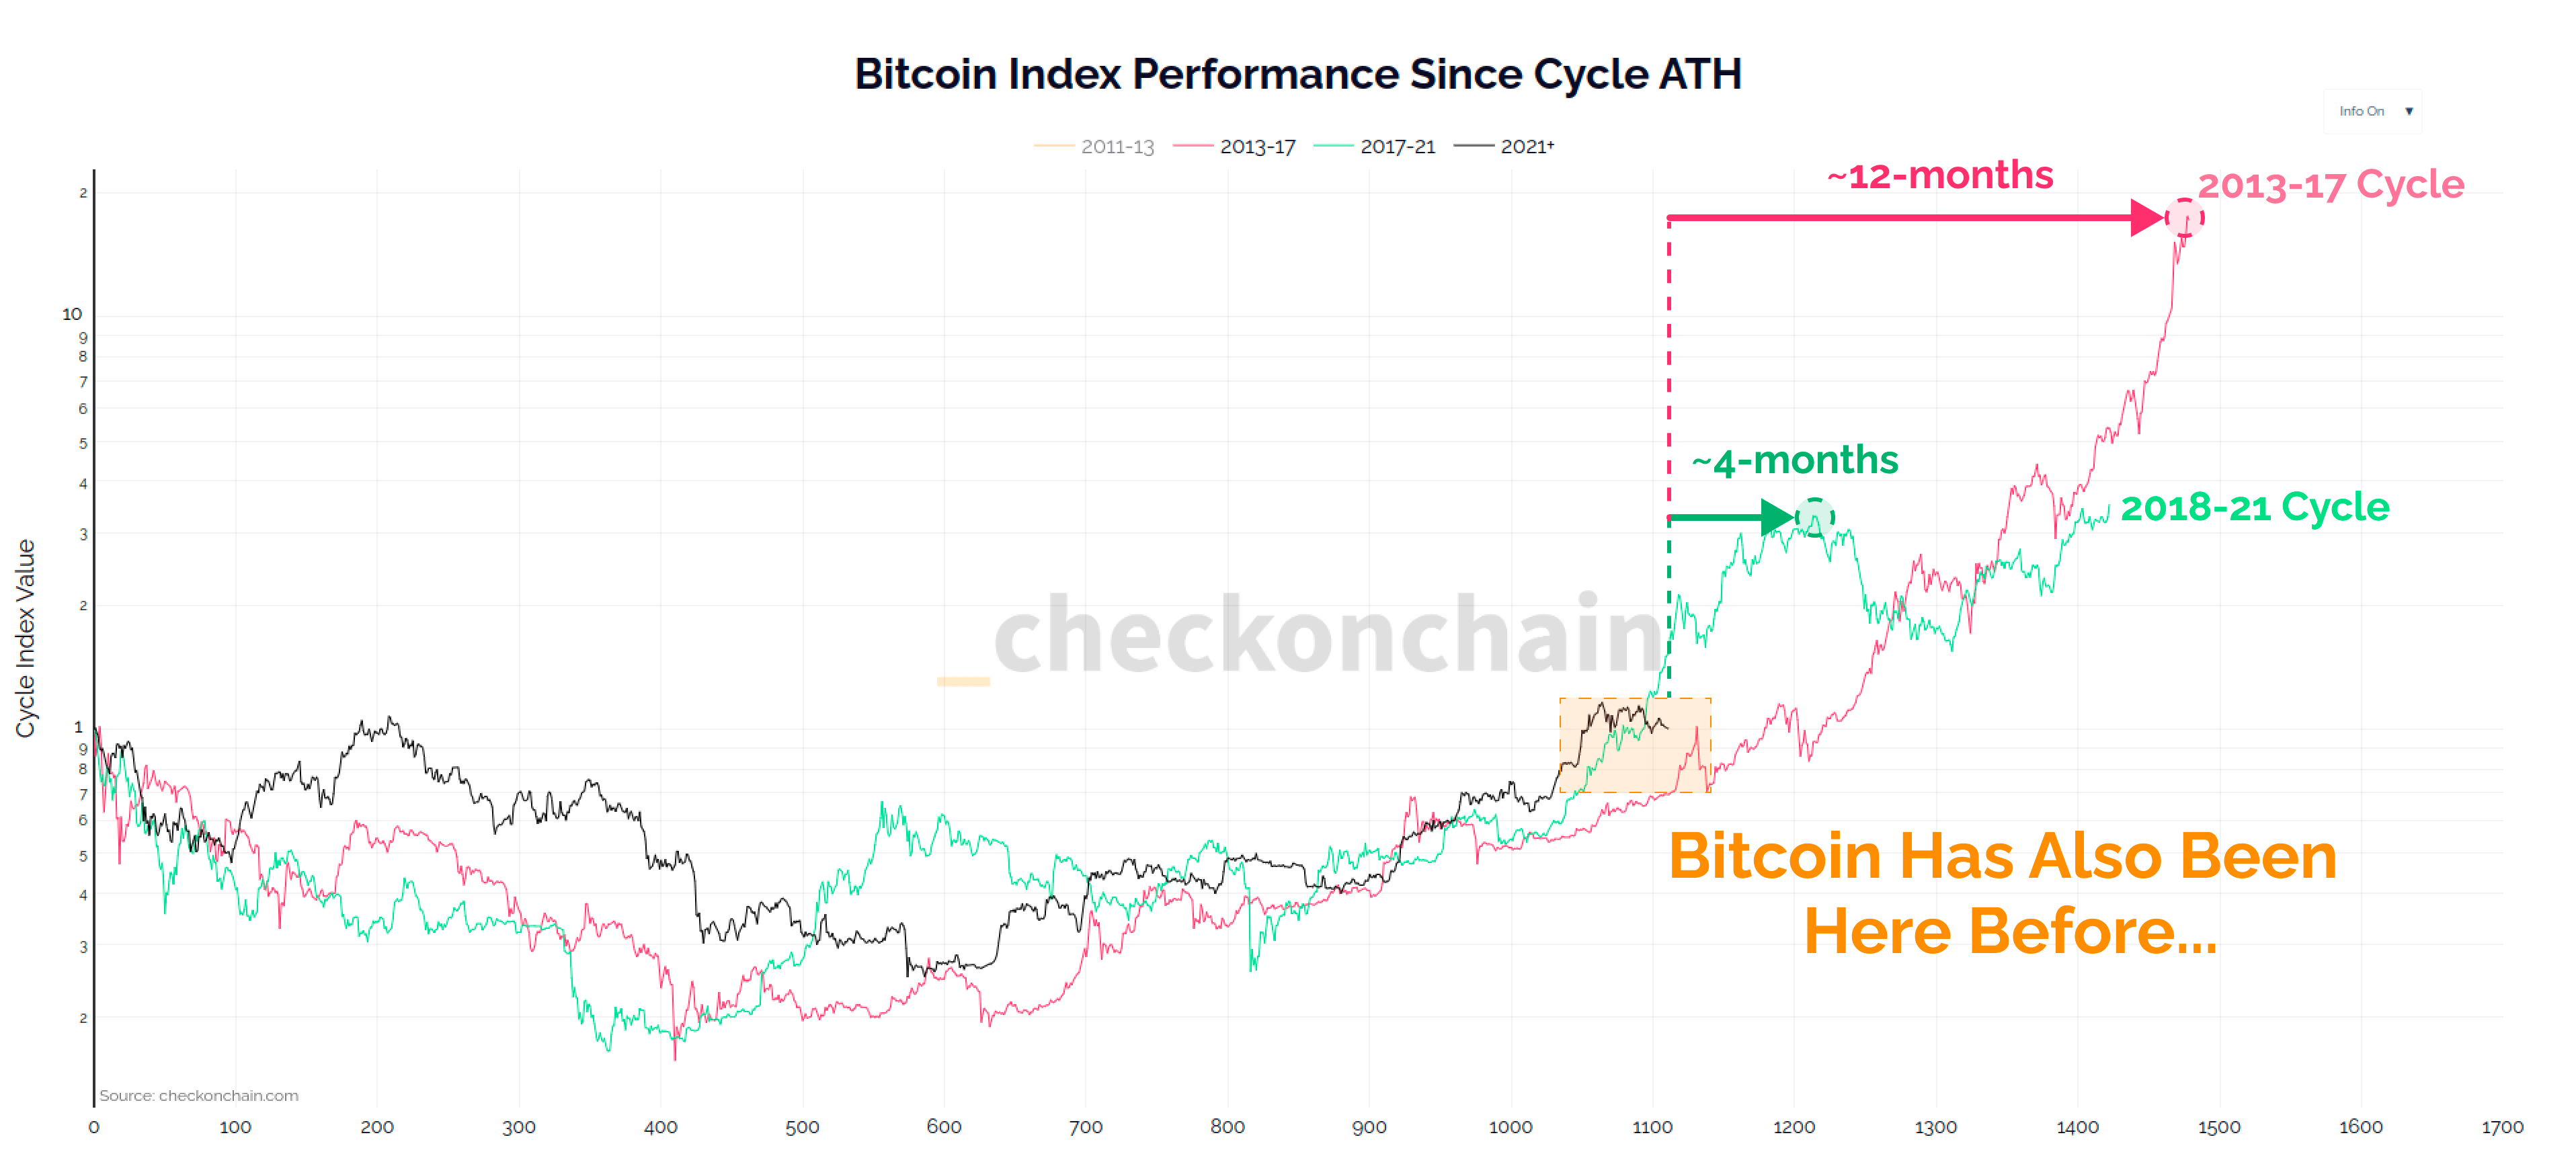
Nevertheless, a notable trend is the increasing duration for which Bitcoin maintains levels beyond its old highs. In 2013, this period lasted 268 days, in 2017 it extended to 280 days, and by 2021, it had increased to 315 days.
This pattern suggests an incremental extension of approximately 14 to 35 days per cycle. “Historically, the amount of days that Bitcoin has spent beyond old All Time Highs has increased by approximately 14 days to 35 days,” explained Rekt Capital.

Adding these increments to the initial range of 266 to 315 days post-old highs, the peak could potentially extend to between 280 and 350 days post-breakout. This adjustment shifts the expected peak time frame to between mid-December 2024 and early March 2025.

Bitcoin cycle analysis
Potential Synchronization With Halving Cycles

Despite the current accelerated cycle, there remains a possibility that further deceleration could align Bitcoin more closely with its halving cycle. In past cycles, such as those between 2015-2017 and 2019-2021, Bitcoin peaked at 518 and 546 days post-halving, respectively. If Bitcoin’s rate of acceleration continues to decrease, the cycle may eventually resynchronize, potentially delaying the peak to between mid-September and mid-October 2025.

Rekt Capital elaborates, “But if Bitcoin continues to reduce its current acceleration in the cycle, it would resynchronize with traditional Halving cycles.” This could result in a peak more aligned with historical patterns, diverging from the current accelerated timeline.

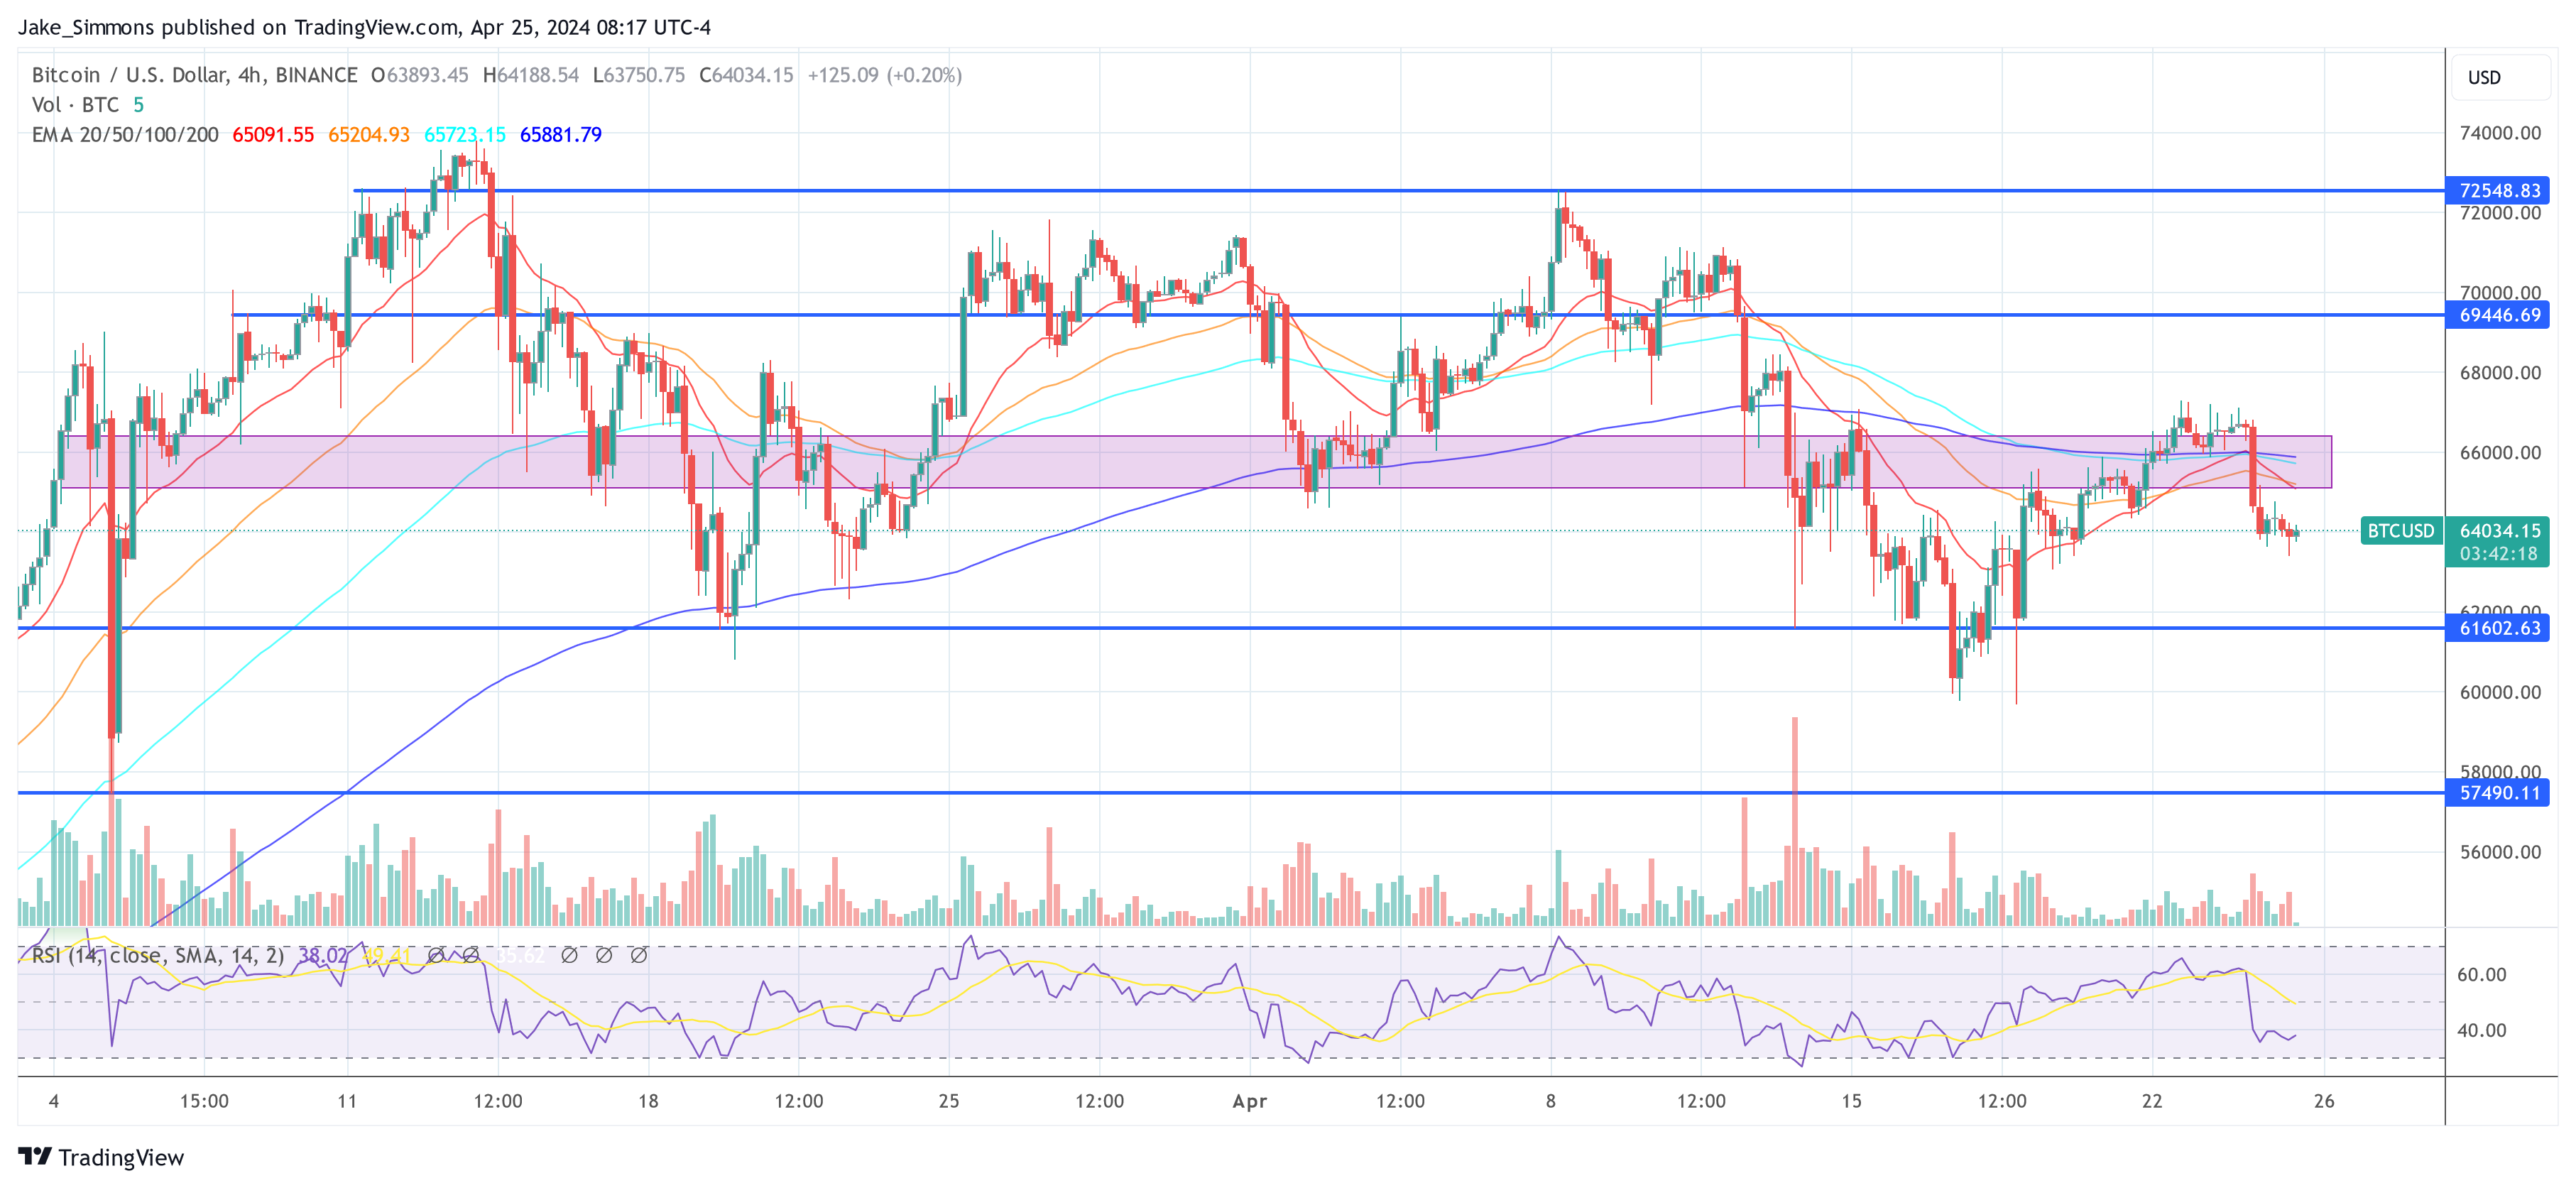
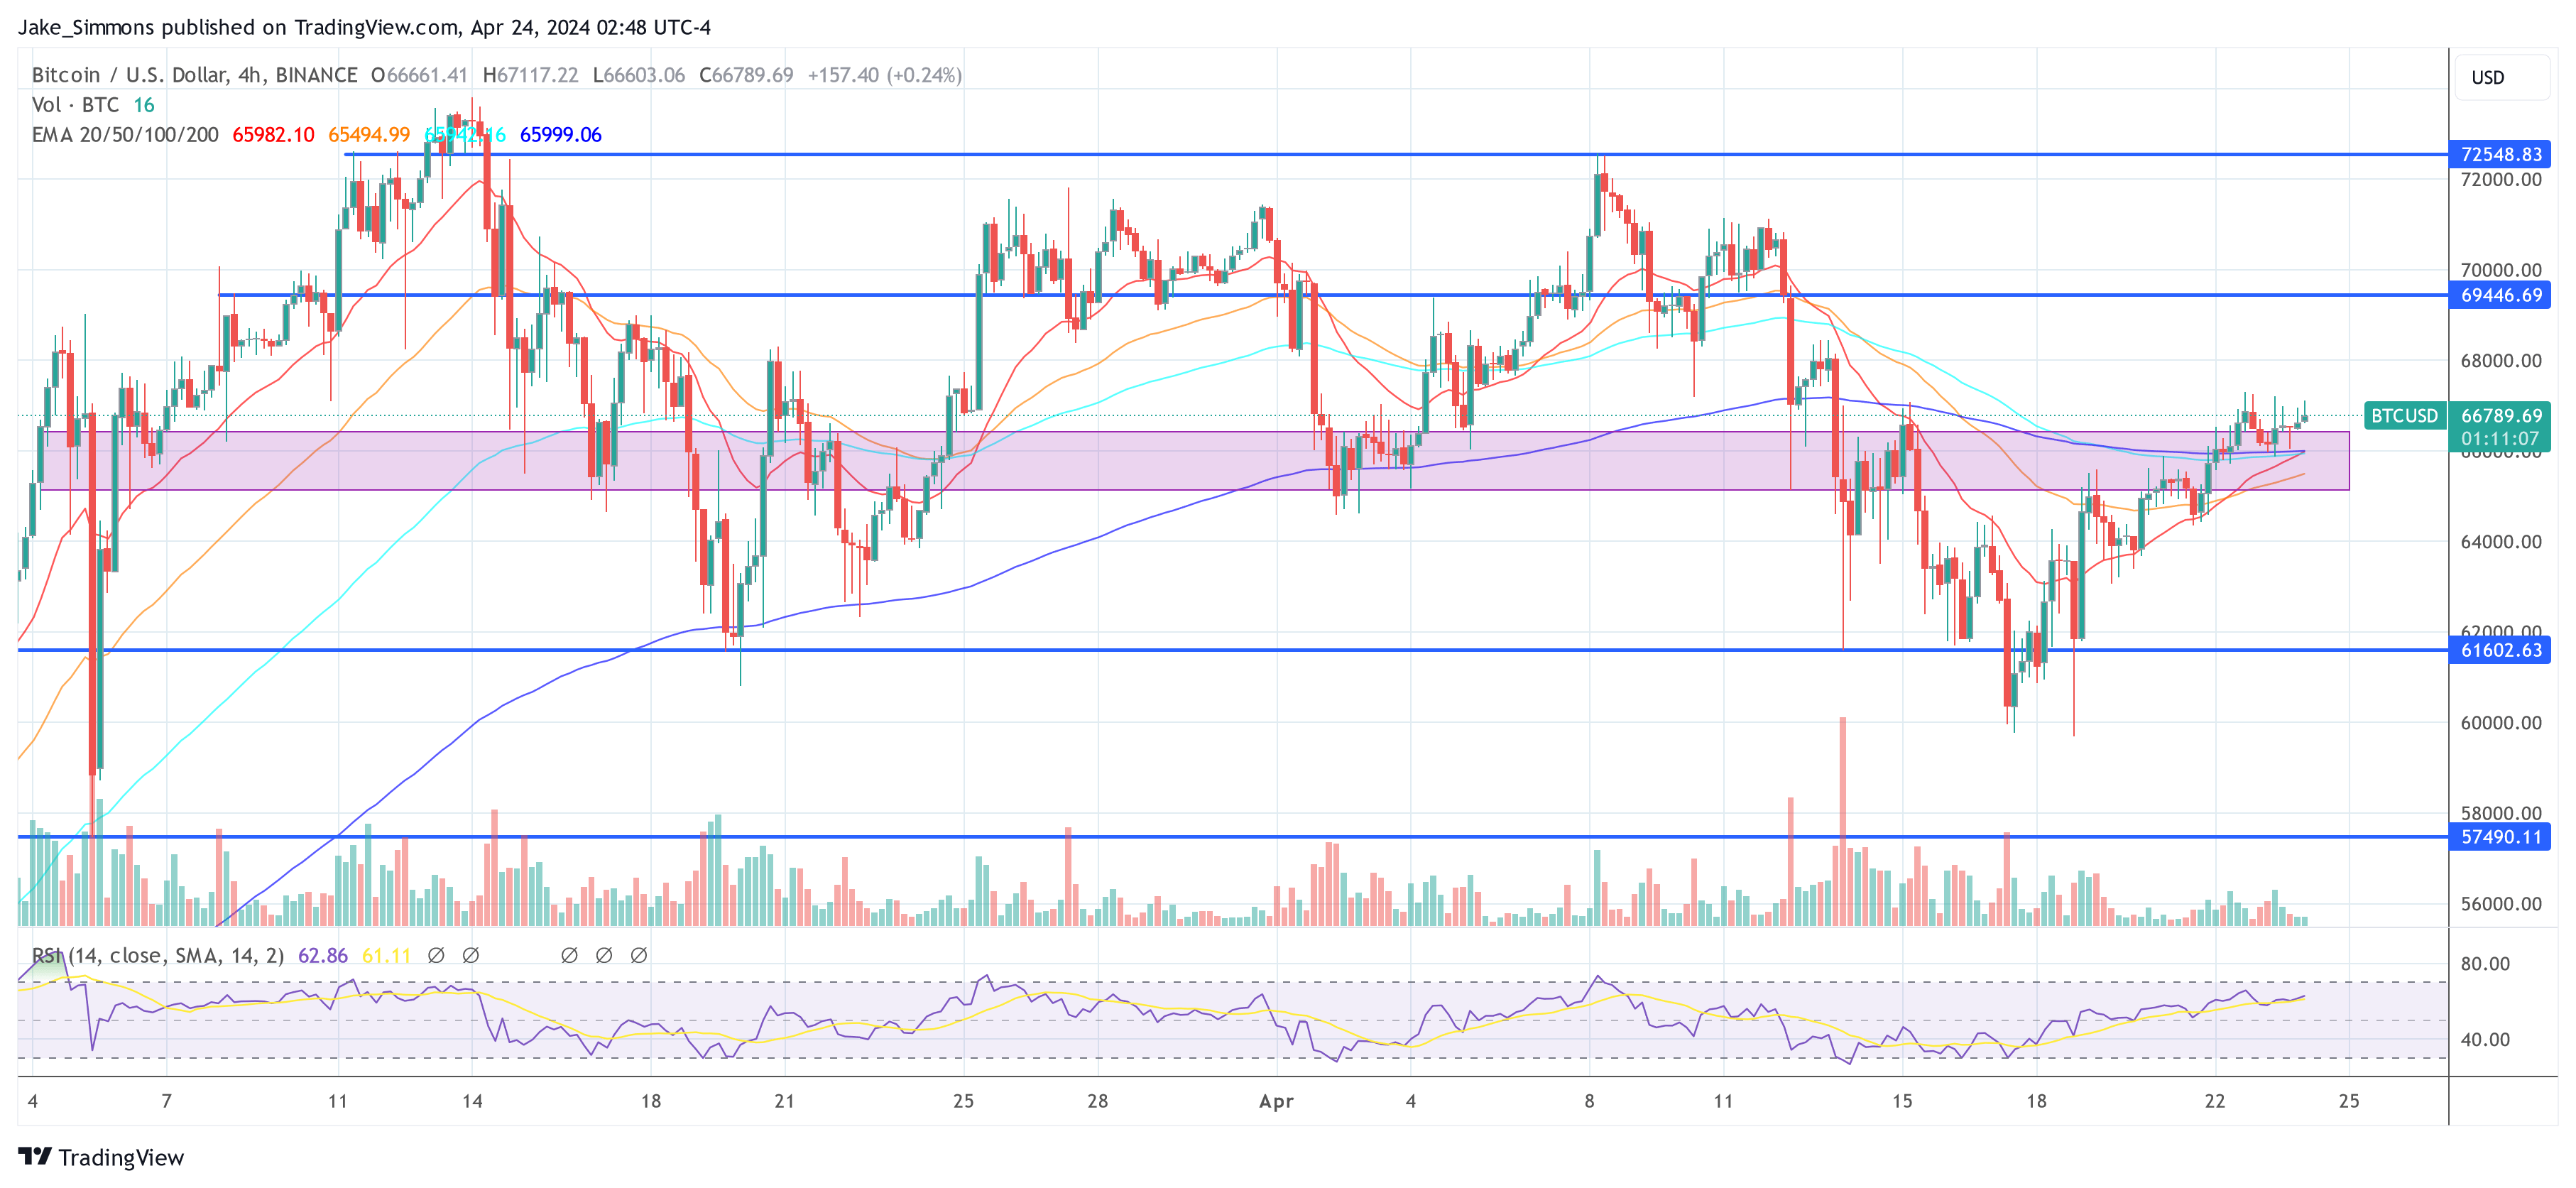
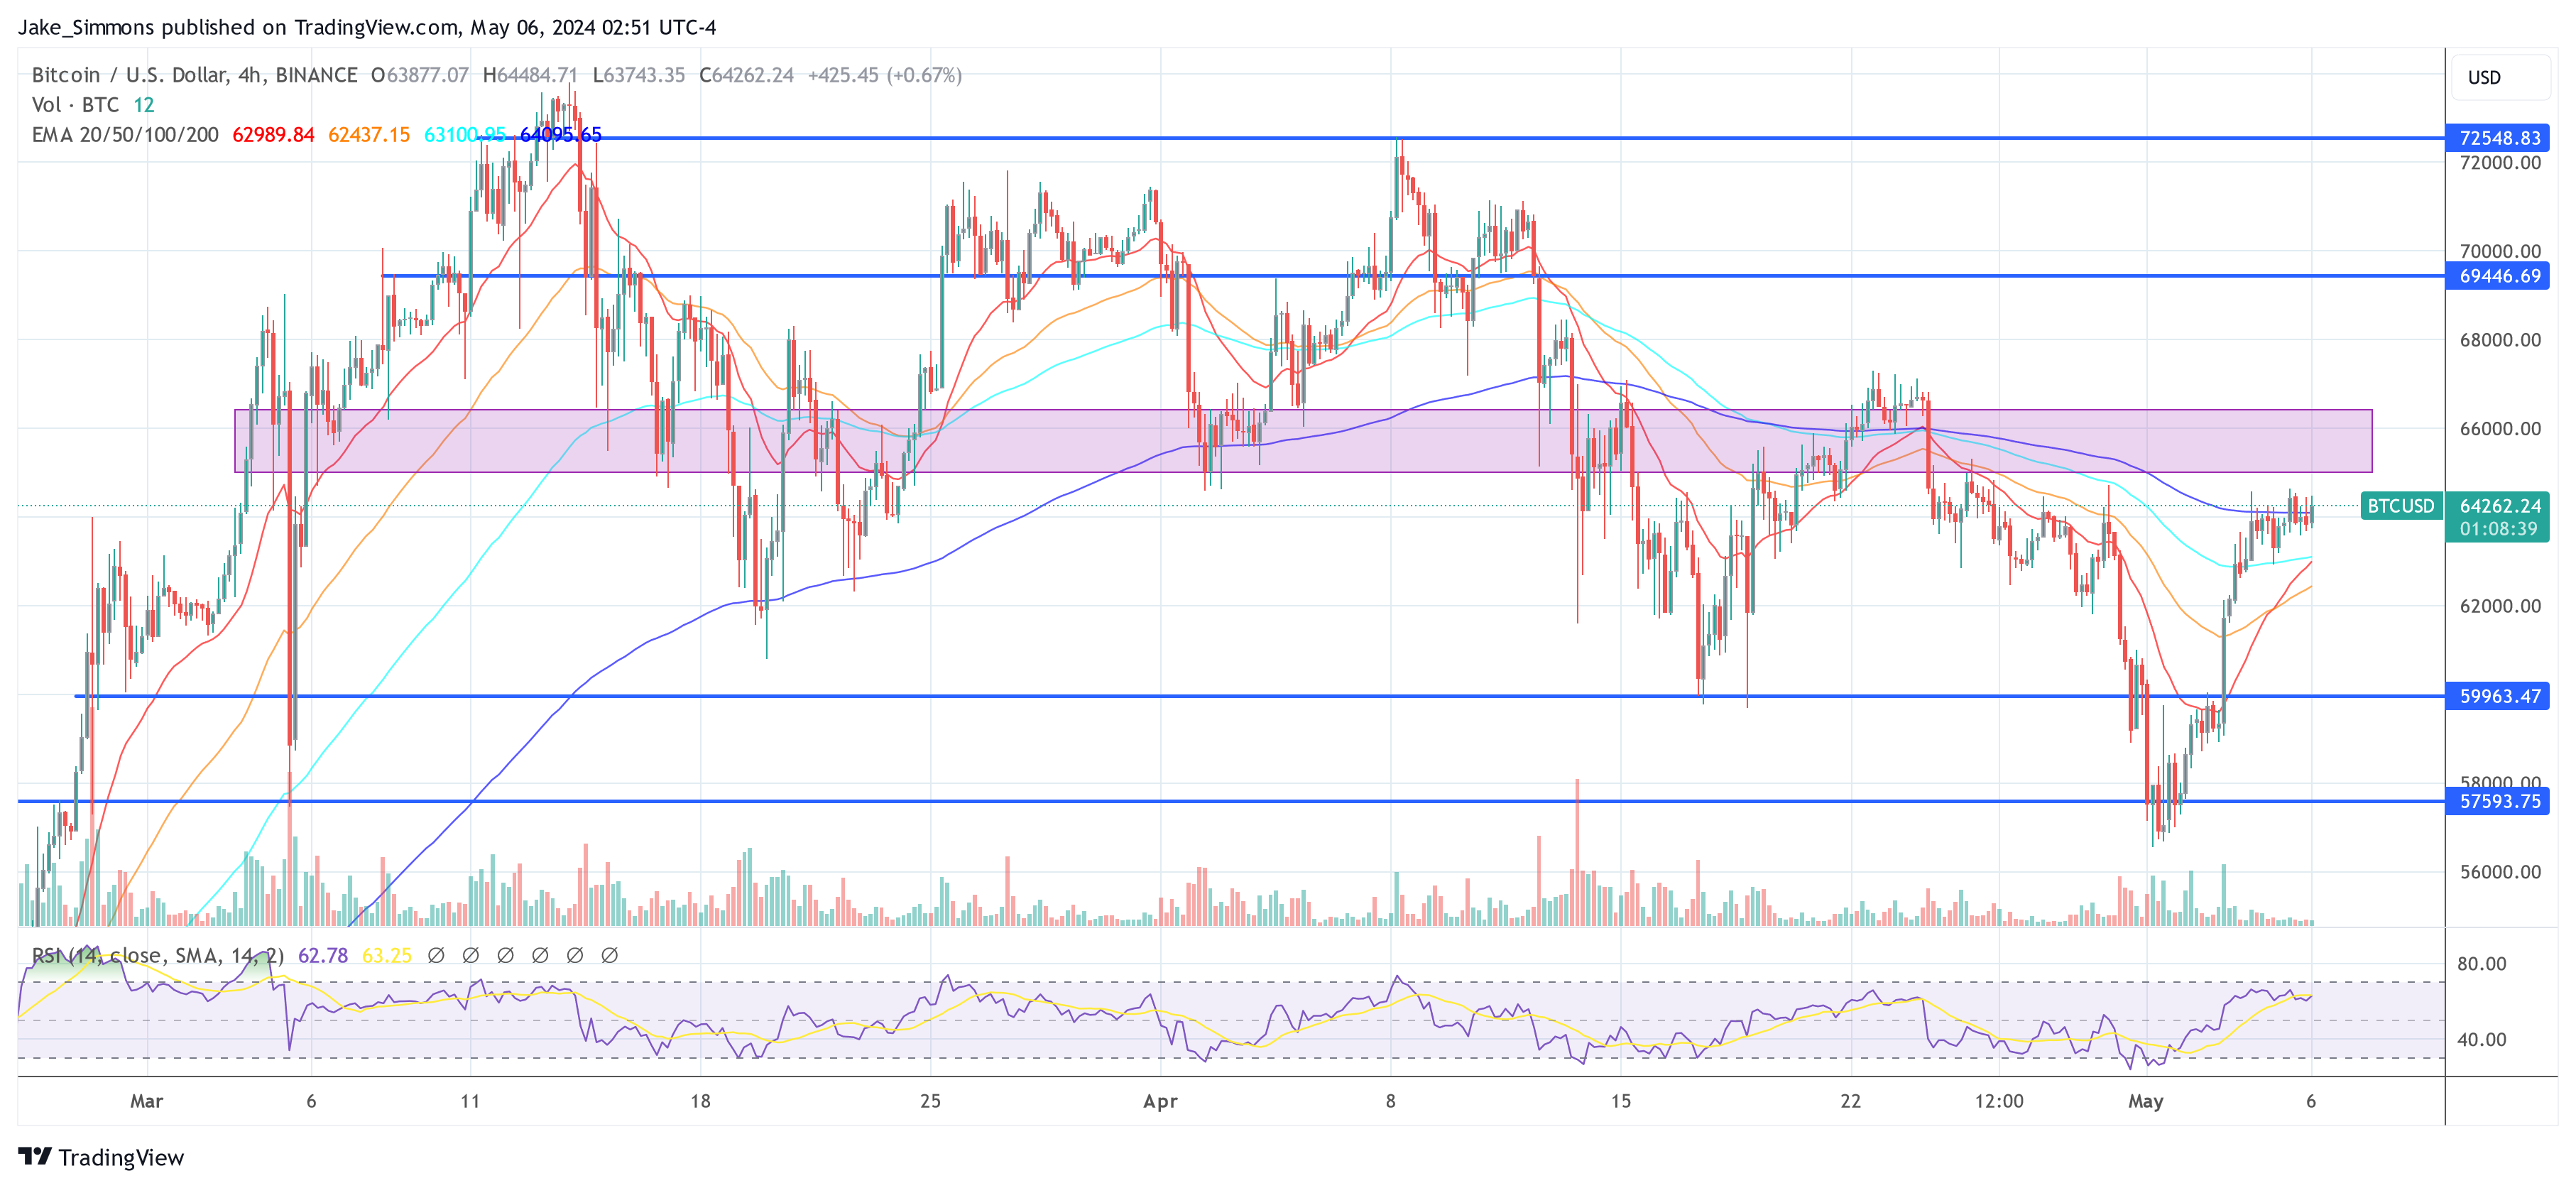
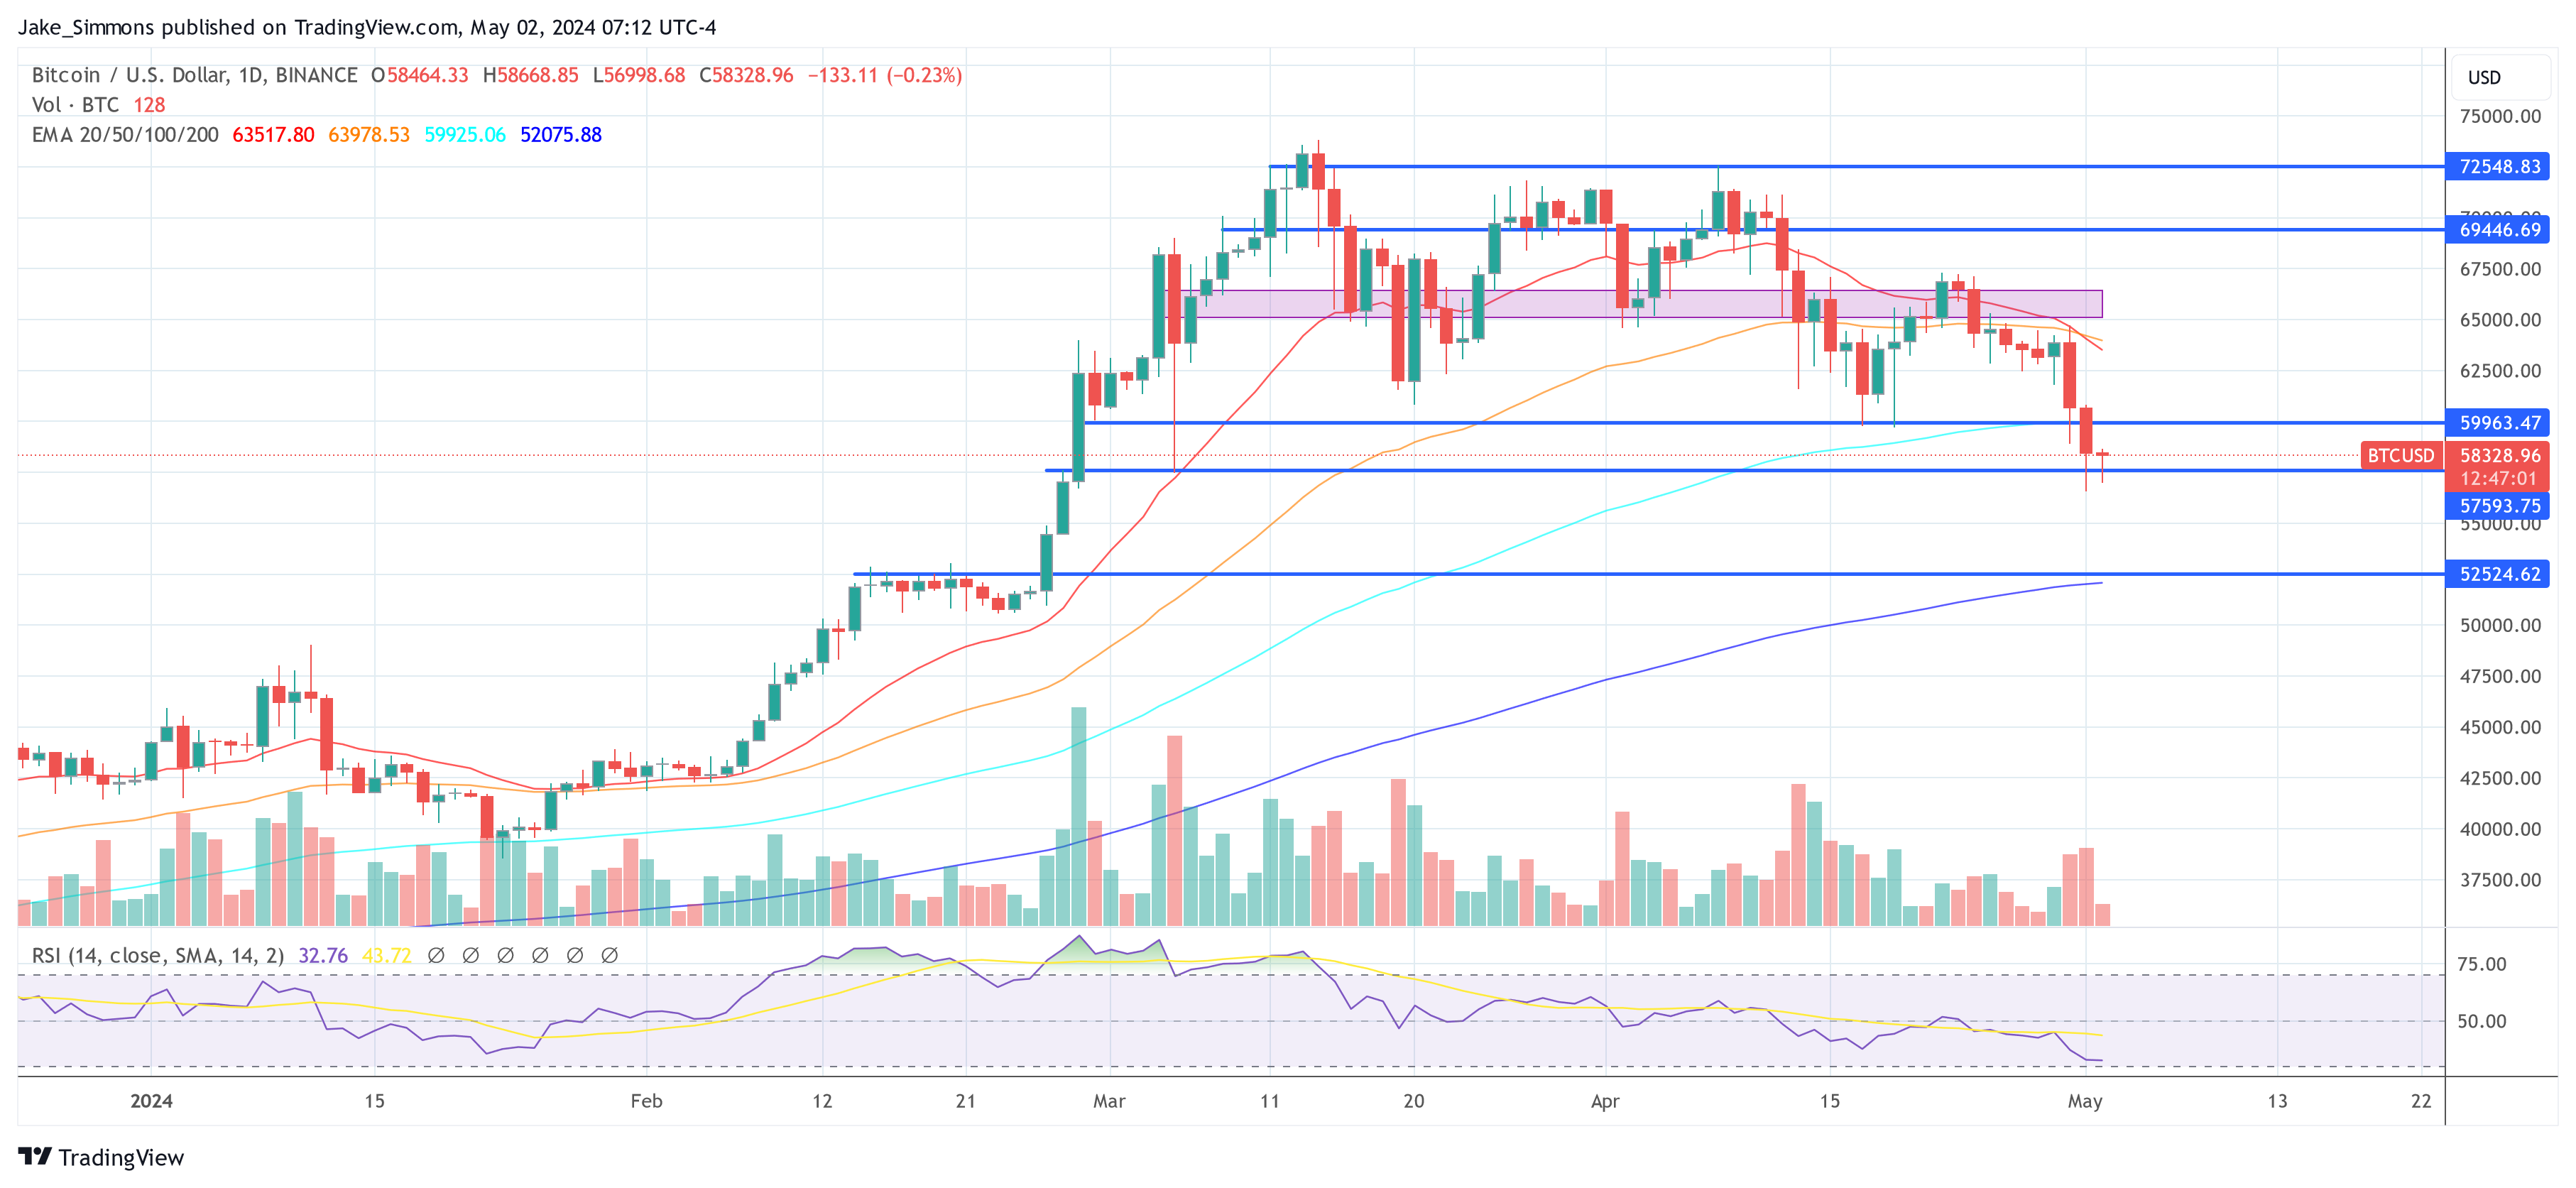
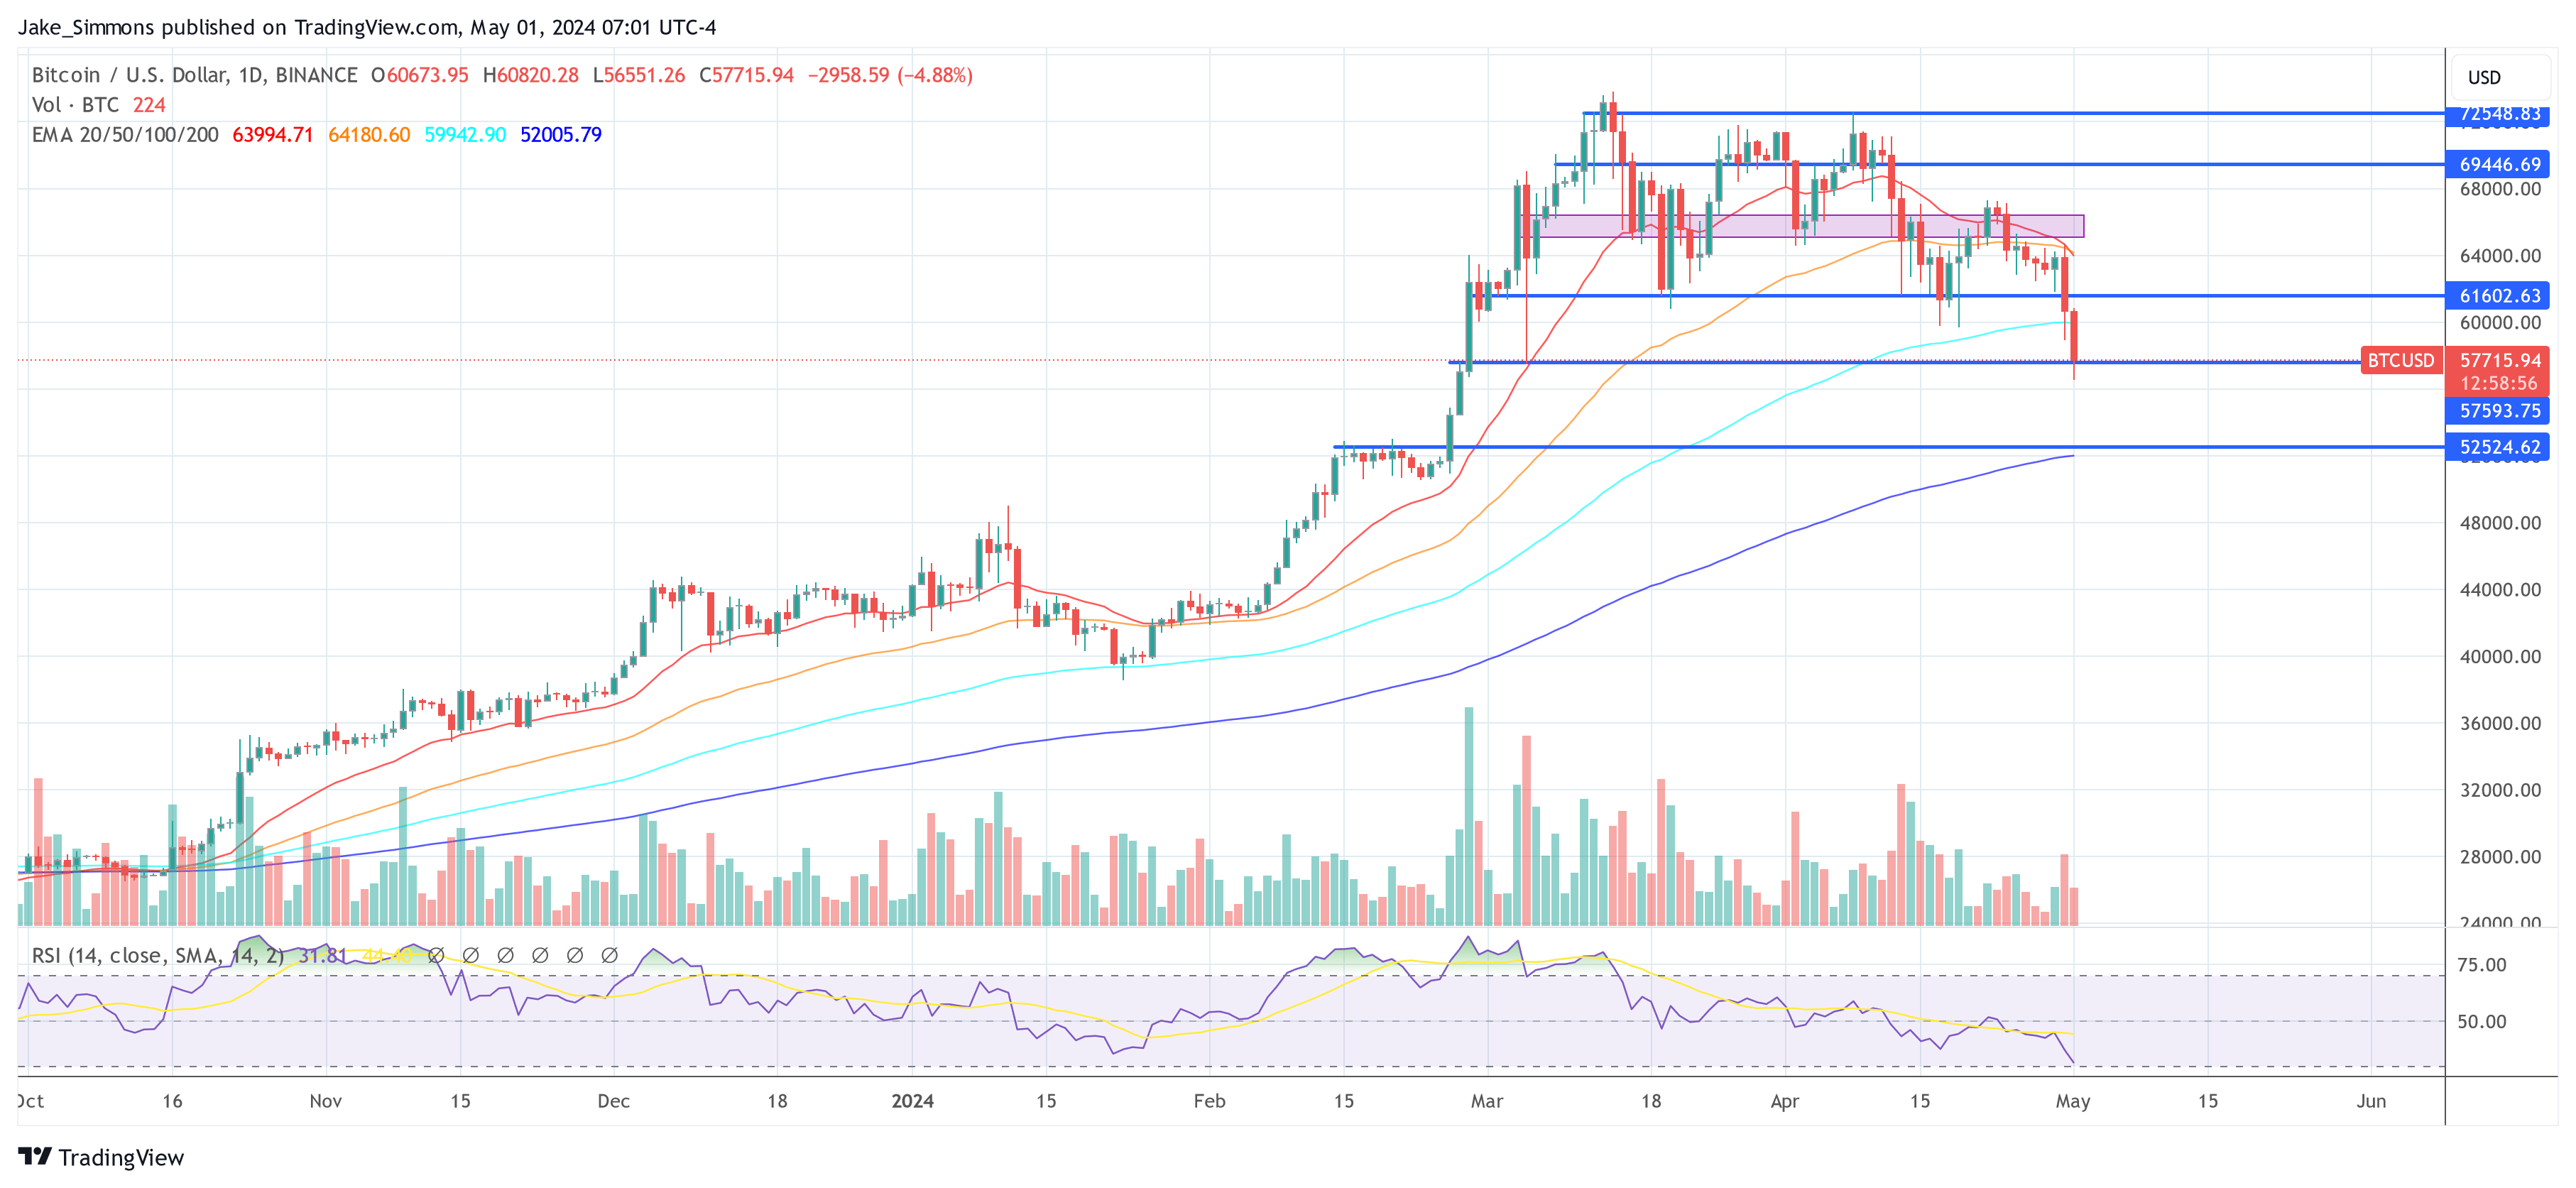
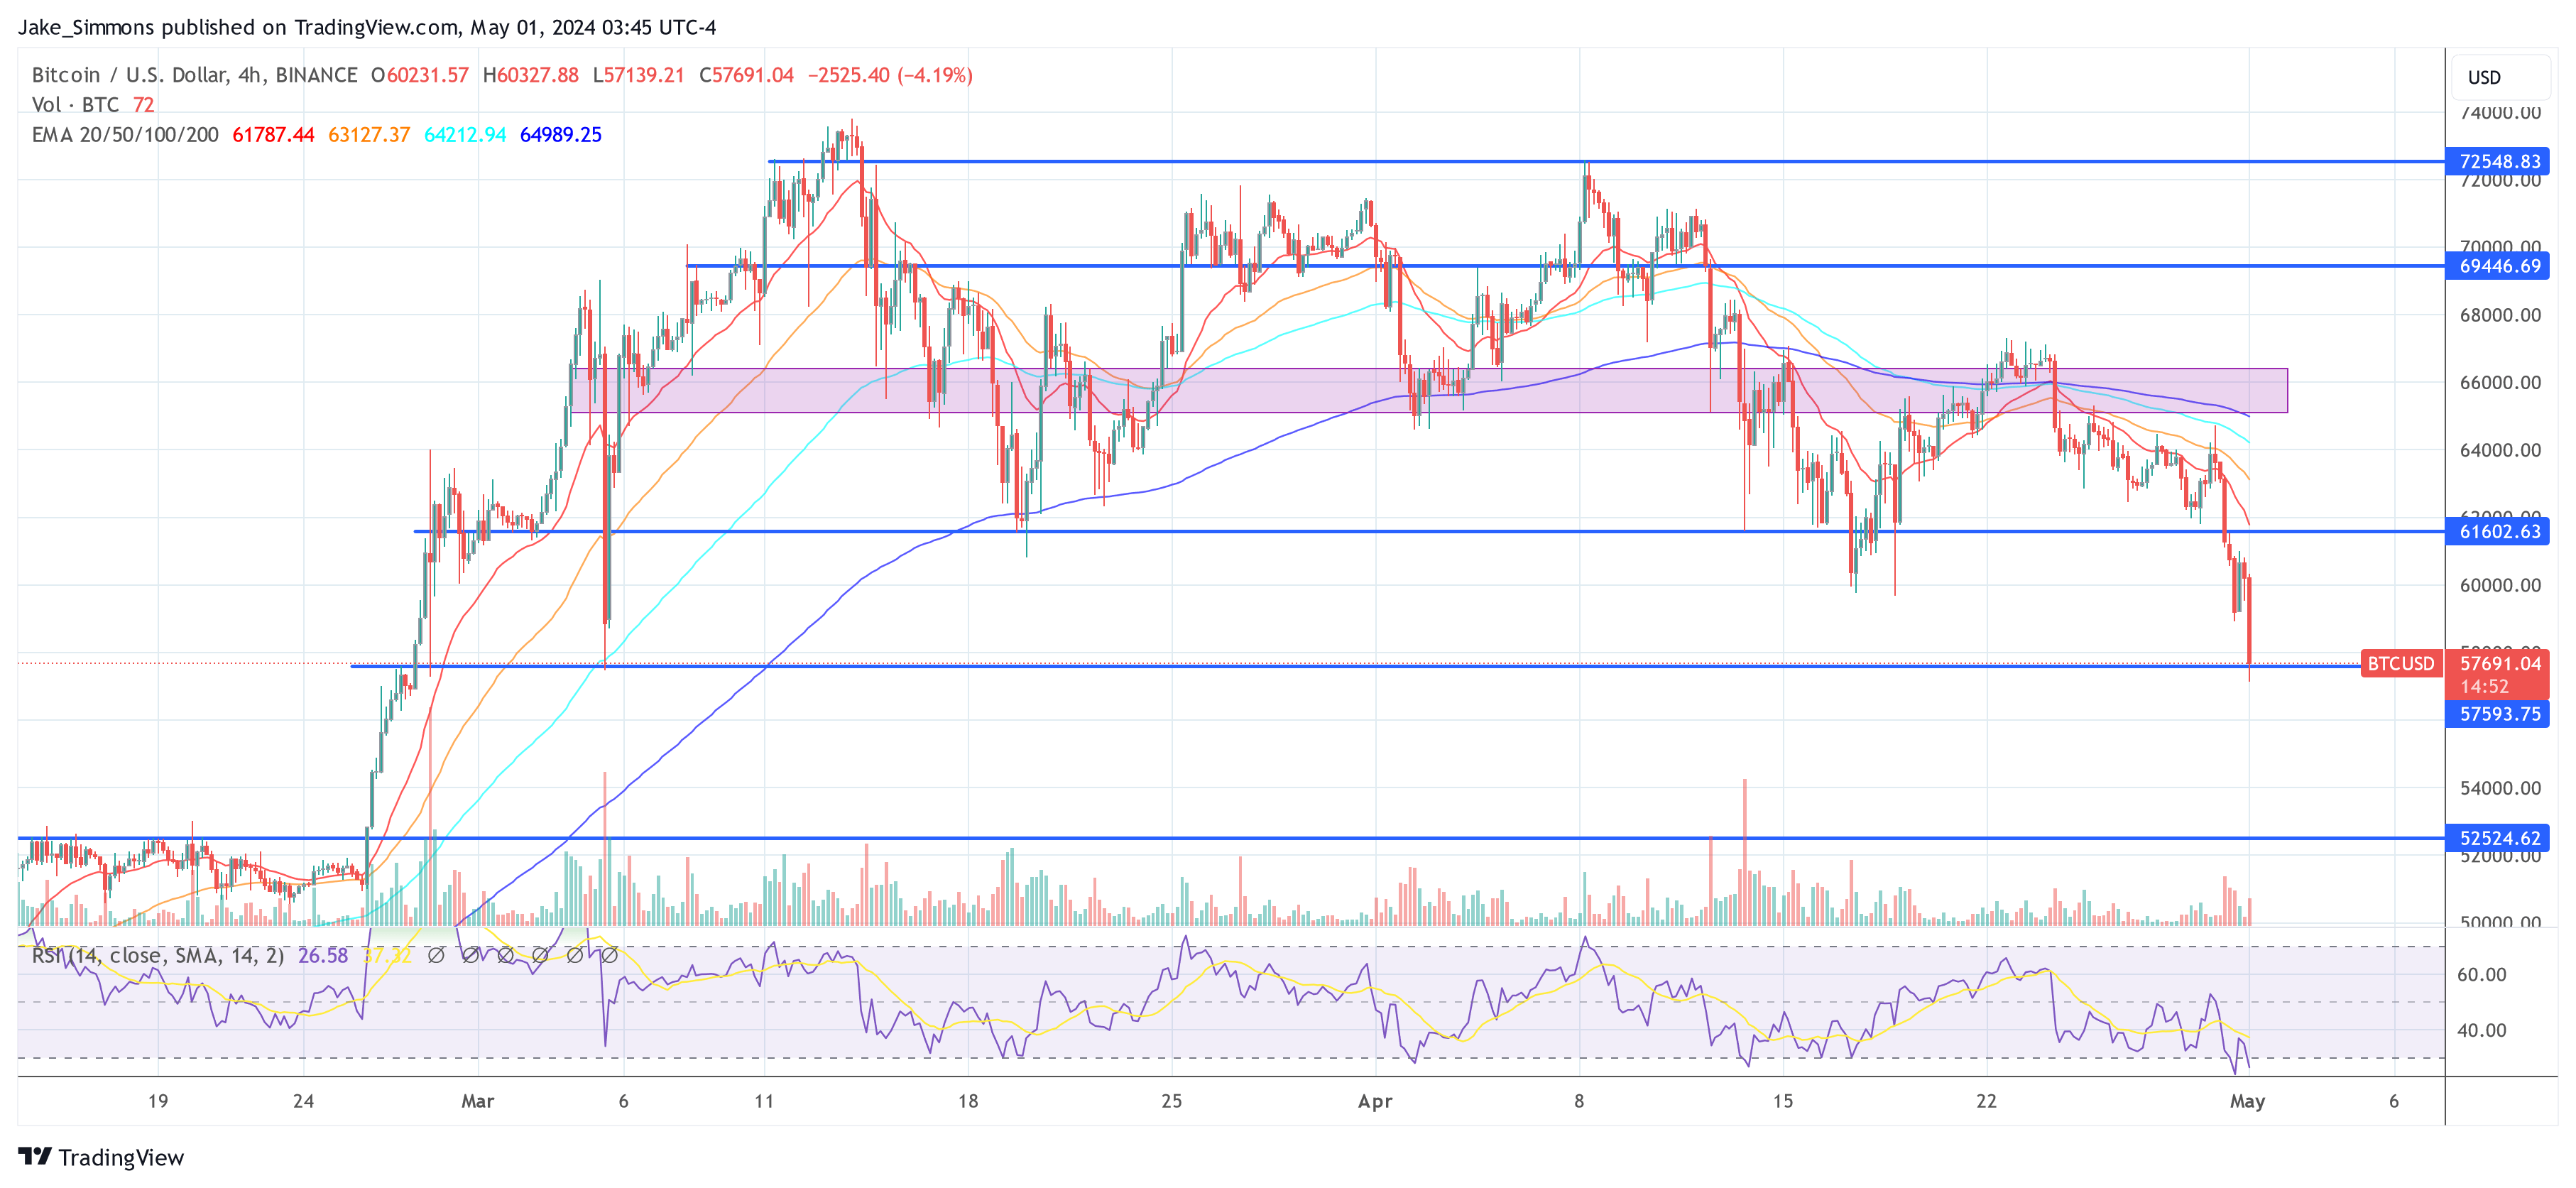
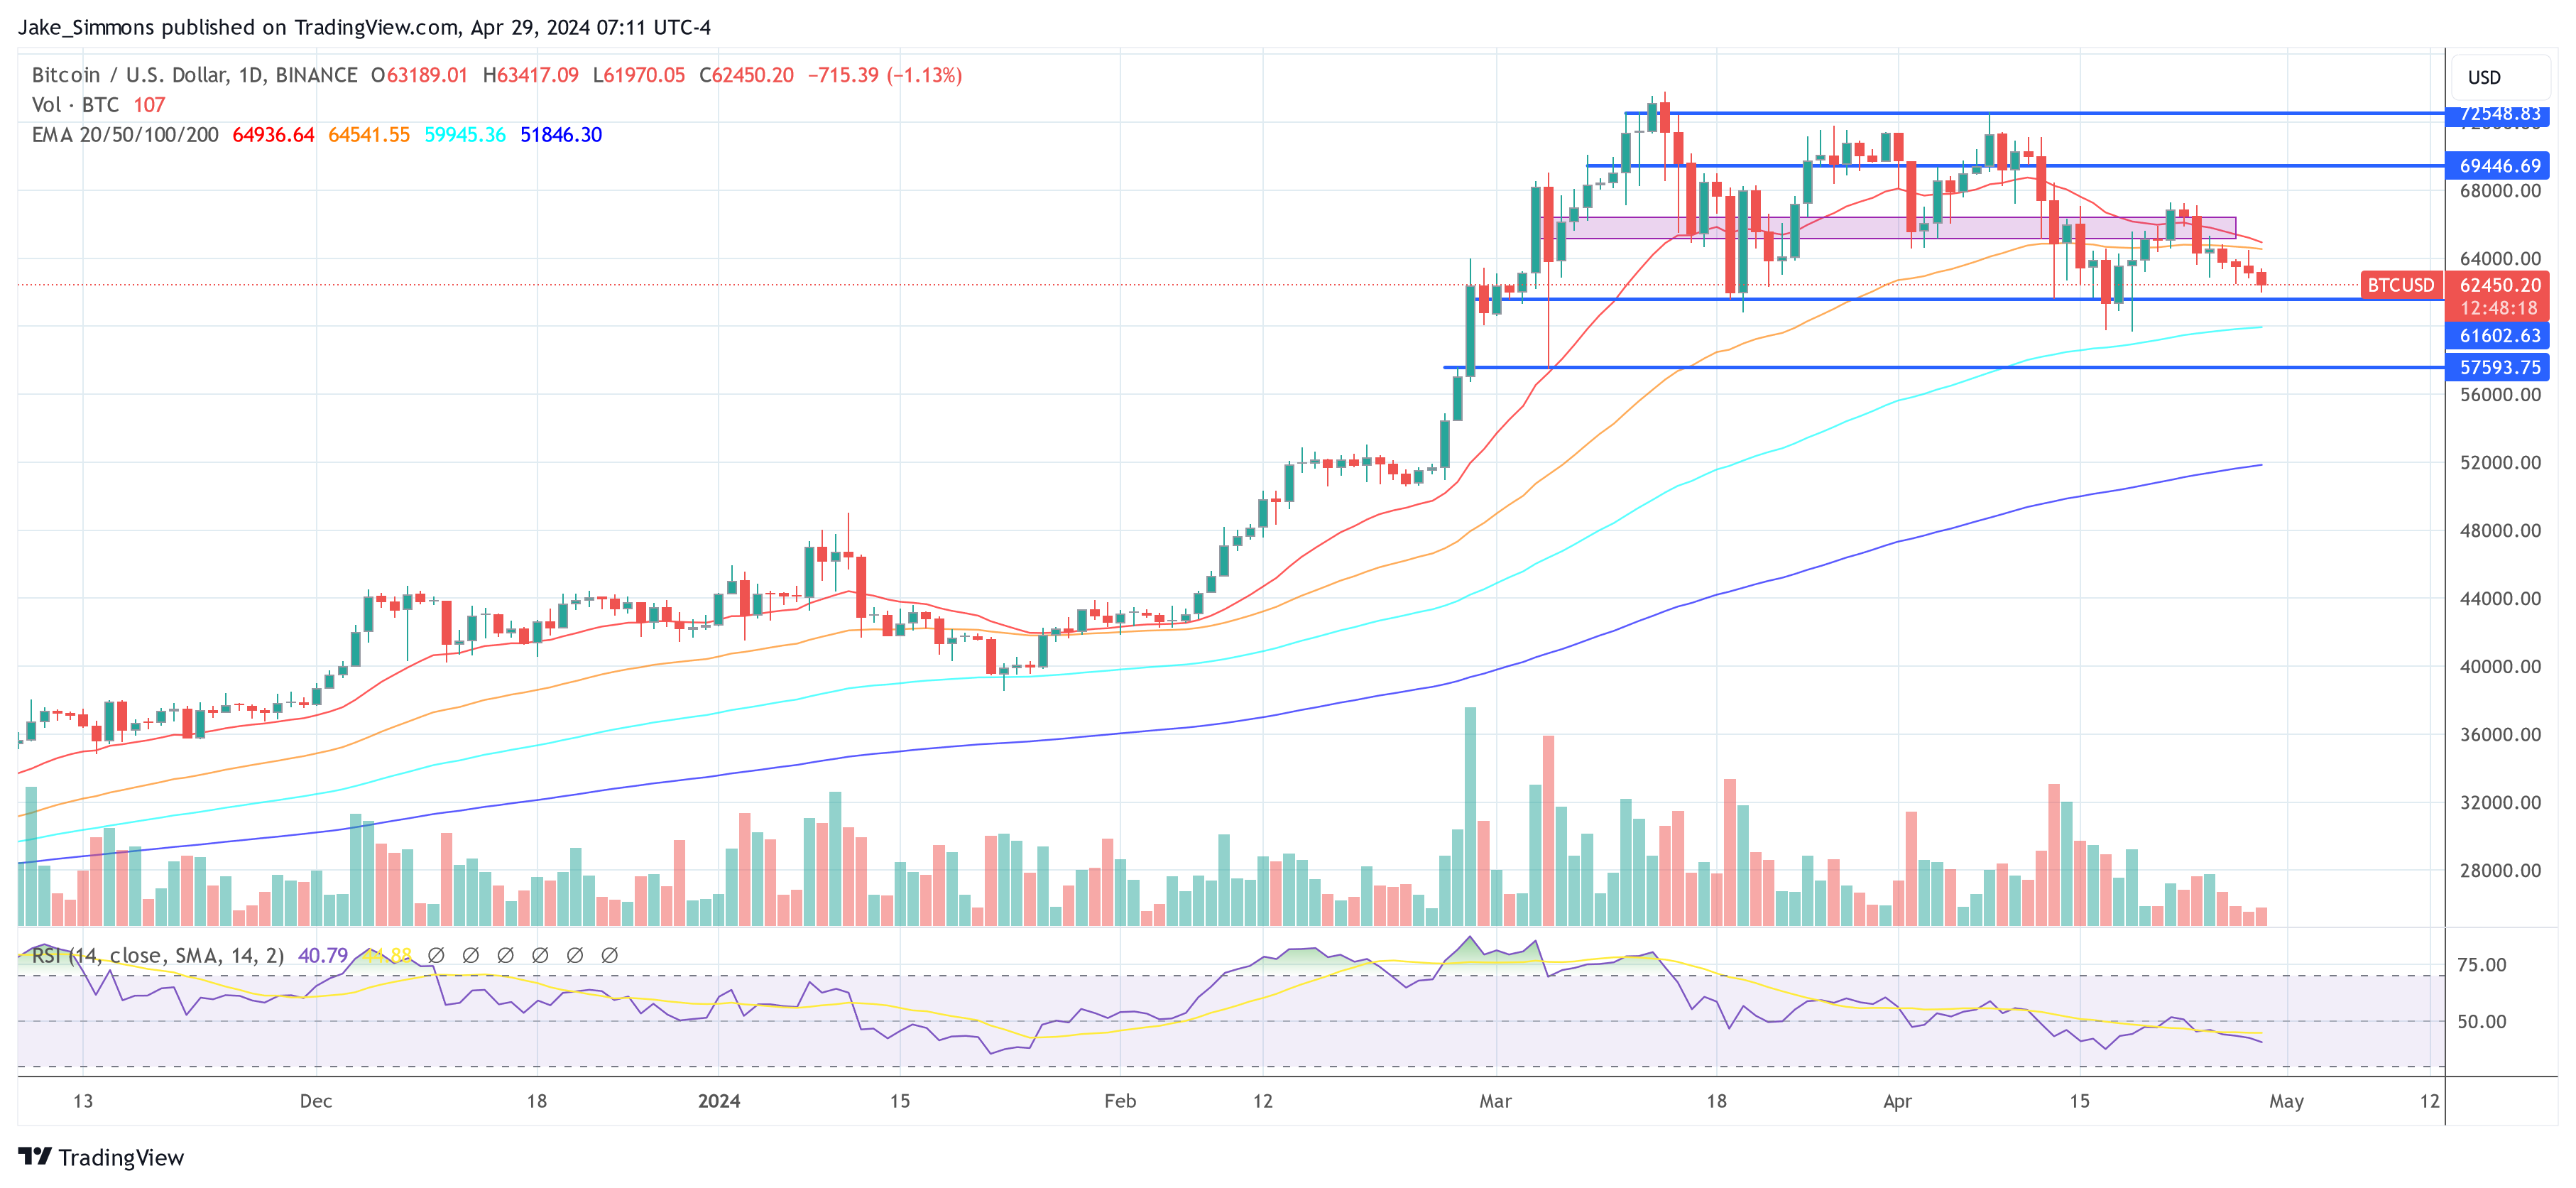
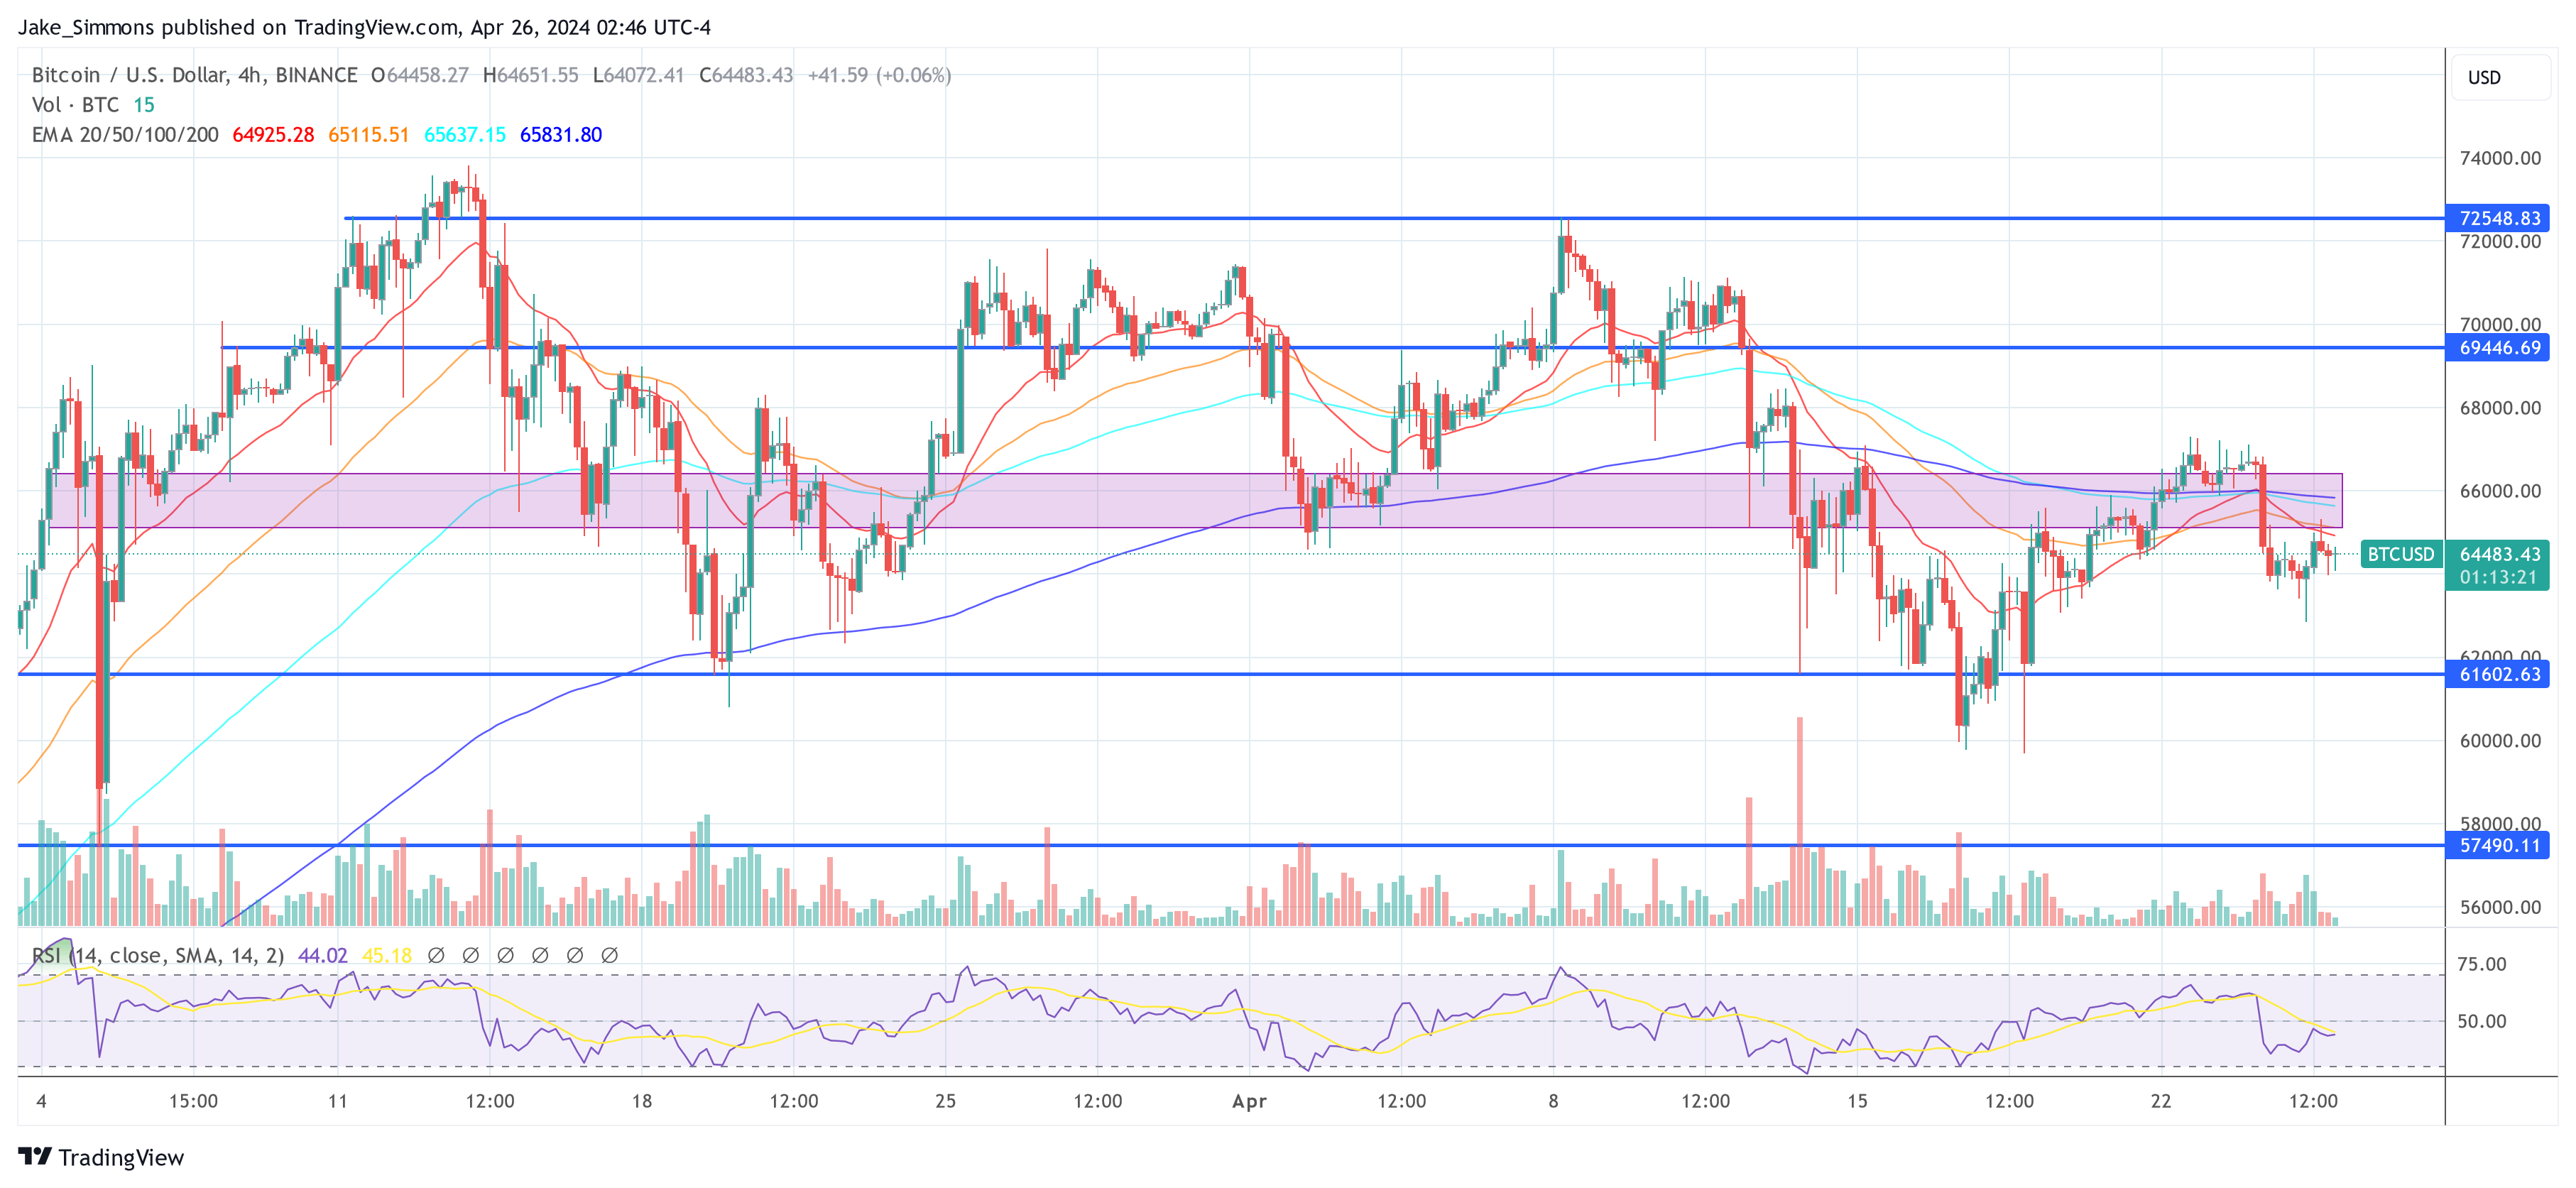
At press time, BTC traded at $64,262.

Bitcoin price

Why This Crypto Bull Run Might Not Live Up To The Past: Analyst

In a detailed analysis shared with his 788,000 followers on X (formerly Twitter), renowned analyst Pentoshi has forecasted a more restrained outlook for the current crypto bull run, suggesting that it may not mirror the explosive growth seen in previous cycles. His insights provide a deep dive into the underlying factors that could temper the market’s performance.

Why Crypto Investors Have To Expect Diminishing Returns

Pentoshi began his analysis by stating, “This cycle should have the largest diminishing returns of any cycle,” attributing this prediction to several key market conditions. Primarily, he noted that the base market capitalization for cryptocurrencies has increased significantly in each successive cycle, setting a higher starting point that makes further exponential growth increasingly challenging.

“Each cycle has set a floor about 10x the previous lows in terms of market cap,” Pentoshi explained. He provided a historical context, recounting that when he entered the crypto market in 2017, the market cap for altcoins was only around $12-15 billion, a figure that ballooned to over $1 trillion during peak periods. He argued, “That growth isn’t repeatable,” pointing out that the decentralized finance (DeFi) sector, which was then nascent, played a significant role in driving previous cycles’ exceptional returns.

Another significant factor Pentoshi highlighted is the dramatic increase in the number of altcoins and the corresponding market dilution. “Today, however, there are a lot more alts, and a lot more dilution,” he remarked, indicating that the proliferation of new tokens spreads investment thinner across the market, reducing the potential for individual tokens to achieve substantial price increases.

Pentoshi also touched upon the demographic shifts in crypto ownership. He contrasted the early days of crypto adoption, when approximately 2% of Americans were involved in the market, to the present, where over 25% of Americans have some form of crypto investment. “It just requires more capital to move the markets, and there will continue to be a lot more alts, spreading it out further,” he noted, emphasizing the logistical and financial challenges of replicating past growth rates in a much more saturated market.

An often-overlooked aspect of market dynamics, according to Pentoshi, is the role of token liquidity and its impact on price stability. He detailed that recently, tokens amounting to about $250 million were unlocked daily, though not necessarily sold. “Assuming they all got sold, that is the inflows you’d need just to keep prices stable for 24 hours,” he explained, highlighting the delicate balance required to maintain current market levels, let alone drive prices upward.

Looking forward, Pentoshi was conservative in his expectations for the Total3 index, which tracks the top 125 altcoins (excludes Bitcoin and Ethereum). He estimated, “My best guess is that this cycle we don’t see Total 3 go 2x past the 21′ cycle ATH. So 2.2T max for Total3.” This projection underscores his broader thesis that while the market continues to offer daily opportunities, the era of “easy, outsized gains” might be behind us.

Pentoshi concluded his analysis with advice for investors, suggesting a more cautious approach to market participation. “If you believe the cycle is 50% over, you should be taking out more than you are putting in and building up some cash and buying other assets with lower risk in the meantime,” he advised, stressing the importance of securing gains and diversifying holdings to mitigate risk.

Reflecting on the psychological aspects of investing, he added, “Most people never really learn. Because if you can’t control your greed, and defeat it, you are destined to give back your gains repeatedly.” His parting words were a reminder of the cyclical and often predatory nature of financial markets, urging investors to secure profits and protect themselves from foreseeable downturns.

At press time, TOTAL3 stood at $635.565 billion, which is still more than -43 % below the last cycle high.

crypto TOTAL3

Buy Crypto In May, Go Away: Arthur Hayes Shares His Top Altcoin Picks

In his most recent publication dated May 2, 2024, Arthur Hayes, the founder of exchange BitMEX, shared his insights into the crypto market’s recent tumultuous behavior and the broader macroeconomic signals shaping potential future trends. Titled “Mayday,” his essay directly addresses the crypto market, which has experienced significant volatility since mid-April.

Stealth Money Printing Is Commencing

Hayes begins by noting the observable distress in the crypto markets, which he attributes to a confluence of factors including the end of the US tax season, anticipatory fears about Federal Reserve policy decisions, the Bitcoin halving event, and stagnating growth in the assets under management (AUM) for US Bitcoin exchange-traded funds (ETFs).

He interprets these factors as a necessary purge of speculative excess, stating, “The tourists will sit out the next phase on the beach… if they can afford it. Us hard motherfuckers will hodl, and if possible, accumulate more of our favorite crypto reserve assets such as Bitcoin and Ether, and/or high-beta shitcoins like Solana, Dog Wif Hat, and dare I say Dogecoin (the OG doggie coin).”

A significant portion of Hayes’ analysis focuses on the Federal Reserve’s recent adjustment to its quantitative tightening (QT) program. Previously set at a reduction of $95 billion per month, the Fed has dialed this back to $60 billion.

Hayes interprets this as a covert form of quantitative easing, injecting an additional $35 billion per month into the dollar liquidity pool. He explains, “When you combine the Interest on Reserve Balances, RRP payments, and interest payments on US Treasury debt, the reduction in QT increases the amount of stimulus provided to the global asset markets each month.”

Hayes also scrutinizes actions by the US Treasury, particularly under Secretary Janet Yellen. He discusses the Treasury’s Quarterly Refunding Announcement (QRA), which outlines the expected borrowing and cash balances for upcoming quarters. For Q2 2024, the Treasury anticipates borrowing $243 billion, a figure Hayes points out is $41 billion higher than the previous forecast, due to lower-than-expected tax receipts.

He predicts this increased supply of Treasuries could lead to higher long-end rates, a situation Yellen may counter with yield curve control measures—a scenario that could catalyze a significant rally in Bitcoin and crypto prices.

Hayes touches on the failure of Republic First Bank, emphasizing the response by monetary authorities as a key indicator of systemic fragility. He criticizes the federal safety net that ensures all depositors are made whole, arguing that it masks deeper vulnerabilities within the US banking system and leads to a stealth form of money printing, as uninsured deposits are effectively guaranteed by the government. This, Hayes argues, is a fundamental misalignment that could lead to significant inflationary pressures.

Buy Crypto In May, Go Away

Hayes is candid about his investment strategies in the current environment. He advocates buying now. “I’m buying Solana and doggie coins for momentum trading positions. For longer-term shitcoin positions, I’m upping my allocations in Pendle and will identify other tokens that are ‘on sale.’ I will use the rest of May to increase my exposure. And then it’s time to set it, forget it, and wait for the market to appreciate the inflationary nature of the recent US monetary policy announcements.”

He concludes with a broad prediction that, despite the market’s recent volatility, the underlying liquidity conditions created by US monetary and fiscal policies will provide a floor for crypto prices, leading to a gradual upward trend. “While I don’t expect crypto to fully realize the recent US monetary announcements’ inflationary nature immediately, I expect prices to bottom, chop, and begin a slow grind higher,” he states, signaling his bullish outlook.

For Bitcoin, Hayes predicts that the premier cryptocurrency will recapture the key $60,000 level and then move in a range between $60,000 and $70,000 until August because of the annual summer lull.

At press time, BTC traded at $59,393.

Bitcoin price

Bitcoin Bull Run Over? Analyst Predicts What To Expect Now

The recent plummet in Bitcoin’s value below the $60,000 mark has sparked widespread speculation within the crypto community, raising questions among investors and market watchers about the future direction of its price. Marco Johanning, a well-known crypto analyst and founder of The Summit Club, took to X (formerly Twitter) to provide his insights on the current market conditions and what might be expected next.

According to Johanning, the recent price action does not signify a market downturn but rather a correction within an ongoing bull market. He emphasizes, “Bitcoin lost the range. What now? First and foremost, a reminder: we are in a bull market, and this is a correction. This is not a rally in a bear market. Or in other words, the high time frame trend is up no matter what.”

He supported this assertion with several indicators of a continued bullish trend. First, Bitcoin reached its bear market bottom in November 2022 and subsequently broke above the 200-day moving average, a critical indicator of long-term market trends. Following a drop below the 200-day moving average, there was a significant breakout above this level and THE major high time frame resistance in October 2023.

Moreover, Bitcoin achieved a new all-time high in March 2024. Over the last 18 months, Bitcoin has consistently recorded higher highs and higher lows, which are typical characteristics of a bullish market.

“This can’t be a bear market,” Johanning explained. “These elements underscore a fundamental bias crucial for assuming that the current drop is part of a broader bull market trend. Therefore, Bitcoin will eventually find a local bottom and ascend higher.”

Bitcoin Price Analysis: What To Expect Next?

Johanning provided a detailed breakdown of possible future scenarios based on technical analysis. His first scenario is based on the monthly chart where the most crucial level is at $48,000-$49,000. This level is key because it was a major hurdle overcome in February 2024. Now, it might serve as the perfect point for a bullish retest.

Furthermore, there’s a significant market imbalance down to the $48,000-$49,000 range, coinciding with the 0.5 Fibonacci retracement level from the last monthly swing low. This setup suggests a strong potential for price stabilization and reversal at this level, according to Johanning.

Bitcoin price analysis

The second scenario grounds on the weekly chart where the important level is at $52,000. This level acts as a major high time frame support/resistance, marked by a weekly imbalance that extends up to $52,000, and it matches the 0.382 Fibonacci retracement from the bottom to the top of the last major rally, and the 0.618 level from the last swing low to the top.

Bitcoin price analysis

The third scenario is based on the lower timeframes. Here, the most significant level is at $57,000. This mark is critical as it represents the 0.5 Fibonacci level from the last swing low and was a key area during the February climb. This level might serve as the stage for a potential deviation or price trap.

Bitcoin price analysis

“The recent bearish engulfing pattern breaking the monthly levels, followed by a bearish retest, signals significant market shifts,” noted Johanning. “If Bitcoin swiftly reclaims these key levels, particularly the $57,000 mark, we could see a deviation scenario unfold. Otherwise, the $52,000 or $48,000-$49,000 levels will likely be tested, each representing a higher low in the ongoing uptrend.”

Impact on Altcoins And Market Strategy

Altcoins have displayed remarkable resilience in the face of Bitcoin’s volatility, which Johanning finds particularly promising. “Usually, a significant drop in Bitcoin accompanied by a loss of a higher time frame range would lead to severe declines in altcoins. However, their strength yesterday is a good indicator that the worst may be over for altcoins,” he commented.

Johanning concluded his analysis with an optimistic outlook for both Bitcoin and altcoins, expressing confidence in the continuation of the bull market. He is actively accumulating more at current prices, anticipating substantial returns: “No matter which scenario plays out, I am committed to this trend until proven otherwise. I’m investing heavily, and if we truly remain in a bull market, the potential for profit is tremendous.”

At press time, BTC traded at $58,328.

Bitcoin price

Buy Dogecoin Now? Analyst Believes DOGE Is Primed For A Surge

In an analysis shared via X, crypto analyst Ali Martinez elaborated on the ongoing price correction of Dogecoin (DOGE), positing that it is a consistent precursor to major bull runs, drawing on historical patterns to forecast future price movements.

Martinez’s commentary centers on the chart pattern known as the “descending triangle.” This is a bearish formation that occurs when the price follows a downward trendline intersecting a flat support line. Typically, this pattern indicates a continuation of a downward trend, but in the context of Dogecoin, Martinez suggests it precedes significant bullish breakouts.

“The ongoing Dogecoin price correction is part of its usual behavior before massive bull runs! Let’s dive in,” Martinez shared. He explained the historical significance of this pattern in Dogecoin’s trading history: “In 2017, DOGE broke out of a descending triangle. Then, DOGE retraced by 40% before entering a 982% bull run!”

Martinez further analyzed more recent cycles to reinforce his observations, “In 2021, DOGE broke out of a descending triangle again. Then, DOGE retraced by 56% before skyrocketing by 12,197%!” According to Martinez, these retracements are not random but are characteristic of how Dogecoin has behaved in previous cycles, setting the stage for explosive gains.

The analyst drew parallels to the current market conditions: “Now, in 2024, DOGE has yet again broken out of a descending triangle! It is currently undergoing a 47% price correction, very similar to previous cycles, which could ignite the next DOGE bull run!” This assertion suggests that the current market downturn might be an opportune buying moment ahead of potential gains.

DOGE price analysis

Martinez’s analysis underscores the cyclical nature of Dogecoin’s price movements, suggesting a pattern of sharp declines followed by dramatic recoveries. “Over the years, Dogecoin appears to mirror its previous bull cycles! All you need is a little bit of patience,” he concluded.

Short-Term Dogecoin Price Analysis

Amidst this optimistic prediction, the Dogecoin price is in a precarious scenario in the short-term. Since mid-April, DOGE has experienced significant technical resistance. Particularly, the DOGE price was consistently rejected at the 50-day EMA over multiple instances, indicating strong selling pressure at higher price levels.

Amid a broader market downturn, the trajectory was accentuated when Dogecoin’s price broke below the crucial 100-day EMA. This level, often watched by traders for signs of medium-term market direction, had previously offered support. The breach underscores a weakening market sentiment and could signal extended losses.

Dogecoin price

As of press time, Dogecoin’s price hovered near $0.1259 after narrowly holding above the 200-day EMA yesterday, a key psychological and technical barrier. This moving average is now a pivotal point for Dogecoin; its sustained breach on the daily chart could significantly alter the market structure, potentially triggering a slide towards the $0.1005 support level.

The Relative Strength Index (RSI) is at 31.63, edging close to the oversold territory but not conclusively signaling an imminent reversal. This indicates that while the market is nearing oversold conditions, the selling pressure has not fully abated. One last leg down might be necessary to get DOGE into “oversold” territory in order to mark a local bottom.

Bitcoin Price Dips Below $57,000: 4 Key Reasons

Bitcoin (BTC) has witnessed a significant drop, falling to $56,556 during Wednesday morning in Europe, marking the lowest point since late February. This downturn represents the sharpest monthly decline since November 2022, with BTC tumbling approximately 7.5% within the last 24 hours and breaching the previously stable $60,000 support late Tuesday.

#1 Derisking Before Today’s FOMC Meeting

Anticipation and anxiety are high in financial circles as the Federal Open Market Committee (FOMC) is set to announce its interest rate decision later today. This event is crucial as the crypto market, notably Bitcoin, has grown increasingly reactive to macroeconomic signals.

Recent data, reflecting a slowdown in GDP growth coupled with persistent inflation, has significantly reduced expectations of interest rate cuts by the Federal Reserve. “Bitcoin and other risk assets are currently feeling the pressure from a stagflationary environment, geopolitical tensions, and seasonal liquidity variations,” remarked Ted from TalkingMacro.

Initially, up to seven rate cuts were anticipated by the end of 2024, a sentiment that has shifted dramatically with the market now pricing in only one potential cut by December 2024. This shift comes amidst an environment where inflation data is trending upwards, challenging the Federal Reserve’s position and potentially leading to a more cautious approach from Jerome Powell, the Fed Chairman.

“For the first time in recent memory, the market is calling the Fed’s bluff, quickly front-running the idea that the Fed may not cut at all in 2024,” noted Ted.

#2 Cyclical Bitcoin Correction Phase

Following an exceptional rally since the year’s start, the market is undergoing a natural correction phase. Prior to the price crash, Charles Edwards, founder of Capriole Investments, noted: “We are a day short of breaking the record set in 2011 for days without a meaningful dip [-25%],” emphasizing the extraordinary nature of Bitcoin’s recent performance.

Scott Melker, known as “The Wolf Of All Streets,” highlighted technical indicators that suggested an impending correction. “Broke and retested range lows as resistance. […] My biggest concern I have been discussing for months [was] that RSI never made the trip to oversold. Almost there now, all lower time frames oversold. This is still ONLY A 23% correction, very shallow for a bull market and consistent with other corrections on this run. We are yet to see a 30-40% pull back during this bull market, like those of the past.”

#3 Profit-Taking

Traditional finance markets and seasoned investors are seizing the opportunity to take profits following substantial gains. “TradFi/Boomers are taking profits: CME Open Interest is decreasing rapidly, April 29th 135,6k coins, April 30th 123,9k coins, topped around 170.4k coins (March 20th),” explained crypto analyst RunnerXBT.

This trend confirms a broader profit-taking strategy post significant events like the ETF approval and the anticipation around the Bitcoin halving. “That […] confirms my thesis that a lot of these guys longed in October 2023 because of ETF approval and BTC halving, trade played out and now they are taking profits (yes they are still up a lot), because they longed BTC not dead altcoins.”

#4 US ETF Flows And Hong Kong Disappointment

The dynamics surrounding spot Bitcoin ETFs have shown significant strains, evidenced by recent activities in both US and Hong Kong markets. In the United States, Bitcoin exchange-traded funds (ETFs) faced substantial outflows, indicating a cooling investor sentiment.

According to recent data, the total outflows from US spot Bitcoin ETFs amounted to $161.6 million. Notably, the Grayscale Bitcoin Trust (GBTC) experienced outflows of $93.2 million, while Fidelity and Bitwise registered outflows of $35.3 million and $34.3 million, respectively. BlackRock had zero net flows once again. These numbers suggest a retreat in institutional interest, which has traditionally been a bulwark against price volatility.

Parallel to the US, the debut of Bitcoin ETFs in Hong Kong also faltered significantly below expectations. Six newly launched ETFs, intended to capture both Bitcoin and Ethereum markets, collectively reached just $11 million in trading volume, starkly underperforming against the anticipated $100 million. The spot Bitcoin ETFs accounted for $8.5 million in trading volume. This was markedly lower than the launch day volumes of US-based spot Bitcoin ETFs, which had reached $655 million on their first day.

#5 Long Liquidations

The market has also been impacted by substantial long liquidations, with a total of $451.28 million liquidated in the last 24 hours alone. The largest single liquidation was an ETH-USDT-SWAP on OKX valued at $6.07 million, but Bitcoin-specific liquidations were significant as well, totaling $143.04 million, according to data from CoinGlass. These liquidations have amplified the selling pressure on Bitcoin.

At press time, BTC traded at $57,715.

Bitcoin price

If History Repeats, This Is How Bitcoin Price Will Perform In The Next 6 Months

In a recent thread on X (formerly Twitter), renowned on-chain analyst Checkmate provided an analysis regarding the future trajectory of Bitcoin. Currently, the premier cryptocurrency hovers around the $60,000 mark, a pivotal moment that echoes historical patterns within the Bitcoin market cycle.

What Will The Next 6 Months Bring For Bitcoin?

Checkmate argues that Bitcoin is positioned in a “chopsolidation” phase—a term coined to describe a stagnant yet volatile period. He suggests that this could last approximately six months, based on previous cycles, and potentially usher in a period of parabolic growth that could last between six to twelve months. “Bitcoin history tends to rhyme, and thus far, this cycle is no different,” Checkmate noted. “The song sung during the last two cycles paints around 6-months of chopsolidation ahead of us, followed by 6-12 months of parabolic advance.”

Bitcoin Index Performance Since Cycle Low

Supporting his analysis, Checkmate refers to April 2021 as a significant high point for Bitcoin for “many good reasons,” noting that despite a considerable monthly drop of over $8,250 in April, such movements are typical and often signify healthy market corrections. “It’s an -11.2% monthly pullback, and is extremely common during uptrends, and corrections are healthy and necessary,” he stated, reinforcing his confidence in Bitcoin’s resilience and potential for recovery.

Bitcoin Monthly Price Performance

Further statistical backing comes from historical data focused exclusively on Bitcoin halving years (2012, 2016, 2020, and 2024), which Checkmate used to illustrate that such month-over-month corrections are not outliers but rather common occurrences within the digital asset’s cyclical trends. The end of each year post-halving has historically shown strong performance, supporting the notion that the current price point could be a precursor to significant gains.

Bitcoin Index Performance Since Cycle ATH
Sell In May And Go Away?

Checkmate also retweeted a post from Charles Edwards. The founder of Capriole Investments commented on the market’s unprecedented bullishness, implying that a deeper correction is to be expected.

“This is starting to get ridiculous. Bitcoin has not had a run like this since inception. We are now 1 day short of the record set in 2011 for days without a meaningful dip [more than 25%]. If you are not prepared to accept some downside in this asset class, you shouldn’t be here. Especially now,” said Edwards. His remark highlights the unusual lack of severe downturns in the market, suggesting that investors should be prepared for potential volatility.

In another post on X, Edwards added a cautious note to the otherwise optimistic outlook. He advised, “Sell in May and go away. This looks like distribution to me. As long as we trade below $61.5K, scenario (1) is technically more likely. A strong reclaim of $61.5K would give some hopes to the bulls for scenario (2). A flush would also be good for the sustaining continuation of the bull market, the sooner we get one, the better the long opportunities are.”

Bitcoin price analysis

This perspective suggests a strategic withdrawal may be wise in the short term, implying that current market conditions might be more bearish than they appear and that a significant correction could potentially strengthen the market’s long-term prospects.

At press time, the BTC plunged to $57,691.

Bitcoin price

PEPE Chart Heats Up: Crypto Analyst Calls It One Of The Most Attractive

Cold Blooded Shiller (@ColdBloodShill), a well-known figure in the crypto analysis community, recently shared a technical analysis of the PEPE/USDT pair on Binance, marking it as one of the most promising charts in the current market landscape. With his analysis, posted to his 272,000 followers on X, he describes the potential movements of PEPE, both bullish and bearish, as it approaches a critical juncture on its trading chart.

Why PEPE Is One Of The Most Attractive Crypto’s Right Now

The chart, set on a four-hour time frame, details PEPE’s price action and its interaction with significant technical levels. A key focal point of Shiller’s analysis is the resistance-turned-support zone between approximately $0.0000063 and $0.0000062. This level, highlighted in green, previously acted as a strong resistance zone, and its conversion to support suggests a foundational shift in market sentiment towards PEPE.

PEPE price analysis

Moreover, PEPE is currently approaching a crucial resistance marked by a descending trend line in red, indicating a potential breakout point. However, Shiller cautiously notes that while the asset is on the verge of breaking this downtrend, there’s a risk of what he terms a “fakeout.” This scenario could see the price initially breaking above the trend line only to retract back below it, potentially leading to a decline of about 13% towards the established support zone at $0.0047423.

Should this support hold against market volatility—a common challenge in the crypto trading sphere—it may serve as a springboard for PEPE. Shiller speculates a possible rally that could result in a 47.47% increase from the support level, targeting an upper price level of $0.000011. Such a movement would not only confirm the strength of the current support but also signify a strong bullish market phase for PEPE.

The analysis also pays close attention to the Relative Strength Index (RSI) hovering near the 50 mark, a neutral territory that indicates the asset is neither overbought nor oversold. This positioning suggests the potential for significant price movement in either direction, emphasizing the importance of the upcoming potential breakout or fakeout scenario.

Cold Blooded Shiller’s analysis concludes with a nod towards taking a chance on PEPE if it begins to show signs of a firm breakout. His detailed observation and the technical markers he highlights suggest that, despite potential risks, the reward could indeed be substantial should favorable conditions prevail.

“PEPE [is] one of the sexiest looking charts out there right now. Consolidating above it’s former significant level. Does it have the chance for lower and some fuckery with a fakeout? Yes. Is it worth the opportunity shot if it starts to breakout? Absolutely yes,” he stated.

At press time, PEPE was trading at $0.000006976. Thus, the meme coin is approaching the 200-EMA at $0.000006677. If this support does not hold, a retest of the red support zone seems plausible.

PEPE price

XRP Price Edges Up As Ripple Forms Major Partnership In Japan

Ripple has announced a major partnership with Tokyo-based HashKey DX, a consulting company of the HashKey Group, to deploy XRP Ledger (XRPL)-powered enterprise solutions in Japan’s burgeoning blockchain sector. The announcement led to an immediate 1.9% increase in XRP’s price, although this gain was slightly pared back; as of the latest data, XRP stands 1.1% higher since the news broke.

The Ripple And HashKey Partnership: Details

The collaboration leverages the substantial success HashKey Group has seen in mainland China. HashKey‘s blockchain-powered solutions for supply chain finance have registered over 4,000 companies, including 23 banks and 4,300 suppliers. The total transaction volume through these solutions has exceeded $7 billion, with almost $3 billion in financing transactions.

In Japan, these blockchain solutions will be adapted and deployed through a partnership involving Ripple and SBI Ripple Asia, a joint venture between SBI Holdings and Ripple. The XRPL will be the foundational technology platform. This blockchain specializes in tokenizing and exchanging both crypto-native and real-world assets.

Andy Dan, a representative from HashKey DX, highlighted the efficiency and suitability of XRPL for their needs, stating, “The XRPL was the ideal blockchain infrastructure for us to build our proven supply chain finance solution. With its proven enterprise track record and unmatched performance metrics, including rapid settlement speeds, low costs, and scalability, we are confident in our ability to drive meaningful transformation and introduce innovative, cutting-edge solutions for businesses in Japan.”

Emi Yoshikawa, Vice President of Strategic Initiatives at Ripple, echoed this enthusiasm for the partnership: “We are excited to join forces with HashKey DX and SBI Ripple Asia to introduce XRP Ledger-powered solutions to Japan. This collaboration exemplifies our shared commitment to advancing blockchain technology and delivering tangible value to businesses.”

XRP Price Analysis

The initial spike in XRP’s price post-announcement reflects the market’s optimistic reception of Ripple’s strategic moves. However, the broader price action context reveals more complexity.

Over recent weeks, XRP has experienced volatility, notably breaking down from a symmetrical triangle pattern on the weekly chart that began forming in September 2021. This pattern typically indicates a period of consolidation, with the eventual breakout direction suggesting the prevailing market force.

XRP price

Currently, the breakdown suggests that sellers have gained the upper hand, with the triangle now acting as a resistance zone. XRP faces multiple hurdles ahead as it is currently trading below several critical exponential moving averages (EMAs) – 20, 50, 100, and 200-week EMAs, all nested within the former triangle pattern. This setup presents significant resistance levels that need to be overcome for bullish momentum to resume.

The Relative Strength Index (RSI), currently at 49, hovers near the neutral 50 mark, indicating that neither bulls nor bears have definitive control. This neutral position underlines the market’s current uncertainty, waiting for a catalyst that could drive the next significant price movement.

Should the bulls regain control and push the price above the triangle’s resistance, the 0.236 Fibonacci retracement level at $0.68410 could initiate a shift in sentiment and potentially more robust gains for XRP.

Legendary Trader Predicts When Bitcoin’s Bull Run Will End

In a recent analysis, veteran trader Peter Brandt delved into the price behavior of Bitcoin, suggesting that the cryptocurrency might have reached its peak for the current cycle. According to Brandt, Bitcoin is exhibiting signs of “Exponential Decay,” indicating a weakening in the momentum of its bull market cycles over the years.

“Does history make a case that Bitcoin has topped? It’s called Exponential Decay — and it describes Bitcoin,” Brandt wrote. He further explained, “The fact is that the bull market cycles in Bitcoin have lost a tremendous amount of thrust over the years… I don’t like the Exponential Decay occurring in Bitcoin — Bitcoin is one of my personal largest investment positions.”

Brandt provided a historical breakdown of Bitcoin’s bull cycles, noting a consistent decrease in the magnitude of gains:

  • The bull cycle from December 21, 2009, to June 6, 2011, demonstrated a staggering 3,191X advance.
  • The subsequent cycle from November 14, 2011, to November 25, 2013, showed a reduced yet impressive 572X advance.
  • The period from August 17, 2015, to December 18, 2017, recorded a further diminished 122X advance.
  • More recently, the cycle from December 10, 2018, to November 8, 2021, saw just a 22X advance.

Bitcoin Reached Its Cycle Peak With A Probability Of 25%

Drawing on these historical patterns, Brandt extrapolated that the current cycle, which began on November 21, 2022, would likely see an approximate 4.5X gain from its low of $15,473, predicting a potential high near $72,723. Notably, this peak has already been nearly met with a price of $73,835 recorded on March 14, 2024. Brandt underscores this observation with a caution, “The magnitude of each bull cycle has been roughly 20% of its predecessor, indicating significant energy loss.”

In his analysis, Brandt does not shy away from addressing the implications of Bitcoin’s halving events, which have historically been catalysts for substantial price increases. Despite this, he emphasizes the undeniable presence of the decay pattern: “But for now, we need to deal with the fact of Exponential Decay. It has happened. It is real. You may not want to believe it, but I place a 25% chance that Bitcoin has already topped for this cycle.”

In a communication on X, Brandt responded to a counter analysis by fellow analyst @Giovann35084111, who argued that Bitcoin follows a power law over time, suggesting the potential for ongoing growth despite the observed decay. Brandt acknowledged the validity. “Quite a thorough analysis,” Brand commented.

@Giovann35084111’s analysis extends beyond cyclical trends by illustrating how deviations from the power law at specific intervals, particularly around halving events, provide a structured prediction model. This approach projects systematic patterns in Bitcoin’s price movements, reinforcing a bullish outlook. The analyst predicts a significant rise in Bitcoin’s price, estimating the next top at the end of 2025 to reach between $210,000 and $250,000.

In a later post, Brandt emphasized that his main prediction is an ongoing bull market into September/October 2025. He explained, “I give more credence to a report I issued in February. Here is a chart from that analysis — projecting a bull market until Sep/Oct 2025,” indicating that his views are influenced by evolving market data and theoretical models.

At press time, BTC traded at $62,450.

Bitcoin price

Alarm Bells Ring For Dogecoin: Bearish Signal Points To 40% Crash

Crypto analyst Josh Olszewicz is once again warning of a looming Dogecoin price crash. The analysis hinges on the Ichimoku Cloud, a comprehensive indicator that provides information on support/resistance levels, momentum, and trend direction. Olszewicz’s analysis points to two specific technical phenomena on the 1-day (1D) chart of DOGE against the US dollar (DOGE/USD). Via X, he remarked “1D DOGE: bearish TK cross + bearish Kumo breakout.

Bearish Signals For Dogecoin

The bearish TK cross refers to the bearish crossover between the Tenkan-Sen (conversion line) and the Kijun-Sen (baseline) within the Ichimoku Cloud system.

Dogecoin price analysis

The Tenkan-Sen, which is a faster-moving line typically calculated as the midpoint of the highest high and lowest low over the last nine periods, crossing below the Kijun-Sen, a slower line computed as the midpoint of the highest high and the lowest low over the past 26 periods, is considered a bearish signal.

It suggests that short-term prices are falling below the base level of prices over the last month, indicating potential further downward movement.

The Bearish Kumo breakout: The ‘Kumo’, which translates to ‘cloud’, is part of the Ichimoku Cloud indicator and is formed between two other lines: the Senkou Span A and the Senkou Span B. It represents a key area on the chart that can act as support or resistance.

In the context of Olszewicz’s analysis, a ‘bearish Kumo breakout’ implies that the price has broken through the cloud downwards. This breakout is seen as a confirmation of a bearish trend. The fact that the price is below the Kumo suggests that the overall market sentiment for DOGE is negative, with the Kumo now likely acting as resistance to any upward price movement.

The chart by Olszewicz shows DOGE trading at $0.15 with the cloud plotted behind the price action, appearing green above and red below the price lines. The cloud turning green represents a bullish future potential, but the price below both the cloud and the Tenkan-Sen/Kijun-Sen crossover indicates bearish current circumstances.

A 40% Price Crash Looming?

This gives weight to Olszewicz previous DOGE price analysis. As NewsBTC reported, the crypto analyst warned of a potential Head and Shoulders (H&S) formation on the DOGE/USD 12-hour chart which could be validated soon.

The formation is characterized by two shoulders flanking a distinctive head, with the neckline at approximately $0.14 being pivotal. Should Dogecoin’s price break below this critical support, the prophecy of the H&S pattern would likely manifest, potentially triggering a sell-off towards the $0.10 to $0.09 region.

This target area aligns with the 1.618 and 2.0 Fibonacci extension levels, suggesting a price crash of around 40% from the neckline. While the pattern has not yet been confirmed, with the price still above the crucial $0.14 support level, its presence serves as a cautionary signal to the market.

The technical confluence of the bearish TK cross and the bearish Kumo breakout in Olszewicz’s recent analysis only reinforces the possible bearish scenario that lies ahead for Dogecoin. Market participants are recommended to keep a close watch on the $0.14 level, as a decisive break below could validate the bearish outlook and set the stage for the anticipated decline.

At press time, DOGE traded at $0.1413.

Dogecoin price

After WIF, BONK, BODEN: Top Crypto Trader Now Buys These 2 Memecoins

Memecoins are once making waves in the crypto market. In the last 24 hours, 4 of the 10 best-performing cryptocurrencies in the top 100 are meme coins. The biggest gainers include BONK (+10.2%), PEPE (+4.8%), WIF (+4.7%) and FLOKI (+4.1%). With meme coins slowly regaining, crypto traders are seemingly focusing on lesser-known coins.

Top Crypto Trader Focuses On These 2 Memecoins

According to data from on-chain analysis service Lookonchain, the renowned crypto trader known as “paulo.sol” has been making significant moves into new memecoin territories. Paulo.sol, who has previously amassed substantial profits from meme coins like BONK, WIF, and BODEN, is now shifting his focus to acquiring significant stakes in PUPS and POPCAT.

Lookonchain’s recent posts on X (formerly Twitter) provide a deep dive into paulo.sol’s past and present investment patterns. “What a legend! Paulo.sol has realized profits of $9.51M on WIF, $7.04M on BODEN, and $6.28M on BONK,” Lookonchain tweeted. In total, the crypto trader has made $22 million in realized profits.

The posts further reveal that paulo.sol bought into BONK early in November 2023, capturing substantial gains as its value surged. “As early as Nov 11, 2023, paulo.sol noticed the rising of BONK and bought BONK. He made ~$6.28M by buying BONK at low prices and selling at high,” the data provider stated.

The crypto trader continued his strategy by investing in WIF and BODEN in December 2023 and March 2024, respectively, following their sharp price increases. Notably, “paulo.sol did not buy WIF and BODEN when they first went online, but paid attention to and bought heavily when they first rose sharply,” Lookonchain observes.

As of now, paulo.sol continues to hold 12.87 million BODEN tokens valued at approximately $7.6 million and 1.87 million WIF tokens worth around $5.7 million. However, his most recent activities show a pivot towards new meme coins, PUPS and POPCAT, sparking interest among investors and analysts alike.

Lookonchain noted, “We noticed that paulo.sol is buying PUPS and POPCAT recently. He spent $1.77M to buy 4.3M POPCAT at $0.42 today. And he has spent $5.97M to buy 101,712 PUPS at $59 since Apr 11, becoming the largest holder of PUPS on Solana.”

The impact of paulo.sol’s investment has been palpable in the market dynamics of the newly favored meme coins. Despite a general downturn in the memecoin sector, POPCAT’s price surged by 52% today, trading at approximately $0.51 with a trading volume increase of 51% to $166 million. Over the past nine days, POPCAT has risen a whopping 410%.

On the other hand, PUPS is seeing a price drop of 4.2% today, trading at $36.96, with a 27% fall in trading volume to $2.82 million. Since reaching an all-time high above $152 on April 14 (on Coinex), the PUPS price is down more than 78%.

PUPS price

Crypto Bull Run Set To Return Next Week, Predicts Arthur Hayes

Arthur Hayes, co-founder and former CEO of the cryptocurrency exchange BitMEX, took to X to provide a detailed analysis of the US economic landscape and its potential effects on the crypto market. With a reputation for incisive commentary and a deep understanding of both traditional and digital finance, Hayes’s insights are closely watched by industry participants.

Why The Crypto Bull Run Will Return As Soon As Monday

In a post, Hayes noted a significant increase in the Treasury General Account (TGA), which he attributed to an influx of approximately $200 billion from tax receipts. “As expected tax receipts added roughly $200bn to TGA,” Hayes stated, setting the stage for a broader discussion on potential implications for financial markets.

Hayes then shifted focus to upcoming decisions by US Treasury Secretary Janet Yellen concerning the management of the TGA. With a tone mixing respect and sternness, he outlined several potential scenarios, each with profound implications for market liquidity. “Forget about the May Fed meeting. The 2Q24 refunding announcement comes out next week. What games will [Janet] Yellen play, here are some options,” Hayes remarked.

Firstly, he suggested that by “stopping issuing treasuries by running down the TGA to zero,” Yellen could unleash a $1 trillion liquidity injection into the economy. This strategy would involve using the accumulated funds in the TGA for federal spending without issuing new debt, thus directly boosting the money supply.

Secondly, Hayes speculated about “shifting more borrowing to T-bills, which removes money from RRP,” resulting in a $400 billion liquidity boost. This maneuver would involve the Treasury opting for shorter-duration debt instruments, which typically carry lower interest rates but increase the turnover of government securities. This could potentially draw funds away from the overnight reverse repo market, where financial institutions temporarily park their excess cash.

Combining these two approaches, according to Hayes, could lead to “a $1.4 trillion injection of liquidity” if Yellen decides to both cease long-term bond issuance and ramp up the issuance of bills while depleting both TGA and RRP accounts. Hayes emphatically noted, “The Fed is irrelevant, Yellen is a bad bitch, you best respect her.” This statement underscores his belief in the significant impact of Treasury actions over Federal Reserve policies in the current economic setup.

Hayes predicted that these actions could lead to a bullish response in the stock market and, more crucially, a rapid acceleration in the crypto market. “If any of these three options happen, expect a rally in stonks and most importantly a re-acceleration of the crypto bull market,” he explained.

The implications of such fiscal strategies are significant. Increased liquidity typically diminishes the appeal of low-yield investments like bonds and encourages the pursuit of higher returns in riskier assets, including equities and cryptocurrencies. Moreover, a shift in market sentiment toward ‘risk-on’ could see substantial capital flows into the crypto space, perceived as a high-growth, albeit volatile, investment frontier.

In conclusion, Hayes’ analysis suggests that the coming week – the refunding announcement comes on Monday, April 29 – could be critical for market watchers. His perspective, drawing from deep financial expertise, points to a possible pivotal shift in US fiscal policy that could ripple through global markets. For crypto investors, these developments could signal important movements, underlining the need for vigilance and readiness to respond to new economic signals.

At press time, BTC traded at $64,483.

Bitcoin price

Why Is The Crypto Market Down Today? Key Reasons Explained

The crypto market is in the red today, with a majority of the top-100 cryptocurrencies reflecting losses over the last 24 hours. Notably, only six altcoins, including two stablecoins, have managed to maintain a positive performance amidst a broader market sell-off.

Several complex and intertwined factors have contributed to the day’s negative market sentiment, affecting major cryptocurrencies. Over the last 24 hours, the price of Bitcoin has decreased by 4.2%, Ethereum has fallen by 5.0%, Solana has dropped by 8.7%, XRP has declined by 4.7%, and Dogecoin has decreased by 8.3%.

#1 Persistent Macroeconomic Uncertainty

A primary factor influencing today’s market movements is the evolving macroeconomic landscape, particularly concerning US interest rates and inflation expectations. At the beginning of the year, the market anticipated aggressive monetary easing by the Federal Reserve. However, the sentiment has shifted considerably based on recent data and Federal Reserve signals.

“Markets are pricing in fewer rate cuts for this year compared to the Fed’s dot plot projection of 3 rate cuts by year end. The implied fed funds rate for December has risen to 5.0%, indicating that the futures market is pricing in only 1 to 2 rate cuts,” Cetera Investment Management stated via X (formerly Twitter).

This week, all eyes are on the release of the Personal Consumption Expenditures (PCE) price index for March—the Fed’s favored inflation measure on Friday, April 26 at 8:30 am EDT. Until then, the market could be in a derisk mode.

The PCE is anticipated to present a varied view of inflation trends, which could strengthen the Federal Reserve’s inclination to delay any increases in interest rates. Analysts predict a slight increase in the overall PCE Price Index, rising to 2.6% year-over-year from 2.5% in February. Additionally, they expect a decrease in the index’s month-over-month change, dropping to 0.30% from 0.33%.

#2 Crypto Market In Shock Over Legal Action Against Samourai Wallet

The crypto market has also been rocked by yesterday’s legal developments involving the Samourai Wallet. The US Federal prosecutors’ decision to charge the founders Keonne Rodriguez and William Lonergan Hill with money laundering and operating an unlicensed money transmitting business has sent ripples through the crypto community. This action underscores the ongoing regulatory scrutiny within the crypto space.

The prosecution of Samourai Wallet’s founders not only raises questions about the future of cryptographic privacy but also significantly impacts market sentiment as it underscores the legal risks inherent in the crypto sector. The implications of this case extend beyond the immediate legal concerns, influencing broader market perceptions and investor confidence.

#3 Bitcoin And Crypto Are “Just Ranging”

Further insights into market dynamics come from prominent crypto analysts who have commented on the state of market liquidity and trader behavior. “The market has gifted us with a beautiful reset in trader positioning for Bitcoin. OI weighted funding turned negative for the first time since October 2023. That was before Bitcoin ran from 27k to 46k without any meaningful dip,” said Ted, a crypto analyst on X.

This reset refers to a reduction in the overheated futures market, which could allow the market to consolidate and potentially build a base for future upward movements.

Emperor, another crypto analyst, described the current market state through a series of tweets, highlighting the ongoing consolidation phase post-highs: “Too much panic still on the timeline but we’ve been ranging since the ATH, that’s all.”

He added, “The bear/bull line is an important resistance + Point of Control (PoC) of our range. Expecting VaL (Value Area Low) to hold on pullbacks and VaH (Value area High) to be the next target on longs if we reclaim level 1.”

#4 Bitcoin ETFs Remain Muted

Yesterday’s ETF flows were negative again. Only Fidelity’s FBTC and Ark Invest’s ARKB had minimal inflows. GBTC sold more again at -$130.4m and BlackRock had zero inflows for the first time ever since inception on January 11. Thus, BlackRock’s (IBIT) inflow streak ended at 70 days. Prior to this, IBIT entered into the top 10 all time after passing the ETFs like JETS, BND and VEA.

Notably, the momentum for spot Bitcoin ETFs has waned significantly in the past two weeks. The last notable day of inflows was on March 26, when they surpassed $400 million—nearly a month ago. On the bright side, despite this slowdown, there have been no outflows from either BlackRock or Fidelity. Grayscale’s GBTC remains the primary negative factor driving outflows.

Furthermore, there seems to be a decrease in investment willingness among traditional sector investors; the total inflows through ETFs have been stagnant for more than 30 days, coinciding with a flat trend in Bitcoin prices.

At press time, BTC traded at $64,034.

Bitcoin price

Head And Shoulders Alert: Dogecoin Could See A Price Crash Soon

Crypto analysts are sounding the alarm on Dogecoin as a classic chart pattern, known for predicting bearish trends, has emerged. Technical analyst Josh Olszewicz, @CarpeNoctom, flagged a potential Head and Shoulders (H&S) formation on the DOGE/USD 12-hour chart on X, hinting at a possible significant price drop if the pattern validates.

The H&S pattern is a technical indicator traditionally viewed as a bearish signal within the trading community. The pattern is composed of three peaks, with the central peak (the head) being the highest and the two outside peaks (the shoulders) being lower and approximately equal in height. The line connecting the lowest points of the two troughs (the neckline) can be horizontal or sloped and represents a critical support level.

Dogecoin Must Hold $0.14

In the case of Dogecoin’s 12-hour chart, the price has completed the left shoulder and the head, with the right shoulder currently forming. The neckline of this H&S pattern is identified at approximately $0.14, as annotated by Olszewicz. This level is crucial; a decisive break below could confirm the bearish forecast suggested by the H&S formation.

Dogecoin head & shoulder pattern, 12-hour chart

Another technical detail present on the chart is the Fibonacci retracement levels, which are horizontal lines indicating where support and resistance are likely to occur. They are based on Fibonacci numbers, a sequence famous in mathematics and nature for its proportionality.

Here, the 0.5 Fibonacci level aligns with the left shoulder around $0.18, while the 0 level coincides with the peak at approximately $0.23. These levels are key to determining the potential support and resistance areas in the market.

Olszewicz has also highlighted a projected target area based on the H&S pattern’s typical behavior. This bearish target is identified using the height of the pattern from the head’s peak to the neckline, projected downward from the point of the neckline break. The target box, marked in green, shows a potential decline to $0.10 to $0.09, coinciding with the 1.618 and 2.0 Fibonacci extension levels. A fall to this level could lead to a price crash of 40%.

The importance of the H&S pattern lies in its reliability as a trend reversal signal. It validates when the price breaks below the neckline following the formation of the right shoulder. For traders and investors alike, this pattern serves as a cautionary tale to brace for potential downside risks.

As of the latest chart by Olszewicz, the neckline has not been breached, and the pattern has yet to be confirmed. It is critical for observers to watch the $0.14 level closely, as a break below it would likely activate a sell-off, fulfilling the H&S prophecy. However, until such a break occurs, the pattern remains a watchful indicator rather than a confirmed trend reversal.

In summary, Dogecoin’s price chart is showing signs that could concern bullish investors. If history is any guide, the emerging H&S pattern, closely watched by analysts like Olszewicz, suggests a possible downward move in Dogecoin’s value in the near future. However, only a decisive break below the neckline will validate this pattern, turning a watchful eye into a bearish outlook.

At press time, DOGE traded at $0.1509.

Dogecoin price

Solana Memecoins WIF And BONK Explode By Double Digits: Key Reasons

Two Solana-based memecoins, Bonk (BONK) and Dogwifhat (WIF), have registered substantial gains over the past 24 hours. BONK recorded a 35% increase, while WIF climbed by 19%, positioning them among the top three gainers in the top 100 cryptocurrencies by market cap today. Only Hedera Hashgraph (HBAR) surpassed them, with a notable 44% rise during the same period.

Resolution Of Solana’s Congestion Issues Spurs Memecoins

The significant uptick in these Solana memecoins is closely linked to the recent improvements in the Solana network’s performance. A tweet from SolanaFloor earlier today indicated, “BREAKING: Solana’s congestion issues have been completely resolved, with block production back to normal. Transactions confirming in under 2 seconds.” This announcement marks a pivotal moment for the network which had been plagued by congestion issues.

On April 15, Solana developers rolled out crucial updates designed to alleviate these problems, urging validators to adopt version v1.17.31. This version introduces changes in the treatment of validators based on their stakes. Further enhancements are anticipated with the release of version v1.18 next month, which will include a new scheduler, albeit disabled by default.

Andrew Kang, founder of Mechanism Capital, remarked a few days before the fix, “Let’s also not forget that the Solana congestion issues have weighed down SOL and Solana-based memecoins significantly. It’s not a question of if but when the network is significantly improved. That’s your springboard.” Kang’s comments now seem prophetic as the resolution of network issues has indeed acted as a springboard for memecoin valuations.

Specifics On Rally Of Dogwifhat (WIF) And BONK

The price of WIF soared to a 24-hour high of $3.43 on April 24, buoyed by an impressive 96% increase in trading volume. This influx was fueled by notable acquisitions from whales like Ansem, who capitalized on the positive market sentiments.

The breakout above the resistance level at $3.18, after a week of sideways trading between $1.97 and $3.18, was a significant trigger. WIF formed a two-week-long ascending triangle, a bullish chart pattern that indicated a continuation of the previous upward trend. The breakout was widely discussed in the crypto community, with trader Bluntz Capital confirming the pattern’s resolution and sparking further bullish sentiment.

BONK is registering a dramatic 35% rise, with a remarkable 304% increase in trading volume. The price action successfully breached the 0.236 Fibonacci retracement level at $0.000020727, and continued its upward trajectory to the 0.5 Fibonacci level, signaling strong buying interest and bullish momentum.

This rally probably gained additional support from the recent listing of BONK by the global neobank Revolut, which was announced on April 22. This inclusion in Revolut’s trading platform, which features over 150 digital currencies, provided significant exposure and legitimacy, further enhancing investor interest and market activity around BONK.

BONK price

How To Outperform In Crypto: Arthur Hayes’ ‘Left Curve’ Strategy

In his latest essay, Arthur Hayes, the former CEO of crypto exchange BitMEX, introduced a bold investment philosophy he calls the “Left Curve.” This strategy diverges sharply from traditional investment approaches typically adopted during bull markets in the crypto world. Hayes’ essay serves not only as an investment manifesto but also as a critique of conventional financial wisdom, encouraging investors to maximize their returns by embracing more aggressive tactics.

Crypto Bull Run Just Got Started

Hayes begins by criticizing the common investor mentality that prevails during bull markets, particularly the tendency to revert to conservative strategies after initial gains. He argues that many investors, despite having made profitable decisions, fail to capitalize fully on bull markets by selling their holdings too soon—particularly when they convert high-performing cryptocurrencies into fiat currencies.

“Some of you think you are masters of the universe right now because you bought Solana sub $10 and sold it at $200,” he states, challenging the notion that such actions demonstrate market mastery. Instead, Hayes promotes a strategy of sustained investment and accumulation, particularly in Bitcoin, which he refers to as “the hardest money ever created.”

A central thesis of Hayes’ argument is the critique of fiat currency as a safe haven for profits taken from cryptocurrency investments. “If you sold shitcoins for fiat that you don’t immediately need for living expenses, you are fucking up,” Hayes bluntly asserts.

He discusses the inherent weaknesses of fiat money, primarily its susceptibility to inflation and devaluation through endless cycles of printing by central banks. “Fiat will continue to be printed ad infinitum until the system resets,” he predicts, suggesting that fiat currencies are inherently unstable storage of value compared to cryptocurrencies.

Hayes extends his analysis to the macroeconomic factors influencing cryptocurrency markets. He describes how major economies like the US, China, the European Union, and Japan are debasing their currencies to manage national debt levels.

This macroeconomic maneuvering, according to Hayes, is inadvertently setting the stage for cryptocurrencies to rise. He points out the increasing adoption of Bitcoin ETFs in the US, UK, and Hong Kong markets as a tool for institutional and retail investors to hedge against fiat depreciation.

This part of his analysis underscores a broader acceptance of cryptocurrency as a legitimate asset class in traditional investment circles, powered by the realization that traditional financial systems are struggling under the weight of unsustainable fiscal policies.

Hayes also delves into the strategic aspects of market timing, particularly around events known to influence market dynamics, such as US tax payment deadlines and Bitcoin halving. He notes:

As we exit the window of weakness that I forecasted would occur due to April 15th US tax payments and the Bitcoin halving, I want to remind readers why the bull market will continue and prices will get sillier on the upside.

This observation suggests that understanding these cyclic events can provide strategic entry and exit points for maximizing investment returns. Emphasizing psychological resilience, Hayes encourages investors to adopt a mindset that resists the conventional impulse to cash out during brief market rallies. “At this moment, I will resist the urge to take chips off the table. I will encourage myself to add more to the winners,” he advises, promoting a long-term view of investment in cryptocurrencies.

This approach, according to Hayes, is essential for realizing the full potential of crypto investments, particularly in a market characterized by high volatility and rapid gains. In conclusion, Hayes’ “Left Curve” philosophy is more than just an investment strategy; it is a comprehensive approach that encompasses understanding macroeconomic trends, psychological resilience, and strategic market timing.

His essay serves as a guide for investors looking to navigate the complexities of crypto markets with a bold, assertive strategy that challenges traditional financial doctrines.

At press time, BTC traded at $66,789.

Bitcoin price

Akash Network (AKT) Leads Crypto Top 100 With 46% Rise Today: Here’s Why

Amidst a rather quiet altcoin market, Akash Network (AKT) has emerged as today’s standout performer among the top 100 cryptocurrencies by market capitalization, recording a significant 46% increase in price over the past 24 hours. This surge has propelled AKT to the forefront, well ahead of its peers such as Core (CORE) and Arweave (AR), which posted gains of 7% and 6%, respectively.

As of this writing, AKT is trading at $6.03. This increase in price has pushed its market cap to approximately $1.4 billion, positioning it as the 68th-largest cryptocurrency. Additionally, Akash Network’s trading volume has seen a dramatic rise of 2,790%, reaching $116 million today.

Earlier today, AKT reached a new all-time high of $6.84 on the cryptocurrency exchange Kraken, though it has since adjusted to around $6.03, below its previous peak of $6.49.

Catalysts For The Akash Network Surge

The primary driver behind today’s price escalation appears to be an announcement from Upbit, a major South Korean cryptocurrency exchange. Upbit has confirmed that it will list AKT, offering trading pairs in South Korean Won (KRW), Bitcoin (BTC), and Tether (USDT) starting at 10:00 UTC today.

Further fueling investor interest, data from Santiment, a market intelligence platform, shows that Akash Network’s social media volume has spiked by 200% in the last 24 hours. This surge in social activity, predominantly on platforms like Reddit and Bitcointalk, has played a significant role in AKT’s market performance.

Future Price Trajectory

Looking ahead, if AKT’s price can record a daily close above the previous all-time high of $6.49 (set on March 11, 2024) today, the next target could be $7.46, corresponding to the 1.272 Fibonacci extension of the overarching price movement. Should the buying pressure continue, a move towards $8.64, marked by the 1.618 Fibonacci extension, might be on the horizon. Here, traders should anticipate potential profit-taking.

Akash Price

A breakthrough beyond this level could pave the way to medium-term targets at $10.92 (2.272 Fibonacci extension) and potentially even $12.13 (2.618 Fibonacci projection), contingent on continued bullish sentiment across the broader crypto market.

Conversely, if AKT fails to uphold its new highs and closes below $6.48, a downward correction towards the $5.74 zone (0.786 Fibonacci level) could occur, where new buying opportunities might arise. A further dip below this level could see retests of the $5.16 (0.618 Fibonacci level) and $4.75 (0.5 Fibonacci level) support zones.

The trajectory of AKT, like that of many cryptocurrencies, could be influenced by broader market conditions, including potential downturns triggered by accelerating US inflation, the US Fed’s favorite inflation gauge, the Personal Consumption Expenditures Price Index (PCE) is set for release on Friday, April 26, or other macroeconomic factors.

Nevertheless, the 200-day exponential moving average (EMA), currently at $3.24, remains the most critical long-term support level for AKT.

Standard Chartered Reaffirms $150,000 Bitcoin Price Target By Year-End

Geoff Kendrick, head of digital assets research at Standard Chartered, recently reiterated the bank’s ambitious Bitcoin price target of $150,000 by the end of this year, despite current market volatility and geopolitical tensions. In a comprehensive interview with BNN Bloomberg, Kendrick highlighted the significant role of ETF inflows and upcoming halving events in driving Bitcoin’s price.

Why Bitcoin Is Set For A Rally To $150,000 By Year-End

One of the principal drivers identified by Kendrick is the remarkable influx of capital into Bitcoin ETFs within the United States. Since the inception of these ETFs in early 2024, they have witnessed approximately $12 billion in net inflows. Kendrick highlighted the significance of these developments, stating, “The ETF inflows in the US have dominated really the demand supply metrics in 2024 so far. This is huge in terms of how the ETFs have gone so far.”

He drew parallels between the current trends in Bitcoin and the historical performance of gold following the introduction of gold ETFs. Kendrick elaborated on the potential scale of this trend by projecting, “From the start of this year to when the ETF market in the US is mature, we’ll get between $50 and $100 billion of inflow.”

In addition to the ETF inflows, the Bitcoin halving event was identified as another pivotal factor. This event, which reduces the reward for mining new blocks thereby halving the rate of new Bitcoin entering circulation, is set to reduce the daily production from 900 BTC to 450 BTC.

Although Kendrick mentioned that this halving might be “less important than previous ones,” he still considers it significant in the short-term supply dynamics. He stated, “Obviously, once we have the halving […], you have only half as many new coins, so that helps at the margin.”

Responding to questions about market skepticism, particularly criticism from figures such as JPMorgan CEO Jamie Dimon, who described Bitcoin as a “Ponzi scheme,” Kendrick offered a defense of Bitcoin’s underlying technology. He argued, “There’s a lot of people out there that don’t understand the basic methodology behind Bitcoin. And it’s really that blockchain technology, which is where the value is medium term.”

Looking Further Ahead

Kendrick continued, explaining the transformative potential of blockchain technology not just for financial services but across various industries, “Bitcoin is the first in on that. It’s the largest asset at the moment, makes up for more than 50% of the crypto market, but that opens up the Ethereum and other use cases, which quite frankly, over the next five to 10 years, you can easily see a lot of traditional finance go on chain.”

Furthermore, he addressed the recent market volatility, noting that Bitcoin had experienced a significant sell-off just prior to the halving, with $260 million in Bitcoin leverage positions being liquidated. The Standard Chartered exec interpreted this as a market correction that might set the stage for a healthier build-up post-halving, saying, “We’ve had a large move lower in Bitcoin. Specifically, on Saturday last weekend, there were $260 million Bitcoin leverage positions that were liquidated. So the market is now looking much more square going into the halving, if you like, in terms of leverage.”

Summarizing his perspective on the future trajectory of Bitcoin, Kendrick expressed a confident outlook, projecting not only recovery but a robust increase in Bitcoin’s price, driven by both the maturation of the ETF market and ongoing technological advancements. His vision for Bitcoin by the end of 2025 reaches even beyond the current year’s target, predicting a potential value of $200,000 per coin.

At press time, BTC traded at $66,556.

Bitcoin price