Uniswap Founder Shares His Two Cents On Good Token Distributions

Hayden Adams, founder of the Uniswap protocol, has shared his opinion on what characterizes a good distribution or rollout of a token. In a recent post on the X platform, the prominent crypto figure listed 10 qualities of good token distributions, highlighting the complexities surrounding the launch of a cryptocurrency.

Uniswap Founder Gives Opinion On Good Token Distributions

Adams began his take on good token distributions by stating that projects should allocate “tokens, not points” to the community. This phrase implies that participants should receive actual tokens that hold value within a particular ecosystem or on a network, instead of receiving points that may have limited utility.

Secondly, Adams warned against creating ambiguity or being vague about a token distribution to increase the number of participants or to “farm the farmers.” A good token distribution practice includes sharing real details when ready, according to the Uniswap founder.

Additionally, Adams criticized “low float tokens,” while calling them malicious. The prominent DeFi figure urged project teams to ensure sufficient tokens are available in circulation to prevent manipulation and allow genuine price discovery.

Adams also discouraged hyping a token’s price and how it will skyrocket before it launches. The founder believes hiring an influencer or a marketing company to promote a token’s value only depicts a get-rich-quick scheme rather than a genuine attempt at building real value.

What’s more, the Uniswap founder stressed the importance of free token airdrops during token distributions. “Don’t be stingy – give a significant amount away. If you don’t think the community deserves a significant amount, don’t release a token,” Adams said in his post.

Ultimately, Adams advised new crypto projects to be careful and thoughtful in their decision-making to avoid making mistakes that might put them at odds with the crypto community. “Create something you’re proud of and stand behind it,” the Uniswap founder added.

A Jab At Friend.tech and its FRIEND?

At the beginning of his post, the Uniswap founder clearly stated that the opinion is not aimed at any specific project. However, the timing is interesting, especially after social media platform Friend.tech’s “unsuccessful” token airdrop.

On Friday, May 3rd, Friend.tech airdropped its new FRIEND tokens to users in conjunction with the launch of the protocol’s version 2. While the token’s value quickly rose to $167 after launch, FRIEND’s price nosedived to below $2 within a few hours.

Analysts pinpointed liquidity issues and a mass sell-off as the primary reasons behind the downturn of FRIEND and, ultimately, the ineffectual token launch. Moreover, many users complained about how challenging it was to claim the token airdrop, as technical drawbacks reportedly frustrated the process.
Uniswap

Bitcoin Back Above $63,000: Will FOMO Fuel Another Rally Or Lead To A Bust?

The Bitcoin price made a strong comeback on Friday after witnessing a significant amount of bearish pressure throughout the past week. On Wednesday, May 1, the premier cryptocurrency fell below the $60,000 mark for the first time in almost two months.

On Friday, May 3, the price of BTC recovered above the $60,000 level, going as high as $63,000 in the past day. However, the question is – can the Bitcoin price enjoy a sustained rally following this latest resurgence?

How Long Will The BTC Price Rally Last?

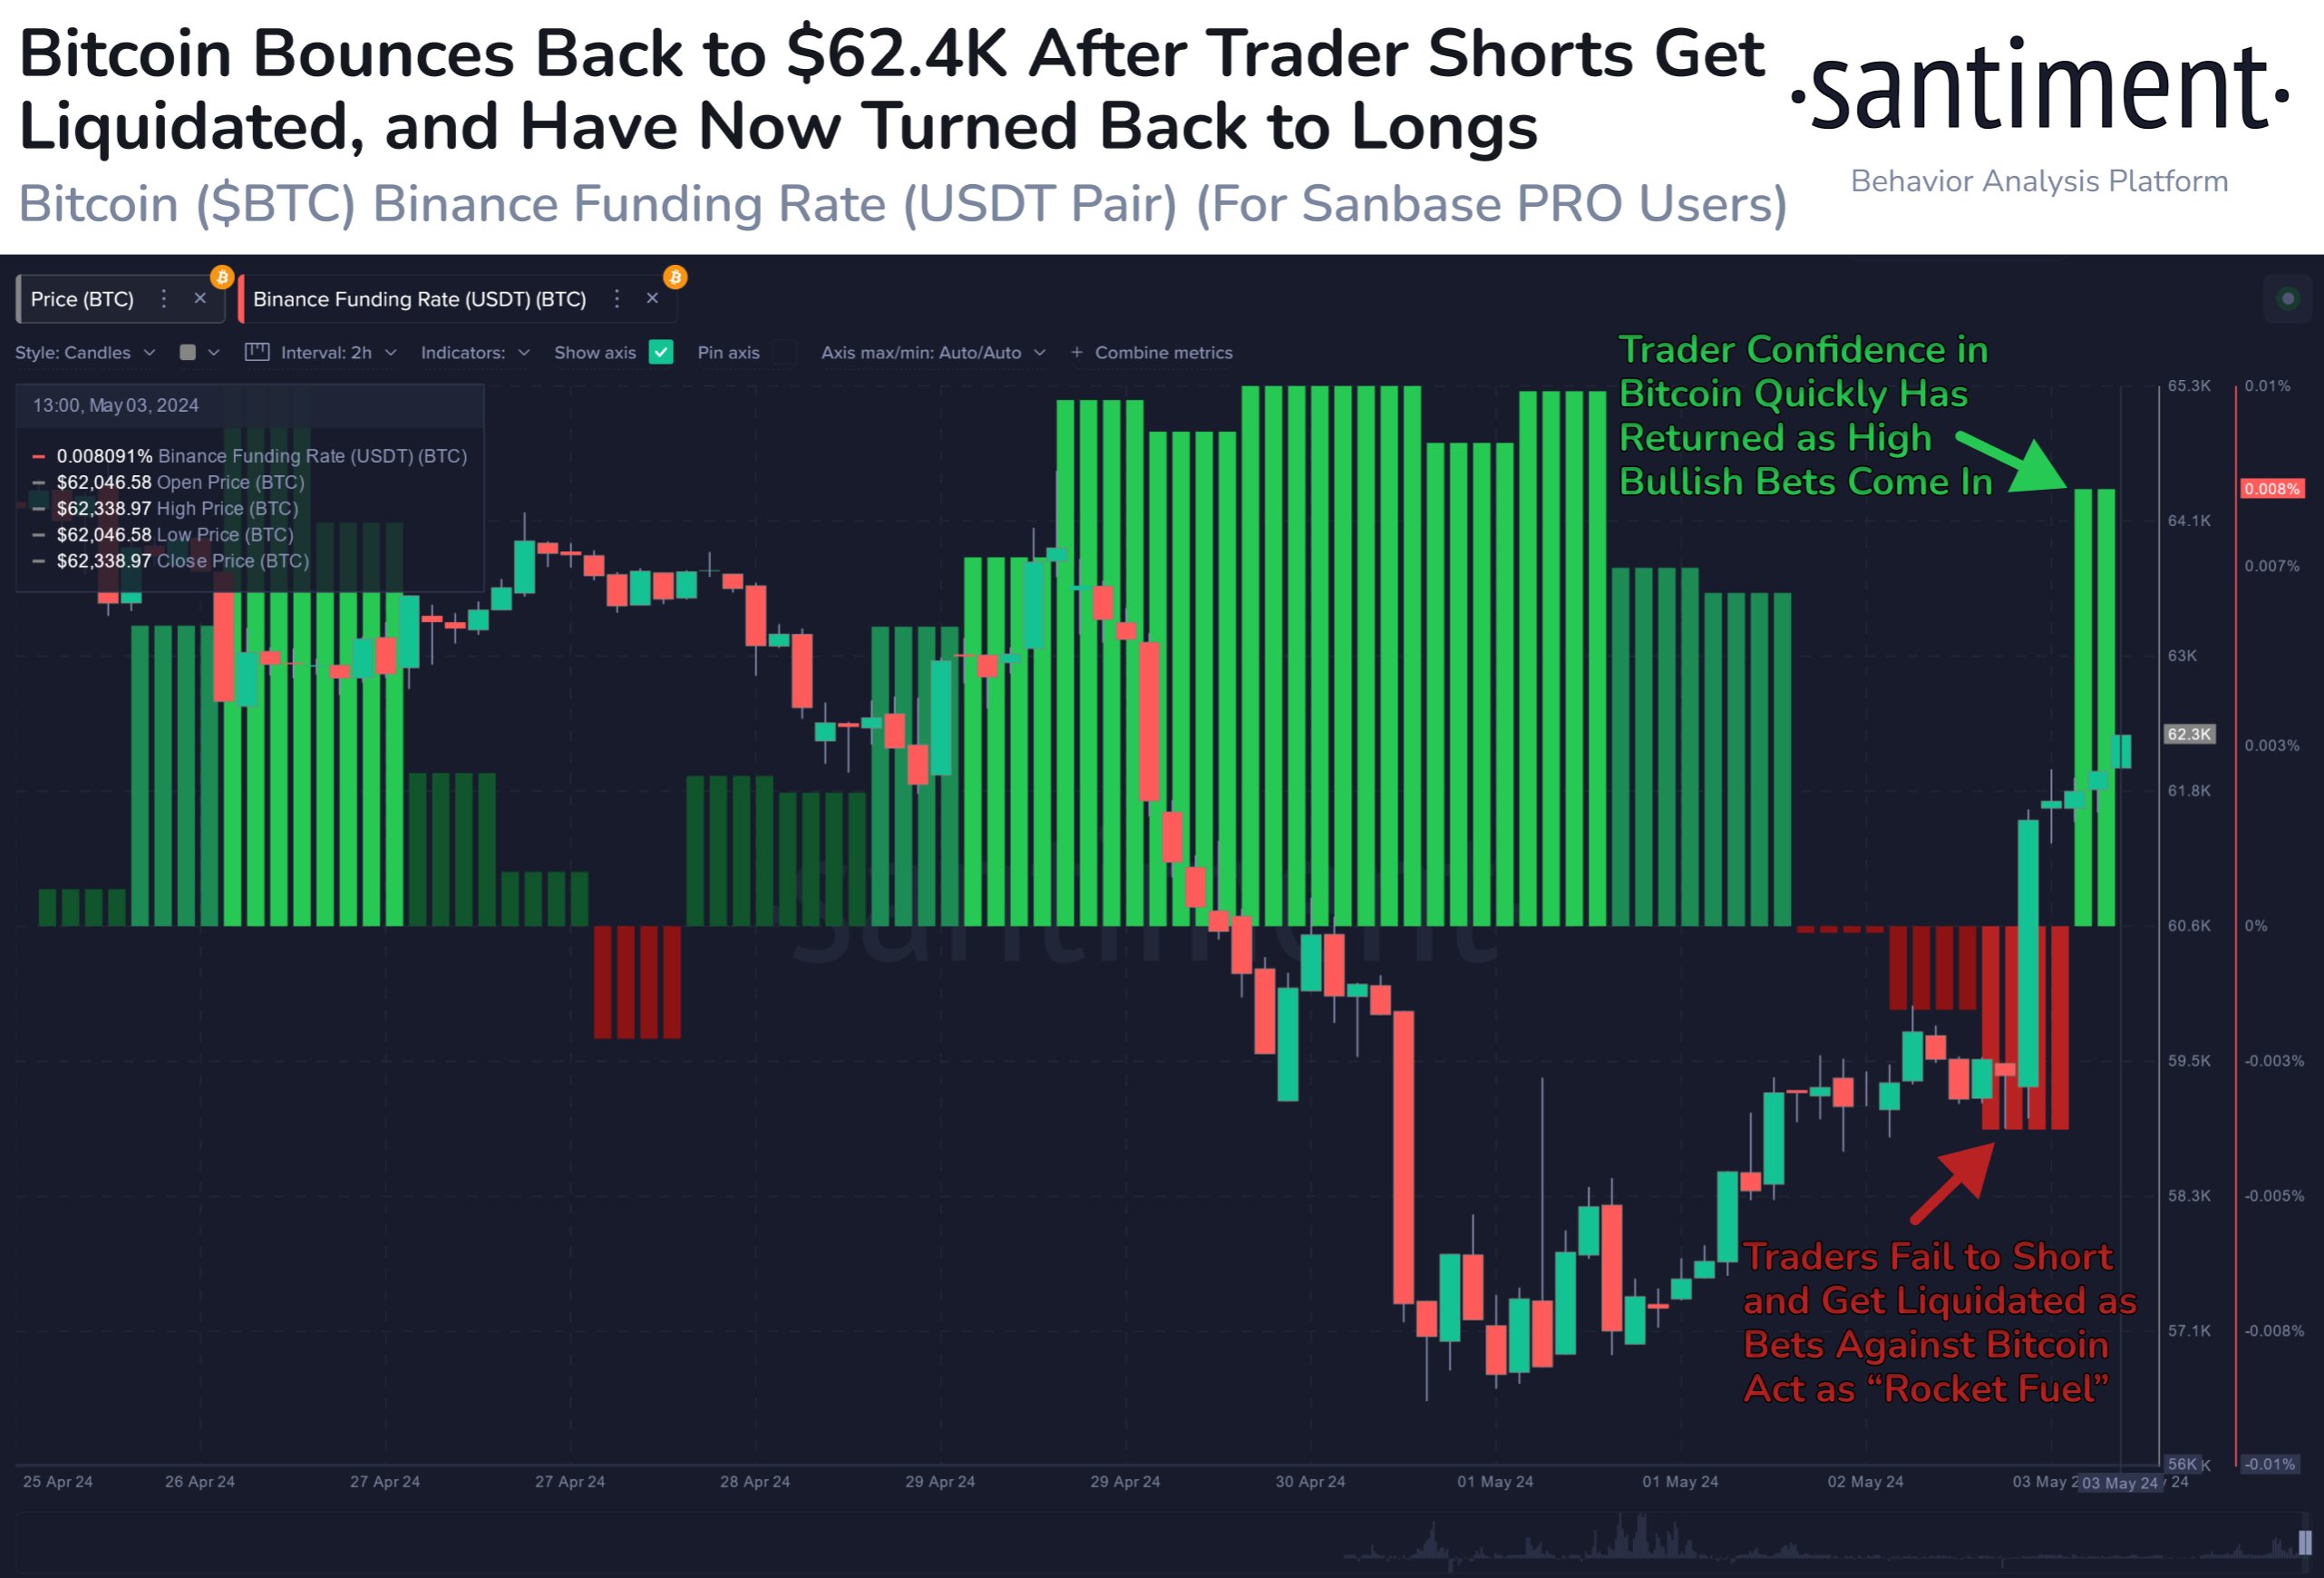
In a recent post on the X platform, Santiment pointed to a shift in investors’ position and sentiment on the Bitcoin price following the recent surge above $62,000. According to the on-chain analytics site, traders on the Binance platform are “going from liquidated shorts to longs” after the latest price increase.

While this shift in sentiment might signal renewed optimism in the premier cryptocurrency, Santiment sounded a warning bell for enthusiasts watching the Bitcoin price and looking to get into the market. The blockchain firm said in its post: 

For the rally to continue, we don’t want to see FOMO rising too much higher than what it appears to be now.

Bitcoin Price

FOMO, or “fear of missing out,” is a phenomenon where investors hastily purchase in-demand assets out of fear of missing out on potential gains. While it can drive the asset to a higher price in the short term, excessive FOMO often results in unsustainable bullish trends and subsequent downturns.

What’s more, crypto prices tend to move in the opposite direction of the crowd’s expectations. Hence, if the majority of traders are betting on the Bitcoin price to rise, there is a great likelihood that the cryptocurrency’s value will experience a drop.

Behind The Bitcoin Price Surge

As of this writing, the Bitcoin price stands at around $62,871, reflecting a substantial 6% increase in the last 24 hours. Although the catalyst for this latest Bitcoin rally remains unclear, on-chain data shows that recent whale activity might have triggered the bullish momentum.

In a recent post on X, CryptoQuant CEO and founder Ki Young Ju revealed that Bitcoin whales acquired 47,000 BTC in a single day. Ju also said that while this class of investors might have included ETF-associated addresses, the recent spike in “balances for whale addresses” is not ETF-related.

Bitcoin price

Ace Exchange Suspects Should Get 20-Year Prison Sentences: Prosecutors

Prosecutors in Taiwan have proposed lengthy prison sentences for ACE Exchange’s founder, David Pan, and former executives as main suspects in an alleged fraud and money laundering case. This development came after the Taiwanese authorities initiated a fresh round of charges against the exchange founder and several others. 

ACE Exchange Defendants Face Potential Lengthy Jail Term

On Friday, April 26, the Taipei District Prosecutors’ Office indicted 32 individuals involved in an alleged money laundering and fraud scheme. Among those indicted are Pan, his business partner Lin Keng-hong, and attorney Wang Chen-huan, who served as the exchange’s chairman. 

The prosecutors alleged that the defendants promoted investments in various tokens, including NFTC tokens, Bitnature coins, and MoChange – a token developed by Ace Exchange. Investigations revealed that the suspects crafted white papers and other documents to enhance the perceived legitimacy of these investments. 

According to the prosecutors, the suspects advertised these tokens through various media outlets while artificially inflating their prices on their exchanges to lure investors. Investors, however, reported that they could not convert their tokens back into New Taiwan dollars as promised, prompting them to file complaints about the alleged fraud.

A local news report disclosed that the losses amounted to approximately 800 million New Taiwan dollars ($24.56 million), a significant increase from earlier estimates of 340 million NT$. These fraudulent activities led to substantial financial losses for over 1200 investors, prompting the Taiwanese prosecutors to recommend prison sentences of at least 20 years for Pan and Lin.

The prosecutors stated that approximately NT$43 million was transferred to Wang, who then invested NT$26 million back into the exchange to artificially boost the token prices. Wang, a high-ranking employee in a law firm, could face a minimum of 12 years behind bars if found guilty of assisting the scheme.

Ace Exchange’s Stance And Response

What’s more, investigations show that Pan and his partners generated at least NT$2.2 billion in revenue from the sale of tokens and other blockchain products. Prosecutors also found that they planned to hide the cash in various locations, using some funds to purchase real estate in Yilan County.

In response to these allegations, Ace Exchange stated that Pan had not been involved in the platform’s day-to-day operations since 2022, distancing itself from his alleged misconduct. The exchange also clarified that its operating conditions remained normal while being in full cooperation with the authorities.

ACE Exchange

Bitcoin Whale Activity Declining – Why A Turnaround Is Important

According to the latest on-chain revelation, the Bitcoin network has been experiencing a steady decline in high-value transactions over the last few weeks. This sluggish activity has been mirrored by the price of the premier cryptocurrency, which has struggled to break out of consolidation throughout the month of April.

In the past week, the Bitcoin price struggled to hold above $67,000 despite touching the level multiple times. The price of BTC has since been in a tumble and is down by more than 2% in the last seven days, according to data from CoinGecko.

Interestingly, the recent on-chain data suggests that this underwhelming price performance might persist for the market leader unless there is a turnaround, especially in terms of network activity.

Can Whale Activity Push BTC Price Beyond $73,000?

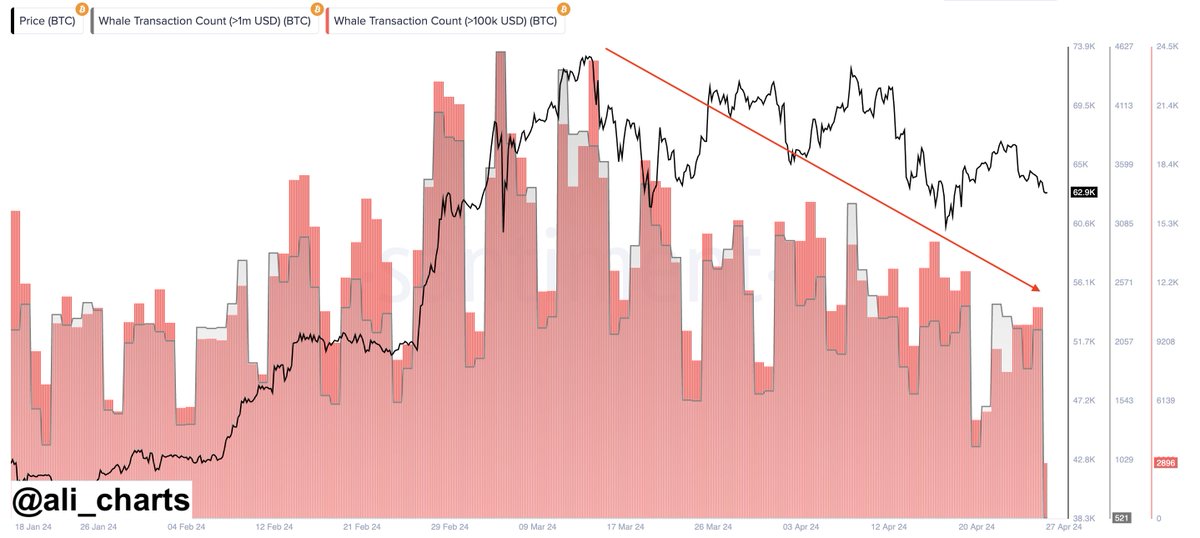
Prominent crypto analyst Ali Martinez took to the X platform to reveal that the Bitcoin whale activity has been declining steadily in the past six weeks. This revelation is based on Santiment’s Whale Transaction Count metric, which tracks the number of BTC transactions worth more than $100,000 and $1 million.

Whales refer to entities or individuals that own substantial amounts of a particular cryptocurrency (Bitcoin, in this case). As such, they hold significant influence over market dynamics due to their capacity to execute large transactions, which can trigger speculation and potential price shifts.

Martinez highlighted in his post that there has been a noticeable decline in Bitcoin whale activity since March 14, the same day the premier cryptocurrency hit a new all-time high price of $73,737. This dip in activity has coincided with the recent underperformance of Bitcoin’s price.

However, the crypto analyst mentioned that an increase in high-value transactions could breathe life into the price of BTC. This is based on the reasoning that a surge in network activity could imply high demand for Bitcoin, leading to elevated prices. 

As shown in the chart below, the peak of the whale transaction count correlates with the new record-high price of BTC.

Bitcoin

Active Bitcoin Wallets On The Rise: Santiment

An interesting piece of on-chain data that may suggest increasing demand for Bitcoin and a bullish future for its price has come to light.  According to Santiment, the number of active Bitcoin wallets is increasing rapidly despite the choppy state of the market.

Active Bitcoin wallets refer to the total number of unique addresses holding BTC. Santiment data shows that the number of these “non-empty BTC wallets” has climbed by more than 2.5% in the last three months.

As of this writing, Bitcoin trades just above $64,000, reflecting a 1.6% price increase in the past day.

Bitcoin

Bitcoin Sell Calls Going Through The Roof: But Is It Really Time To Sell?

The story has not been any much different for Bitcoin, with its price still stuck in a consolidation range in the past week. The sluggishness of the premier cryptocurrency – and the general market – has continued despite the completion of the halving event over a week ago.

The halving event, which saw mining rewards take a significant cut, was expected to usher in another round of bullishness for the Bitcoin price. On the contrary, investors appear to be getting frustrated with the slow activity of the market, with many calling for the dump of BTC.

Bitcoin Sell Calls At Increased Rate: Blockchain Firm

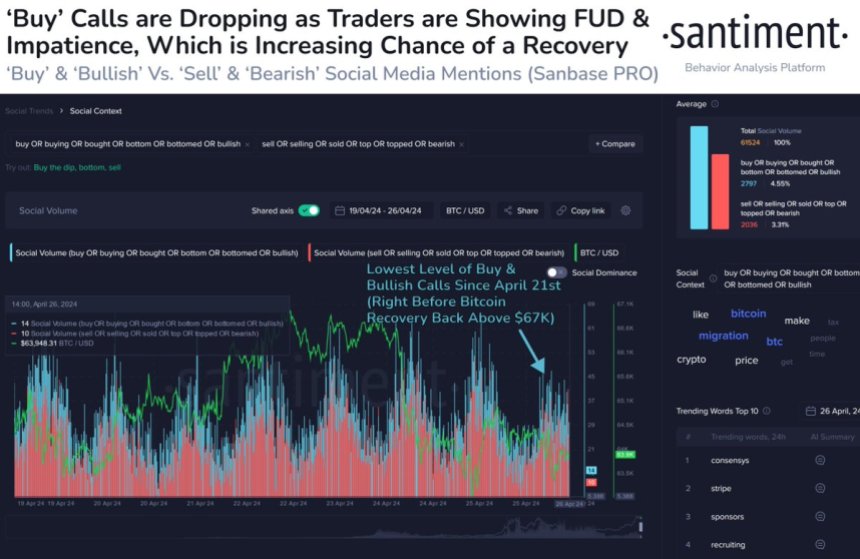
According to a recent report by on-chain analytics firm Santiment, investors are increasingly calling for the sale of Bitcoin across social media following its latest drop toward $63,000. The relevant metric here is the “social volume” indicator, which tracks the number of unique posts and messages on different social platforms that mention a specific topic.

Santiment aggregated data of “buy or bullish”, “sell or bearish,” or related mentions for the premier cryptocurrency over the past week. The on-chain analytics then highlighted a shift in the trend, with the bearish calls looking to drown out the bullish noise on social media.

Bitcoin

According to Santiment, Bitcoin’s recent fall to $63,000 resulted in the lowest level of buy and bullish calls since April 21st (just before BTC recovered back above $67,000). As shown in the chart above, the social volume for terms related to “sell” shot up after the price decline.

Typically, the increased bearish mentions of Bitcoin suggest a rising level of FUD (fear, uncertainty, and doubt) amongst investors. However, when traders seemingly become frustrated and impatient, there is usually a higher probability of a market rebound.

Almost 90% Of Circulating BTC In Profit – Impact On Price

According to recent on-chain data, about 90% of Bitcoin in supply is in profit. On the surface, this basically implies that the most current holders of the premier cryptocurrency bought at a lower price compared to the current price.

However, this level of profitability can also be an overbought signal, especially after bullish periods like the one that occurred between October 2023 and March 2024. Ultimately, this suggests investors could see Bitcoin shed more of its price gains over the next coming weeks.

As of this writing, Bitcoin is valued at $63,077, reflecting a 2% price decline in the past 24 hours.

Bitcoin

Crypto Analyst Sounds Buy Alarm For Dogecoin – Can DOGE Price Reclaim $0.2?

The DOGE price has largely struggled to make a return to $0.2 since losing this price level early in April. And the meme coin has mostly been on a descent over the past few weeks, going as low as $1.4 at some point.

However, the tides appear to be shifting for the Dogecoin investors, with the meme token putting in a positive price performance in the past week. The double-digit gain and optimistic price action over the last seven days haven’t gone unnoticed by experts, as many anticipate a continued bullish run for the DOGE price in the near future.

Is A Price Rally Imminent For Dogecoin?

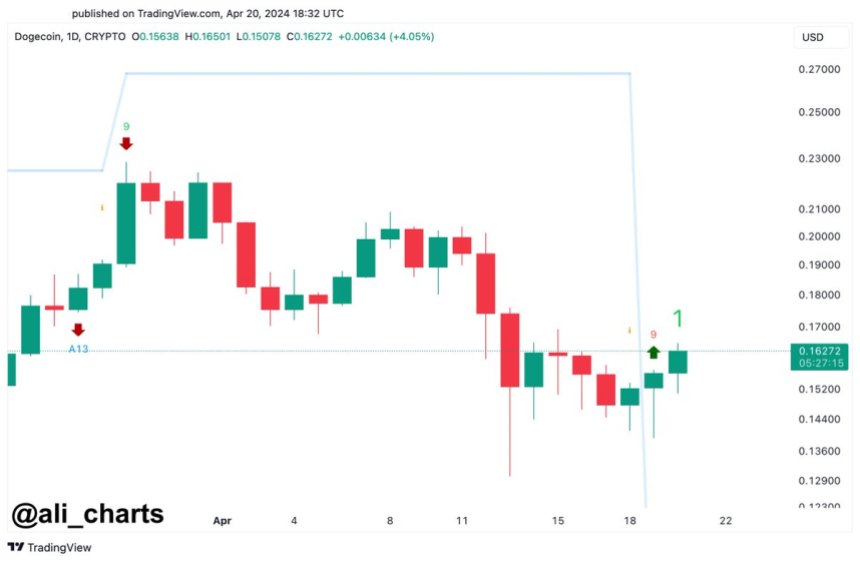
Prominent crypto analyst Ali Martinez took to the X platform to share an interesting analysis and projection for the Dogecoin price. According to the pundit, DOGE’s recent price action is signaling a potential rally to the upside over the coming days.

The reasoning behind this bullish prediction revolves around the TD (Tom Demark) Sequential indicator. Martinez mentioned that this indicator has flashed a buy signal on Dogecoin’s daily chart, suggesting that a price upswing lasting between one to four days might be on the cards.

The Tom Demark Sequential is an indicator in technical analysis used to identify potential points of trend exhaustion and price reversal. Typically, the TD Sequential indicator comprises two major phases known as the “setup” and the “countdown.” 

The setup phase consists of nine consecutive candlesticks depending on whether the token is in a bullish or bearish trend. The countdown phase, on the other hand, consists of 13 consecutive candlesticks, which start immediately after the completion of the “setup.” 

DOGE price

In the chart highlighted above, the DOGE price just completed the nine-candle setup phase, which may be signaling a potential price reversal. Given that this phase was mostly formed by bearish candles, the TD Sequential might be indicating a bottom for Dogecoin’s price.

Ultimately, it is likely that investors will see the DOGE price return to $0.2 if the potential rally produces four consecutive bullish candles. However, they might keep an eye out for the formation of the “countdown” phase.

The completion of the countdown phase on Dogecoin’s daily chart could signal an even stronger and longer-lasting price reversal. This could see the meme token break out of its current bearish trend and gather some momentum for higher price levels.

DOGE Price At A Glance

As of this writing, the DOGE price stands at around $0.1618, reflecting a significant 4.7% increase in the past 24 hours.

DOGE price

Uniswap Resurgence Incoming? Analyst Predicts 30% Surge For UNI Price

Uniswap’s native token, UNI, has been struggling in terms of its price action over the past few weeks. Although the general state of the crypto market may be blamed for this gloomy price performance, other factors, such as the Wells Notice from the US Securities and Exchange Commission (SEC) to the Uniswap protocol, have also played a role.

However, the UNI price appears to be recovering well, as the token has jumped by more than 2% in the past day. A popular crypto pundit on X has predicted that a bullish rally might only just be beginning for the DeFi coin, but the question is – how far can Uniswap’s price go?

Analyst Sets $10 Target For Uniswap Price

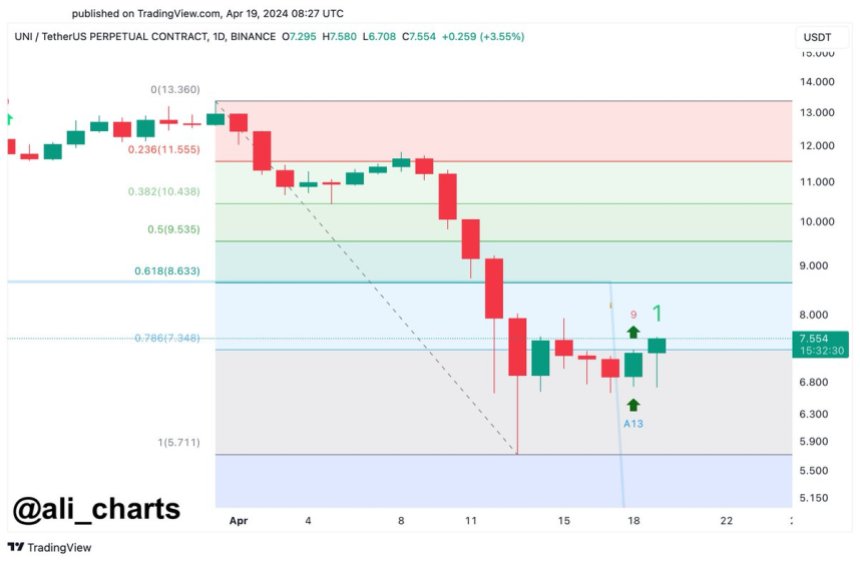
In a recent post on the X platform, prominent crypto analyst Ali Martinez put forward an exciting bullish prediction for the price of UNI. According to the expert, the cryptocurrency might be getting ready for a run to the upside in the coming days.

The rationale behind this bullish prognosis for the Uniswap token is based on the TD (Tom DeMark) Sequential Indicator. The Tom Demark Sequential is an indicator in technical analysis used to identify the probable time and points of trend exhaustion and price reversal.

Uniswap

The TD Sequential indicator consists of two stages, namely the “setup” and the “countdown” phases. As shown in the chart above, UNI’s price just completed the setup phase, which comprises nine consecutive candles that closed lower than the candle four periods ago.

The completion of this phase usually signals a potential trend reversal for the token’s price. The direction of the reversal depends on the type of candles that formed the “setup” (I.e., red candles would suggest a bottom for the asset, while green candles would imply a top).

Martinez noted in his post that the TD Sequential has flashed a buy alarm on the UNI daily chart, and the token might be “gearing up for a 1 – 4-day rally. According to the analyst, the DeFi coin could jump as high as $10, representing an over 31% surge from the current price point.

UNI Price Overview

As of this writing, the price of UNI stands at around $7.46, reflecting a 2% jump in the past 24 hours. However, this latest price increase is not enough to bring the coin to profit on the weekly timeframe.

According to CoinGecko’s data, Uniswap’s price is down by more than 4% in the past seven days. The cryptocurrency would look to regain the $10 level, having lost it due to the news of the SEC’s looming action. 

Uniswap

DOGE Price Set For Rebound? Whale Moves $26 Million In Dogecoin Off Robinhood

The price of Dogecoin has been experiencing a significant amount of bearish pressure in the past few days. This recent decline coincides with a general market downturn, which has seen other large-cap assets like Bitcoin and Ethereum tumble with notable losses.

However, the meme coin’s price might not be down for too long, especially after a major investor executed a massive transaction off a centralized exchange. The transfer, which an on-chain data tracker flagged, has sparked speculations in the DOGE community and could be bullish for the meme coin’s price.

Whale Transfers 150 Million Dogecoin From Robinhood

According to data from blockchain transaction tracker Whale Alert, a substantial amount of Dogecoin has made its way off the Robinhood exchange. In the past day, an outgoing transfer of 150 million DOGE tokens, equivalent to more than $26 million, from the crypto trading platform was spotted on the Dogecoin blockchain.

Given the magnitude of this transaction, it appears that a whale was behind this movement of funds. Whales refer to influential entities or individuals that own or hold significant amounts of a particular cryptocurrency in their wallets (Dogecoin, in this case).

Whales are often perceived as major players in the crypto market, as their buying and selling activities can have a substantial impact on a token’s price. As such, their actions can be worth keeping an eye on, especially as they can lead to speculations and potential market shifts.

This particular transfer, where the Dogecoin whale moved their tokens from an exchange wallet to a self-custodial wallet, is known as an “exchange outflow.” Typically, investors move their assets off trading platforms when they intend to hold onto their coins in the long term, indicating their faith in the future promise of the crypto.

Additionally, the movement of funds off exchanges can sometimes be a signal of fresh accumulation, as some investors prefer to withdraw their tokens immediately after purchase. All in all, considering the large-scale nature of the transfer, the latest movement of Dogecoin tokens off Robinhood might be a bullish proponent for the meme coin’s price.

Meme Coins Facing Turmoil?

As of this writing, the Dogecoin price stands at around $0.1496, reflecting a notable 12% decline in the last 24 hours. The largest meme coin is down by close to 20% on the weekly timeframe, according to CoinGecko data.

However, Dogecoin is not the only meme token to have witnessed this massive downturn in price, as other coins also posted double-digit percentage losses. Notably, the second-largest meme coin, Shiba Inu, is also deep in the red, with an almost 14% price drop in the past day.

Dogecoin

Waiting For The Bitcoin Bull Run To Resume? Here’s The Indicator To Watch For

The bullish momentum of the Bitcoin price has dwindled over the past few weeks, putting the progression of the crypto bull cycle into question. On Friday, April 12, the crypto market witnessed a flash crash, causing the premier cryptocurrency’s value to drop from $70,000 to below $67,000.

This latest downturn underscores the struggle of the Bitcoin price to return to its recent all-time high of $73,737, which was forged in mid-March. On-chain analytics platform Santiment has identified a particular Bitcoin metric that may signal the resumption of the bull run.

Bitcoin Bull Run May Resume If This Metric Falls

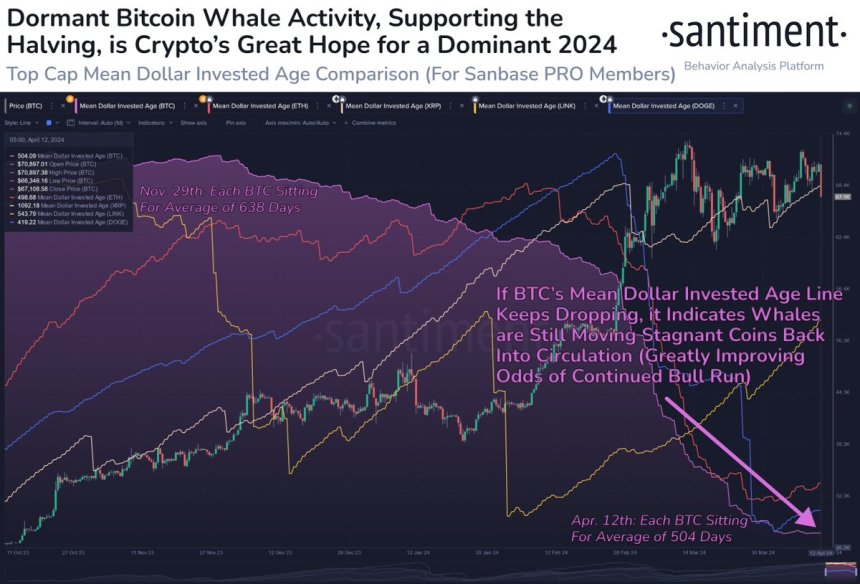
In a recent post on X, blockchain intelligence firm Santiment provided an exciting insight into the current cycle and the price performance of Bitcoin. The firm pinpointed the Mean Dollar Invested Age metric as one of the indicators to watch as the market leader moves sideways.

According to Santiment, the Mean Dollar Invested Age metric tracks the average age of investment in an asset that has sat in the same wallet. When this indicator is rising, it means that investments are getting more stagnant and old coins are being held in the same wallets.

Conversely, a decreasing Mean Dollar Invested Age metric implies that investments are flowing back into regular circulation. This “falling line” also suggests an increase in network activity.  

Bitcoin

From a historical perspective, Bitcoin exhibited a falling Mean Dollar Invested Age line during the previous bull cycles. According to Santiment, this has been the case for the premier cryptocurrency in the current bull run, which kicked off in late October 2023. 

The on-chain analytics platform, however, noted that Bitcoin’s Mean Dollar Invested Age line has been moving sideways over the past couple of weeks. This phenomenon is even more shocking, considering that the highly-anticipated halving event is about a week away.

The Bitcoin halving will see the miners’ reward slashed in half (from 6.25 BTC to 3.125 BTC). It is a bullish event that has contributed to the optimistic outlook – borne by most investors – for the premier cryptocurrency in 2024.

From Santiment’s latest report, investors might want to keep their eyes peeled for the Bitcoin Mean Dollar Invested Age metric. And the bull run is likely to continue if the BTC’s Mean Dollar Invested Age line resumes its fall, which would imply that major stakeholders (like whales) are back to moving coins into regular circulation.

BTC Price At A Glance

As of this writing, Bitcoin is trading around $66,548, reflecting a notable 6% price decline in the past 24 hours.

Bitcoin

111,000 BTC Move Out Of Exchange Wallets In A Month – Impact On Bitcoin Price?

The Bitcoin price has somewhat slowed down since reaching the unprecedented high of $73,000, moving mostly sideways since mid-March. However, with the halving event less than a fortnight away, all eyes will be on the premier cryptocurrency and all that pertains to it over the next couple of weeks.

According to a recent on-chain observation, the BTC supply on exchanges has been on a steady decline over the past few months. This trend has sparked discussions on what this could mean for the Bitcoin price, both in the short and long term.

$7.55 Billion Transferred Out Of Exchange Wallets In The Past Month

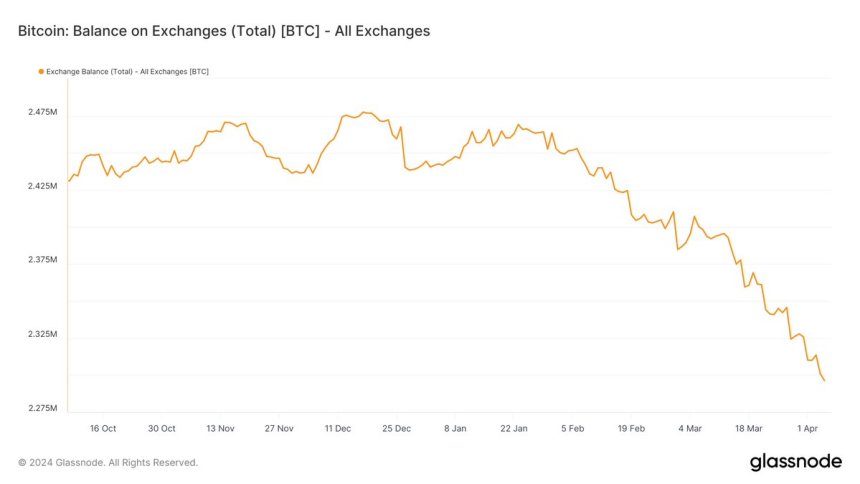
Prominent crypto pundit Ali Martinez took to the X platform to share that a significant amount of Bitcoin has been moved out of crypto exchanges over the past month. The relevant metric here is Glassnode’s Balance on Exchanges, which tracks the total amount of a cryptocurrency (Bitcoin, in this case) held across all exchange addresses.

A decrease in the value of this indicator implies that investors are making more withdrawals than deposits of Bitcoin into centralized exchanges. The metric’s increase, on the other hand, indicates that more BTC is flowing into these exchanges than leaving.

Bitcoin price

According to Martinez, about 111,000 BTC (worth approximately $7.55 billion) have been transferred out of known crypto exchange wallets in the past month. Typically, an exodus of funds (of this magnitude) suggests a significant shift in the sentiment of Bitcoin investors.

While the exact rationale behind such a massive movement of Bitcoin remains unclear, the flow of funds from trading platforms suggests a growth in investor confidence. This implies that BTC owners are more interested in holding their assets in the long term rather than selling for short-term gains.

Furthermore, this continuous downward trend in BTC’s balance on exchanges could set the stage for a bullish rally for the Bitcoin price. A sustained drop in the BTC’s supply on centralized exchanges could result in a supply crunch – a scenario where the supply of a particular asset is lower than its demand, leading to a surge in its value. 

Another potential bullish catalyst for the Bitcoin price is the upcoming halving event, which is expected to occur on April 18, 2024. With the miners’ rewards slashed in half and the production of Bitcoin slowed, this event is expected to impact the value of BTC positively.

Bitcoin Price At A Glance

As of this writing, the Bitcoin price stands at around $69,537, reflecting a 2.7% increase in the last 24 hours.

Bitcoin price

Cardano Price In Turmoil: Can Whales Drive ADA’s Resurrection From Recent Dump?

The Cardano price has been facing a significant amount of bearish pressure over the past week, declining by more than 12%. This recent fall coincides with a broader crypto market downturn, with other major altcoins suffering huge losses over the past week.

Specifically, Cardano’s price decline has been largely linked to the recent sell-off of all ADA holdings by the Grayscale Digital Large Cap Fund (GDLC). On Thursday, April 4, the fund disclosed its decision to rebalance its portfolio by liquidating its Cardano assets (about 1.6% of the entire holdings).

Registering such a negative start to April after an underwhelming performance in March doesn’t do well to dispel the increasing concerns of investors. Moreover, the latest on-chain data suggests that the Cardano price might continue to succumb to the bearish pressure.

Analyst Predicts ADA Price Slump As Whale Activity Slows Down

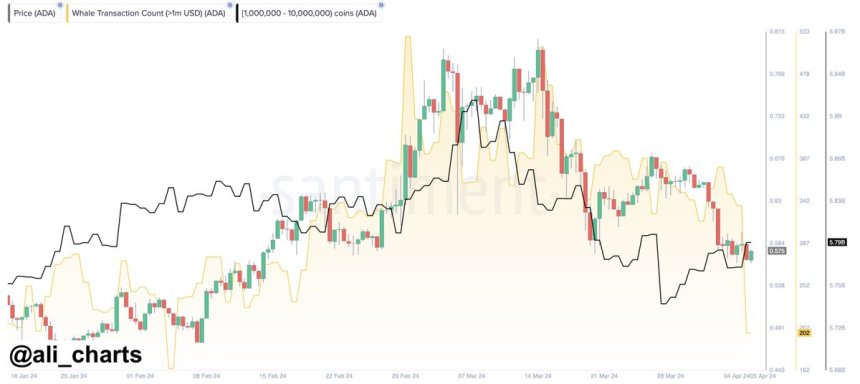
Popular crypto pundit Ali Martinez has shared a post on X that Cardano whales have been making fewer moves in the market in recent days. This revelation is based on Santiment’s Whale Transaction Count metric, which tracks the number of ADA transactions worth more than $1 million.

Whales refer to entities or individuals that own significant amounts of a particular cryptocurrency (Cardano, in this case). They are often viewed as key players in the market, as their buying or selling activities can have a significant impact on the Cardano price, leading to speculation and potential market shifts.

According to Martinez, the on-chain data shows that there has been a noticeable dip in the activity of Cardano whales, suggesting a possible decline in significant ADA transactions. In an almost vertical move, the whale transaction count dropped from around 400 daily transactions at the beginning of last week to 200 daily transactions by Friday, April 5.

Cardano Price

The crypto analyst mentioned that the recent downturn in whale activity could be a signal for “further price consolidation” or an imminent decline in the Cardano price. A loss of substantial buying activity from large investors can cause the cryptocurrency to succumb to bearish pressure, especially from small traders looking to take some profit.

Indeed, the Cardano token has made a positive start to the year, reaching a high of $0.8 in early March. However, the altcoin has been on a downward trend since hitting the 2024 peak – collapsing under the pressure of Bitcoin’s price decline.

Cardano Price At A Glance

As of this writing, the Cardano price stands at around $0.577, reflecting a 1% decline in the past 24 hours.

Cardano Price

Featured image from iStock, chart from TradingView

Dogecoin Open Interest Hits Record $2.2 Billion – What’s Next For DOGE Price?

The Dogecoin open interest has been on the rise over the past few weeks, breaking and setting new all-time highs twice this March. Unsurprisingly, the price of the meme coin has been reflecting the growth seen by its open interest.

This recent bullish momentum pushed the price of DOGE to break the $0.22 mark, its highest point in three years. However, the question is – how far can this rally go for the foremost meme token?

Dogecoin Open Interest Breaks Above $2 Billion

According to data from CoinGlass, the Dogecoin open interest broke through the $2 billion mark on Friday, March 29. Although DOGE’s open interest stands at around 1.96 billion at press time, it rose as high as $2.21 billion on Friday, a new record for the meme coin.

Open interest is a metric that measures the total number of futures or options contracts of a particular cryptocurrency (Dogecoin, in this case) in the market at a given time. It provides insight into the amount of money investors are pouring into DOGE derivatives at this time.

The meme token’s open interest has had quite a performance since the start of March. DOGE’s open interest rose to $1.6 billion (an all-time high at the time) earlier in the month before retracing to below $1 billion by March 20.

It is worth noting that there has been a high correlation between open interest and Dogecoin’s price, with both climbing at the same time and at almost the same pace. Typically, a rising open interest can suggest a continuation of the trend around the asset’s price at the moment.

Ultimately, the current high open interest for DOGE could mean a rapid price movement for the meme coin in the near future. However, it would be difficult to tell the direction in which this spurt of volatility would take the price of Dogecoin, especially as open interest is not the most optimal indicator of trends or price action.

DOGE Price Overview

As of this writing, the Dogecoin price stands at $0.204, reflecting a 4.6% decline in the last 24 hours. While the meme token’s price has somewhat struggled since hitting the three-year high, it has managed to retain most of its profit from the past week.

According to CoinGecko data, the Dogecoin price is up by a whopping 18% in the past seven days. This positive performance has strengthened DOGE’s position as the largest meme coin in the market, with a market capitalization of $29 billion.

Dogecoin

Can This Bullish Chart Pattern Propel Bitcoin Price To $75,000?

The Bitcoin price has experienced a notable resurgence over the past week, drawing parallels to the optimism often associated with Holy Week among Christians. This renewed momentum has infused the entire market, leading to significant profits for other major cryptocurrencies in the last seven days.

The resurgence of the Bitcoin price seems to be at its nascent phase, with a popular crypto pundit on the X forecasting a bullish trajectory for the premier cryptocurrency over the coming days.

Bitcoin Price To Reach $75,000?

In a recent post on the X platform, Ali Martinez put forward an optimistic prediction for the price of Bitcoin. According to the crypto analyst, the premier cryptocurrency’s current price action indicates that BTC might be ready for another run to the upside.

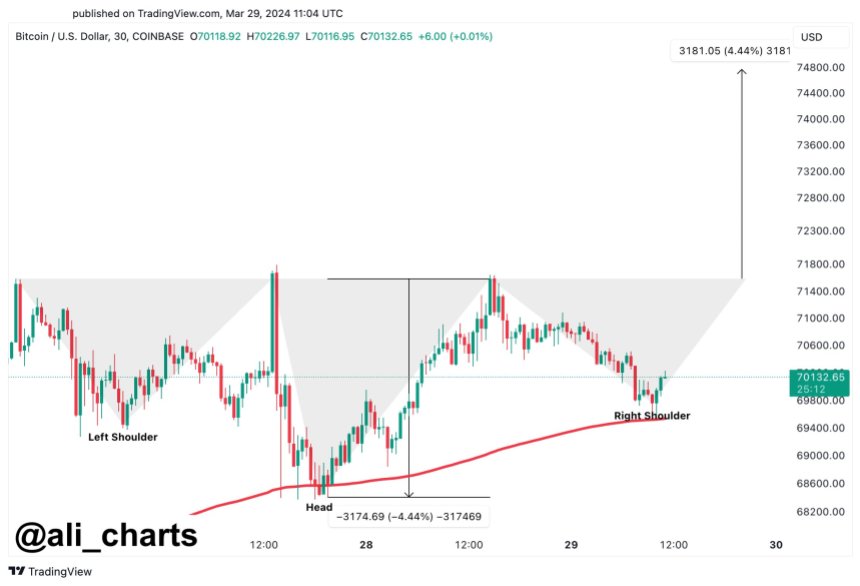
This bullish prediction is based on the formation of an inverse head-and-shoulders chart pattern in the 30-minute timeframe. Considering the short timeframe, this projection, if it comes true, will likely play out over the next few days.

Typically, a head-and-shoulders price pattern signals a bullish-to-bearish trend reversal and indicates that an upward trend might be coming to an end. In contrast, the inverse head-and-shoulders chart formation suggests the possible reversal of a downward trend, with potential bullish movement on the horizon.

Bitcoin Price

According to the highlighted chart above, the Bitcoin price is currently following a trend above the 200 exponential moving average (EMA). If the coin maintains its position above this moving average and manages to cross the neckline resistance at $71,580, Martinez expects the price of BTC to move further upward toward $74,760.

This almost $75,000  target would be a new all-time high for the Bitcoin price and an almost 5% move from the current price point. The current record-high price for BTC stands at around $73,700, which was set a little over two weeks ago.

BTC Price Overview

As of this writing, Bitcoin is valued at $69,875, reflecting a 0.7% price decline in the past day. While the premier cryptocurrency is back below the $70,000 level, this slight dip is not substantial enough to erase its profit over the past week.

According to data from CoinGecko, the Bitcoin price is up by nearly 10% in the last seven days. After climbing as high as $71,500 earlier in the week, BTC now trails its all-time high price by about 5%.

Nevertheless, Bitcoin still maintains its position as the largest cryptocurrency in the sector, with a market capitalization of over $1.37 trillion.

Bitcoin price

Bitcoin Addresses Add $1.6 Billion In BTC In A Single Day – Price Recovery Soon?

The price performance of Bitcoin over the past week has been a source of concern for the majority of the crypto community. This has pretty much been the case for other cryptocurrencies in the market, with several large-cap tokens reversing their recently-accrued profits.

However, some investors are treating the recent price decline as a rare opportunity in the bull market as they continue to load their bags with assets of their choice. Specifically, the latest on-chain data shows significant buying activity amongst a certain class of investors. 

25,000 BTC Flow Into Accumulation Addresses In One Day

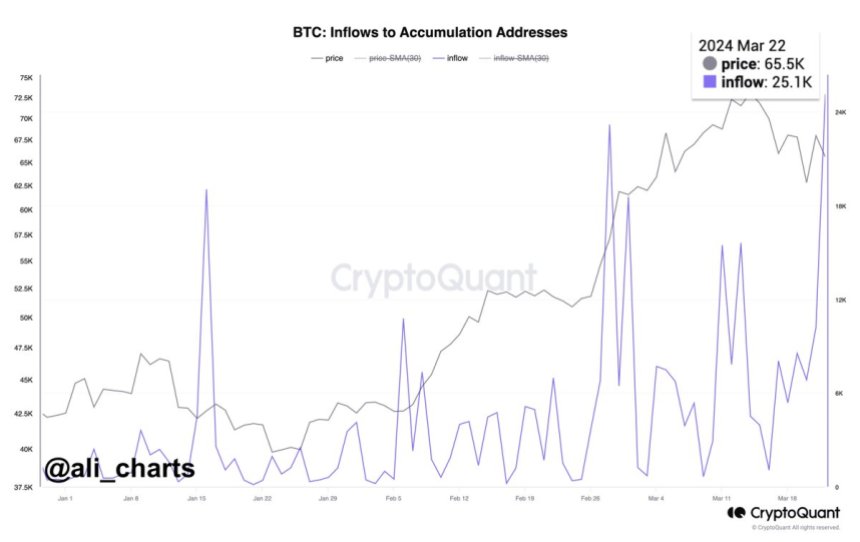
Prominent crypto pundit Ali Martinez revealed, via a post on X, that more than 25,000 BTC (valued at approximately $1.6 billion) was moved to accumulation addresses on Friday, March 22. This figure represents the highest amount transferred to these wallets in a single day so far in 2023.

The metric of interest here is the Inflow to Accumulation Addresses on the Bitcoin blockchain. For context, a Bitcoin accumulation address refers to an address that has zero outgoing transactions and maintains a balance of at least 10 BTC.

Bitcoin

This classification, however, excludes digital wallets linked to centralized exchanges and miners and has less than 2 non-dust incoming transfers. Also, it doesn’t include addresses that have not seen any activity in more than seven years.

The increased flow of coins into this class of wallet addresses is evidence of substantial BTC accumulation by entities who view the crypto as a long-term investment. It signals that certain big-money players are amassing Bitcoin in anticipation of potential value appreciation.

What’s more, this significant acquisition by long-term investors emphasizes the increasing adoption of Bitcoin as a store of value. Meanwhile, it might be an indicator of bullish price movement in the short term. 

Bitcoin Price Overview

As of this writing, Bitcoin is valued at $64,636, reflecting a mere 1% price increase in the past 24 hours. This price change is somewhat negligible, considering the deep retracement of the premier cryptocurrency earlier in the week.

According to data from CoinGecko, the price of BTC is down by 2.4% over the past week. Meanwhile, the market leader is currently about 13% from its record high of $73,798.

However, it has been an overall positive performance for the Bitcoin price in March, having surpassed this previous all-time high of $69,000 a little over a week ago. And, with a market cap of $1.26 trillion, BTC retains its position as the largest cryptocurrency in the sector.

Bitcoin

March Sees Nearly $1 Billion In Ethereum Netflow To Centralized Exchanges – What’s Happening?

The price of Ethereum has not exactly lived up to its promise as the month has gone on, despite a stellar start to the month. While this bearish pressure has been widespread in the general cryptocurrency market, regulation uncertainty has been an additional concern for ETH, igniting a negative sentiment around the “king of altcoins.”

Interestingly, the latest on-chain revelation shows a substantial amount of Ethereum has made its way to exchanges so far in March, suggesting that investors might be losing confidence in the long-term promise of the cryptocurrency.

Are Investors Losing Confidence In Ethereum?

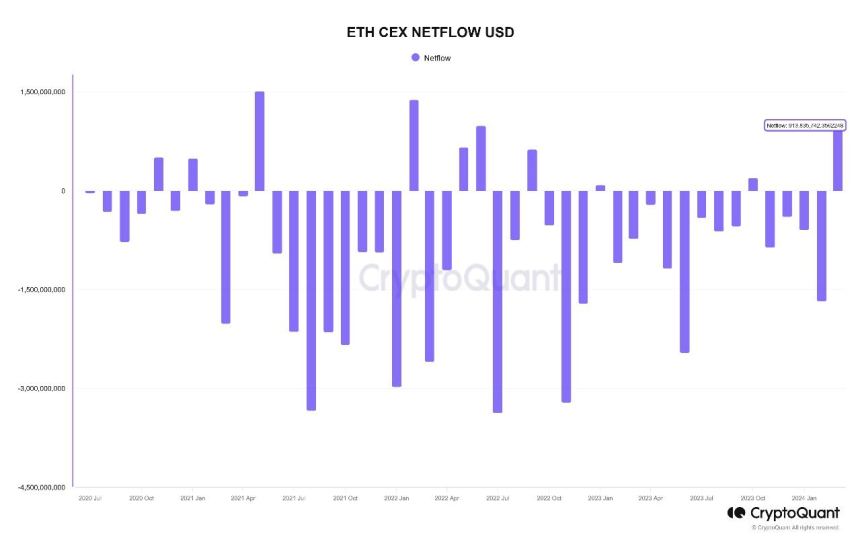
According to data from CryptoQuant, more than $913 million has been recorded in net ETH transfers to centralized exchanges so far in March. This on-chain information was revealed via a quicktake post on the data analytics platform.

This net fund movement represents the largest volume of Ethereum transferred to centralized exchanges in a single month since June 2022. Even though March is still a week from being over, this exchange inflow appears to be a complete deviation from the pattern observed over the past few months.

Ethereum

As shown in the chart above, October 2023 was the last time cryptocurrency exchanges witnessed a positive net flow. It is worth noting that there was significant movement of Ethereum tokens out of the centralized platforms in subsequent months up until this month.

Meanwhile, a separate data point that supports the massive exodus of ETH to centralized exchanges has come to light. Popular crypto analyst Ali Martinez revealed on X nearly 420,000 Ethereum tokens (equivalent to $1.47 billion) have been transferred to cryptocurrency exchanges in the past three weeks.

The flow of large amounts of cryptocurrency to centralized exchanges is often considered a bearish sign, as it can be an indication that investors may be willing to sell their assets. Ultimately, this can put downward pressure on the cryptocurrency’s price.

Substantial fund movements to trading platforms could also represent a shift in investor sentiment. It could be a sign that investors are losing faith in a particular asset (ETH, in this case).

Moreover, the recent regulatory headwind surrounding Ethereum specifically accentuates this hypothesis.  According to the latest report, the United States Securities and Exchange Commission is considering a probe to classify the ETH token as a security.

ETH Price

As of this writing, the Ethereum token is valued at $3,343, reflecting a 4% price decline over the past /4 hours. According to data from CoinGecko, ETH is down by 11% in the past week.

Ethereum

MATIC Price Slumps 10% Amidst Market Downturn – Here Are Key Levels To Watch

MATIC, the native token of the Polygon network, has witnessed a significant decline in its value. It has fallen by more than 10% in the past week and 8% in less than 24 hours as the general cryptocurrency market continues to grapple with a cloud of negative sentiment.

Fortunately, the latest on-chain analysis has revealed the important levels that investors should look out for following the latest decline in the MATIC price.

Over 10,900 Addresses Bought 600 Million Polygon Tokens At This Price

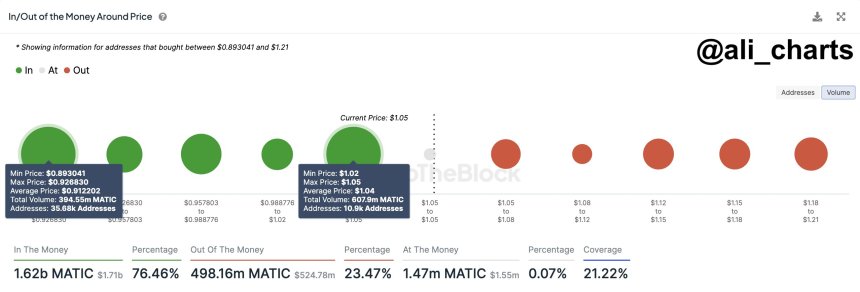
According to a recent post on X by crypto pundit Ali Martinez, the price of MATIC has established a key support around its current price point. This evaluation is based on analytics firm IntoTheBlock’s on-chain data, which tracks the average acquisition price for any given wallet address.

MATIC


Above is the chart highlighted by Martinez that shows the distribution of the Polygon token supply across various price ranges. The size of the dots in the chart represents the magnitude of coins purchased around the corresponding price range.

Most notably, over 10,900 wallet addresses bought a whopping 608 million MATIC around the $1.02 and $1.05 zone. According to the crypto analyst, this massive buying activity has supported the establishment of crucial support around this price region.

While the large size of the dot reflects the strength of this particular level, sustained bearish pressure could cause the price of MATIC to breach and fall beneath this support. In this case, investors could see the cryptocurrency drop to around $0.91.

This makes the $0.89 and $0.92 price range another level to watch, as it represents the next vital support area, where 35,680 wallet addresses purchased nearly 400 million Polygon tokens.

MATIC Price Overview

As of this writing, the price of MATIC stands at $1.04, reflecting an 8% decline in the past 24 hours. This price dip comes after the altcoin printed a multi-month high of $1.28 on Thursday, March 14.

According to data from CoinGecko, the Polygon coin has suffered a 9.7% price slump in the last seven days. From a broader perspective, though, the cryptocurrency has had a fairly positive performance in the past month.

With a market capitalization of more than $9.7 billion, the MATIC token ranks as the 18th-largest cryptocurrency in the sector.

MATIC

Grayscale Submits Revised Application For Ethereum Spot ETF – What’s New?

Asset management firm Grayscale Investments has updated its application for an Ethereum spot ETF (exchange-traded fund) with the United States Securities and Exchange Commission (SEC).

Ethereum Spot ETF Case Just As Solid As Bitcoin’s, Grayscale Argues

According to a recent post on X by Craig Salm, Grayscale’s chief legal officer, the asset management firm has revised its 19b-4 form for an Ether spot ETF. Salm claimed that this move was “important” in an effort for Grayscale to list and trade shares of its Ether Trust on the New York Stock Exchange (NYSE) Arca.

The chief legal officer stated in his post that investors “want and deserve access” to Ethereum via a spot exchange-traded product, likening the situation to the Bitcoin ETF story. “We believe the case is just as strong as it was for spot Bitcoin ETFs,” Salm said.

The asset manager is amongst the numerous firms looking to issue the first Ethereum spot ETF in the United States, having filed an application with the SEC on October 10, 2023. However, these ETF applications have faced delays multiple times, with the most recent coming against BlackRock’s filing on March 4, 2024.

As a result, the likelihood of the SEC approving an Ethereum spot ETF has taken a nosedive in recent weeks. Once-optimistic Bloomberg ETF expert Balchunas even revealed in his latest analysis that the ETH funds now have only a 35% chance of approval.

SEC Chairman Faces Pressure Over Crypto Approval

Two US senators of the Democrat party, Sens. Laphonza Butler of California and Jack Reed of Rhode Island, have urged the SEC chairman to avoid approving crypto investment products. In a letter dated March 11, the lawmakers, who are also members of the Senate Banking Committee, asked the Commission to limit future crypto ETF applications.

Following the approval of 11 Bitcoin spot ETFs in January, the attention of the crypto public has somewhat turned to whether the SEC will do the same for the Ethereum versions. However, this latest letter from the senate seems to further hurt the chances of an ETH ETF approval.

A part of the letter read:

Retail investors would face enormous risks from ETPs referencing thinly traded cryptocurrencies or cryptocurrencies whose prices are especially susceptible to pump-and-dump or other fraudulent schemes,” they said. “The Commission is under no obligation to approve such products, and given the risk, it should not do so.

As of this writing, the price of the Ethereum token stands at $3,731, reflecting a 1.2% increase in the past day.

Grayscale

800,000 ETH Flow Out Of Centralized Exchanges In 2024 – Bullish Sign For Ethereum Price?

The price of Ethereum has been a joy to watch since the start of 2024, climbing by more than 30% in less than two months. The latest on-chain revelation suggests that ETH investors are approaching the market with more confidence, as the cryptocurrency’s price rally seems to be far from over.

$2.4 Billion Worth Of ETH Leaves Exchanges: CryptoQuant

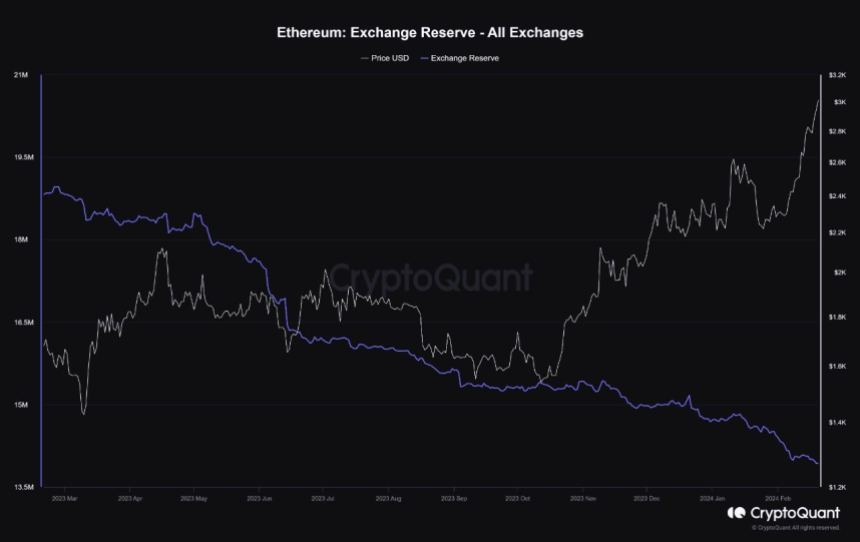
A pseudonymous analyst on CryptoQuant’s Quicktake revealed that significant amounts of the Ethereum token have been making their way out of exchanges in the last few weeks. This observation is based on the “Exchange Reserve” metric, which tracks the amount of ETH tokens in the wallets of all centralized exchanges.

When the value of this metric increases, it implies that investors are making more deposits than withdrawals of an asset (Ether, in this case) into centralized exchanges. Meanwhile, the metric’s decline means that more assets are flowing out than entering these platforms.

According to data from CryptoQuant, more than 800,000 ETH (equivalent to approximately $2.4 billion) has flowed out of cryptocurrency exchanges since the turn of the year. Typically, the movement of significant amounts of cryptocurrencies out of these platforms suggests a rise in investor confidence.

Ethereum

As the CryptoQuant Quicktake author noted, this reduction in Ether’s exchange reserve balance could be a bullish catalyst for the altcoin’s price. A sustained decline in the ETH’s supply on exchanges could trigger a supply crunch, potentially driving the Ethereum price higher.

As of this writing, the Ethereum price stands at around $2,920, reflecting a 1.8% decline in the past day. Nevertheless, the “king of altcoins” is still in the green on the weekly timeframe, with an almost 5% price jump over the last week.

Ethereum Price Rise Due To Anticipation Of Dencun Upgrade: Grayscale

In a recent report, Grayscale has offered commentary on Ethereum’s positive price performance so far in 2024. The asset management firm tied ETH’s bullish trajectory to the upcoming Dencun upgrade of the Ethereum network.

William Ogden Moore, Grayscale’s research analyst, wrote in the report:

We believe that recent price performance reflects the market’s anticipation of this upgrade, as Ethereum (up 26% YTD) has outperformed the broader Smart Contract Platforms Sector (up 3% YTD) since January 1st, 2024.

The Dencun upgrade, which is less than a month away, will aim to enhance Ethereum in terms of scalability and cost-effectiveness. It is also expected to help the network compete with “faster chains in the Smart Contract Platforms Crypto Sector, such as Solana.”

Another narrative that may be propelling the price of ETH is the approval of Ethereum spot exchange-traded funds (ETFs) in the United States. Interestingly, Grayscale is amongst the asset managers looking to debut an Ether spot ETF.

Ethereum

Is Bitcoin Price Facing A Correction To $46,000? Here’s What This Analyst Thinks

Over the past week, the Bitcoin price put in one of its finest performances since the start of 2024, breaking above $50,000 for the first time since 2021. While the premier cryptocurrency has been moving mostly sideways in the past few days, it continues to hold its own above the $51,000 mark.

However, a popular crypto analyst on the X platform has put forward an interesting prognosis for the Bitcoin price, stating that the coin might experience some bearish pressure in the near future.

Is BTC Headed To $46,000?

On Thursday, February 15, prominent crypto analyst Ali Martinez sounded the sell alarm – based on the Tom Demark Sequential indicator – for Bitcoin. According to the analyst, investors should anticipate a one-to-four candlesticks correction on BTC’s daily chart in the coming days.

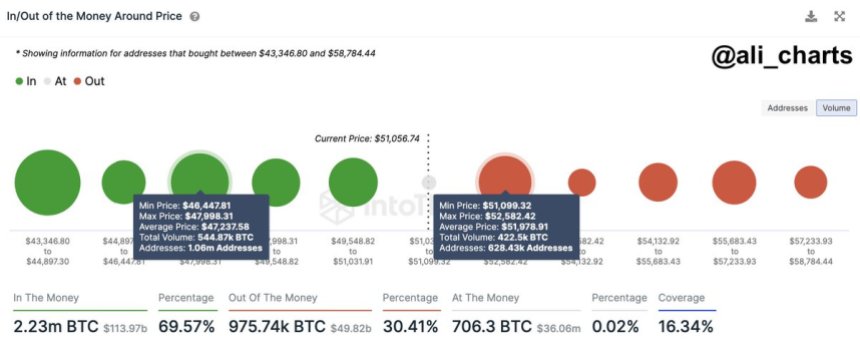
Ali Martinez took to the X platform on Saturday, February 17, to share an in-depth analysis of an impending correction for the Bitcoin price. This evaluation is based on the distribution of holders’ cost basis across the various BTC price zones near the current price of the cryptocurrency.

With this on-chain indicator, the strength of any resistance or support level depends on the number of coins acquired by investors within the price range. And this strength is portrayed by how large or small the circles (representing the price ranges) are.

Bitcoin price

As shown in the chart above, the price of Bitcoin seems to be facing significant resistance between $51,099 and $52,582. Recognizing this pattern, Martinez said in his post that if the flagship cryptocurrency fails to reclaim the $52,000 level, then it is at risk of an 8% price correction. 

An 8% decline from the current point would see the Bitcoin price drop to between the $48,000 and $46,500 zone. According to the on-chain resistance data, more than 1 million addresses bought 544,870 BTC within this range, making it a significant support level.

Bitcoin Price Overview

As of this writing, the Bitcoin price stands at around $51,650, reflecting an almost 0.9% dip in the past 24 hours. Despite the recent bearish pressure slowing down its momentum, the market leader has maintained most of its profit from the past week.

According to data from CoinGecko, Bitcoin’s value has jumped by more than 8% in the last seven days. Meanwhile, the cryptocurrency has registered over 20% growth so far in the month of February.

Thanks to the recent price rise, BTC surpassed the $1 trillion mark in terms of market capitalization, solidifying its position as the largest asset in the cryptocurrency sector.

Bitcoin price

Bitcoin Bull Run: On-Chain Data Points To Declining Retail Participation

The price of Bitcoin has continued to soar this week, with the premier cryptocurrency consolidating its place above the $50,000 mark. Interestingly, on-chain data shows that a particular class of investors had less to do about the recent rally, sparking conversations about their participation in the current bull cycle.

Recent BTC Price Primarily Fueled By ‘Institutional Demand’

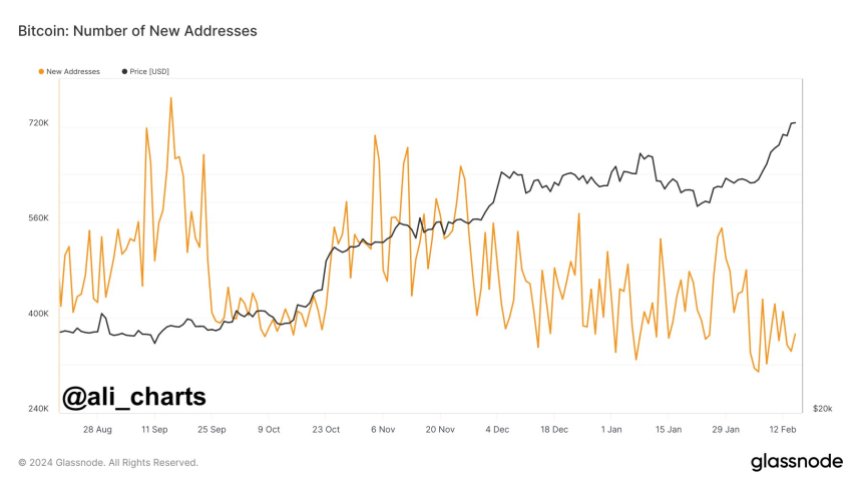
In a recent post on X, analyst Ali Martinez pointed out that there has been an apparent decline in the involvement of retail investors in the Bitcoin market. This shift comes despite the recent surge in the flagship cryptocurrency’s price.

This revelation is based on the noticeable fall in the daily creation of new Bitcoin addresses. According to the crypto intelligence platform Glassnode, this metric tracks the number of unique addresses that appeared for the first time in a transaction of the native coin in the network.

Bitcoin

Typically, more individuals are inclined to enter the market as the value of Bitcoin increases, often resulting in a spike in new addresses to store and transact the coin. However, there is currently a deviation between the BTC price and the creation of new addresses.

According to Martinez, this curious trend suggests a lack of retail participation in the ongoing Bitcoin bull run. The crypto analyst, however, tied the flagship cryptocurrency’s recent positive performance to institutional players’ activity.

This analysis seems to hold some weight, considering it’s been a little over a month since the Securities and Exchange Commission approved the trading of spot BTC exchange-traded funds in the United States. These investment products are issued and managed by some of the world’s largest financial companies, including BlackRock, Grayscale, Fidelity, and so on.

Bitcoin Whales Show Highest Activity Since 2022

Another on-chain revelation that somewhat supports the argument of increased institutional participation has emerged. According to analytics platform Santiment, BTC whale activity has been heating up lately, reaching its highest level in over 20 months.

Data from Santiment shows that wallets with 1,000 – 10,000 BTC are on an accumulation spree, adding roughly 249,000 coins (worth about $12.8 billion) in 2024 only. However, it is worth mentioning that a lower tier of investors (100 – 1,000 BTC) has sold more than 151,000 Bitcoin since the year started.

As of this writing, Bitcoin is valued at $51,950, reflecting a 0.6% decline in the past day. Nonetheless, the premier cryptocurrency has retained most of its weekly profit, having gained almost 10% in the last seven days.

Bitcoin