Grayscale Submits Revised Application For Ethereum Spot ETF – What’s New?

Asset management firm Grayscale Investments has updated its application for an Ethereum spot ETF (exchange-traded fund) with the United States Securities and Exchange Commission (SEC).

Ethereum Spot ETF Case Just As Solid As Bitcoin’s, Grayscale Argues

According to a recent post on X by Craig Salm, Grayscale’s chief legal officer, the asset management firm has revised its 19b-4 form for an Ether spot ETF. Salm claimed that this move was “important” in an effort for Grayscale to list and trade shares of its Ether Trust on the New York Stock Exchange (NYSE) Arca.

The chief legal officer stated in his post that investors “want and deserve access” to Ethereum via a spot exchange-traded product, likening the situation to the Bitcoin ETF story. “We believe the case is just as strong as it was for spot Bitcoin ETFs,” Salm said.

The asset manager is amongst the numerous firms looking to issue the first Ethereum spot ETF in the United States, having filed an application with the SEC on October 10, 2023. However, these ETF applications have faced delays multiple times, with the most recent coming against BlackRock’s filing on March 4, 2024.

As a result, the likelihood of the SEC approving an Ethereum spot ETF has taken a nosedive in recent weeks. Once-optimistic Bloomberg ETF expert Balchunas even revealed in his latest analysis that the ETH funds now have only a 35% chance of approval.

SEC Chairman Faces Pressure Over Crypto Approval

Two US senators of the Democrat party, Sens. Laphonza Butler of California and Jack Reed of Rhode Island, have urged the SEC chairman to avoid approving crypto investment products. In a letter dated March 11, the lawmakers, who are also members of the Senate Banking Committee, asked the Commission to limit future crypto ETF applications.

Following the approval of 11 Bitcoin spot ETFs in January, the attention of the crypto public has somewhat turned to whether the SEC will do the same for the Ethereum versions. However, this latest letter from the senate seems to further hurt the chances of an ETH ETF approval.

A part of the letter read:

Retail investors would face enormous risks from ETPs referencing thinly traded cryptocurrencies or cryptocurrencies whose prices are especially susceptible to pump-and-dump or other fraudulent schemes,” they said. “The Commission is under no obligation to approve such products, and given the risk, it should not do so.

As of this writing, the price of the Ethereum token stands at $3,731, reflecting a 1.2% increase in the past day.
Grayscale

800,000 ETH Flow Out Of Centralized Exchanges In 2024 – Bullish Sign For Ethereum Price?

The price of Ethereum has been a joy to watch since the start of 2024, climbing by more than 30% in less than two months. The latest on-chain revelation suggests that ETH investors are approaching the market with more confidence, as the cryptocurrency’s price rally seems to be far from over.

$2.4 Billion Worth Of ETH Leaves Exchanges: CryptoQuant

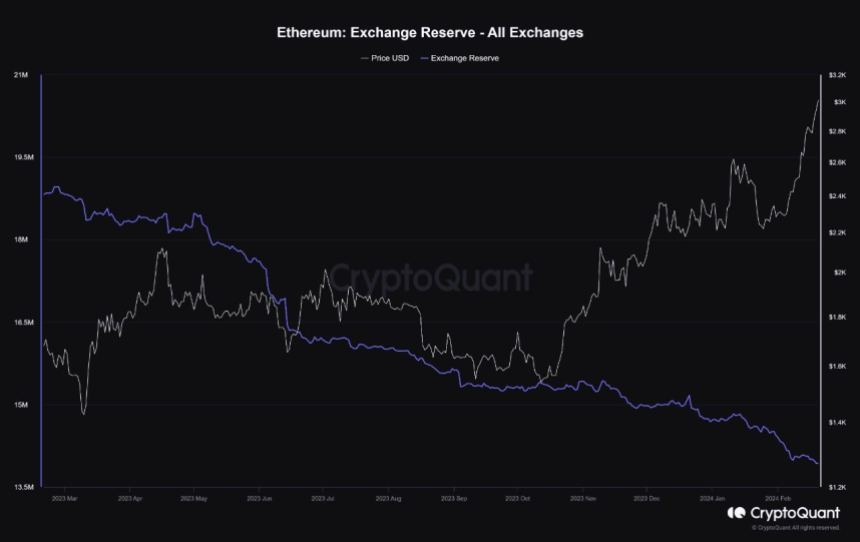
A pseudonymous analyst on CryptoQuant’s Quicktake revealed that significant amounts of the Ethereum token have been making their way out of exchanges in the last few weeks. This observation is based on the “Exchange Reserve” metric, which tracks the amount of ETH tokens in the wallets of all centralized exchanges.

When the value of this metric increases, it implies that investors are making more deposits than withdrawals of an asset (Ether, in this case) into centralized exchanges. Meanwhile, the metric’s decline means that more assets are flowing out than entering these platforms.

According to data from CryptoQuant, more than 800,000 ETH (equivalent to approximately $2.4 billion) has flowed out of cryptocurrency exchanges since the turn of the year. Typically, the movement of significant amounts of cryptocurrencies out of these platforms suggests a rise in investor confidence.

Ethereum

As the CryptoQuant Quicktake author noted, this reduction in Ether’s exchange reserve balance could be a bullish catalyst for the altcoin’s price. A sustained decline in the ETH’s supply on exchanges could trigger a supply crunch, potentially driving the Ethereum price higher.

As of this writing, the Ethereum price stands at around $2,920, reflecting a 1.8% decline in the past day. Nevertheless, the “king of altcoins” is still in the green on the weekly timeframe, with an almost 5% price jump over the last week.

Ethereum Price Rise Due To Anticipation Of Dencun Upgrade: Grayscale

In a recent report, Grayscale has offered commentary on Ethereum’s positive price performance so far in 2024. The asset management firm tied ETH’s bullish trajectory to the upcoming Dencun upgrade of the Ethereum network.

William Ogden Moore, Grayscale’s research analyst, wrote in the report:

We believe that recent price performance reflects the market’s anticipation of this upgrade, as Ethereum (up 26% YTD) has outperformed the broader Smart Contract Platforms Sector (up 3% YTD) since January 1st, 2024.

The Dencun upgrade, which is less than a month away, will aim to enhance Ethereum in terms of scalability and cost-effectiveness. It is also expected to help the network compete with “faster chains in the Smart Contract Platforms Crypto Sector, such as Solana.”

Another narrative that may be propelling the price of ETH is the approval of Ethereum spot exchange-traded funds (ETFs) in the United States. Interestingly, Grayscale is amongst the asset managers looking to debut an Ether spot ETF.

Ethereum

Is Bitcoin Price Facing A Correction To $46,000? Here’s What This Analyst Thinks

Over the past week, the Bitcoin price put in one of its finest performances since the start of 2024, breaking above $50,000 for the first time since 2021. While the premier cryptocurrency has been moving mostly sideways in the past few days, it continues to hold its own above the $51,000 mark.

However, a popular crypto analyst on the X platform has put forward an interesting prognosis for the Bitcoin price, stating that the coin might experience some bearish pressure in the near future.

Is BTC Headed To $46,000?

On Thursday, February 15, prominent crypto analyst Ali Martinez sounded the sell alarm – based on the Tom Demark Sequential indicator – for Bitcoin. According to the analyst, investors should anticipate a one-to-four candlesticks correction on BTC’s daily chart in the coming days.

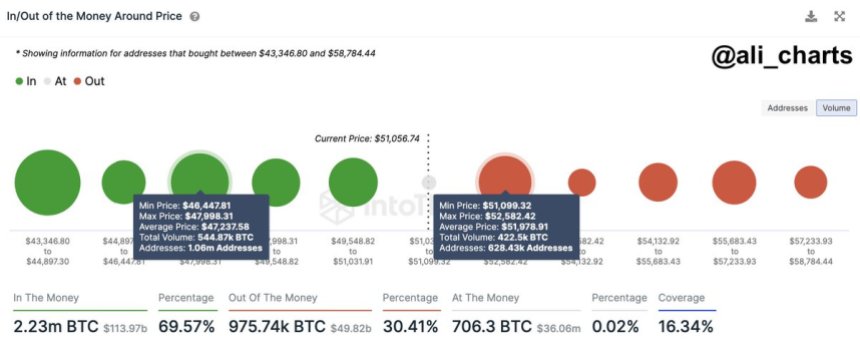
Ali Martinez took to the X platform on Saturday, February 17, to share an in-depth analysis of an impending correction for the Bitcoin price. This evaluation is based on the distribution of holders’ cost basis across the various BTC price zones near the current price of the cryptocurrency.

With this on-chain indicator, the strength of any resistance or support level depends on the number of coins acquired by investors within the price range. And this strength is portrayed by how large or small the circles (representing the price ranges) are.

Bitcoin price

As shown in the chart above, the price of Bitcoin seems to be facing significant resistance between $51,099 and $52,582. Recognizing this pattern, Martinez said in his post that if the flagship cryptocurrency fails to reclaim the $52,000 level, then it is at risk of an 8% price correction. 

An 8% decline from the current point would see the Bitcoin price drop to between the $48,000 and $46,500 zone. According to the on-chain resistance data, more than 1 million addresses bought 544,870 BTC within this range, making it a significant support level.

Bitcoin Price Overview

As of this writing, the Bitcoin price stands at around $51,650, reflecting an almost 0.9% dip in the past 24 hours. Despite the recent bearish pressure slowing down its momentum, the market leader has maintained most of its profit from the past week.

According to data from CoinGecko, Bitcoin’s value has jumped by more than 8% in the last seven days. Meanwhile, the cryptocurrency has registered over 20% growth so far in the month of February.

Thanks to the recent price rise, BTC surpassed the $1 trillion mark in terms of market capitalization, solidifying its position as the largest asset in the cryptocurrency sector.

Bitcoin price

Bitcoin Bull Run: On-Chain Data Points To Declining Retail Participation

The price of Bitcoin has continued to soar this week, with the premier cryptocurrency consolidating its place above the $50,000 mark. Interestingly, on-chain data shows that a particular class of investors had less to do about the recent rally, sparking conversations about their participation in the current bull cycle.

Recent BTC Price Primarily Fueled By ‘Institutional Demand’

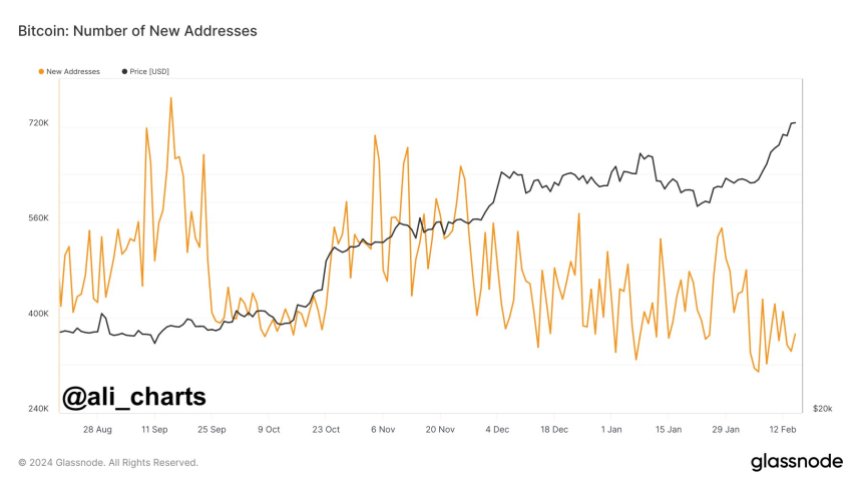
In a recent post on X, analyst Ali Martinez pointed out that there has been an apparent decline in the involvement of retail investors in the Bitcoin market. This shift comes despite the recent surge in the flagship cryptocurrency’s price.

This revelation is based on the noticeable fall in the daily creation of new Bitcoin addresses. According to the crypto intelligence platform Glassnode, this metric tracks the number of unique addresses that appeared for the first time in a transaction of the native coin in the network.

Bitcoin

Typically, more individuals are inclined to enter the market as the value of Bitcoin increases, often resulting in a spike in new addresses to store and transact the coin. However, there is currently a deviation between the BTC price and the creation of new addresses.

According to Martinez, this curious trend suggests a lack of retail participation in the ongoing Bitcoin bull run. The crypto analyst, however, tied the flagship cryptocurrency’s recent positive performance to institutional players’ activity.

This analysis seems to hold some weight, considering it’s been a little over a month since the Securities and Exchange Commission approved the trading of spot BTC exchange-traded funds in the United States. These investment products are issued and managed by some of the world’s largest financial companies, including BlackRock, Grayscale, Fidelity, and so on.

Bitcoin Whales Show Highest Activity Since 2022

Another on-chain revelation that somewhat supports the argument of increased institutional participation has emerged. According to analytics platform Santiment, BTC whale activity has been heating up lately, reaching its highest level in over 20 months.

Data from Santiment shows that wallets with 1,000 – 10,000 BTC are on an accumulation spree, adding roughly 249,000 coins (worth about $12.8 billion) in 2024 only. However, it is worth mentioning that a lower tier of investors (100 – 1,000 BTC) has sold more than 151,000 Bitcoin since the year started.

As of this writing, Bitcoin is valued at $51,950, reflecting a 0.6% decline in the past day. Nonetheless, the premier cryptocurrency has retained most of its weekly profit, having gained almost 10% in the last seven days.

Bitcoin

PEPE Ready To Jump? Crypto Analyst Forecasts 65% Price Surge – Here’s How

The PEPE meme coin has somewhat struggled in the past few months, failing to capitalize on the current bull run. However, the token seems to be experiencing some form of recovery lately, with its value seeing a significant increase over the past week.

While PEPE has obviously grabbed the attention of some investors, it also seems to be a cryptocurrency of interest amongst the experts. For instance, a popular crypto pundit on the X platform has sounded a buy alarm for the meme coin.

PEPE’s Price To Reach $0.0000017?

In a recent post on X, prominent crypto analyst Ali Martinez put forward a bullish prognosis for the price of PEPE. According to the analyst, the cryptocurrency’s current setup suggests that it is primed for a bullish run to the upside.

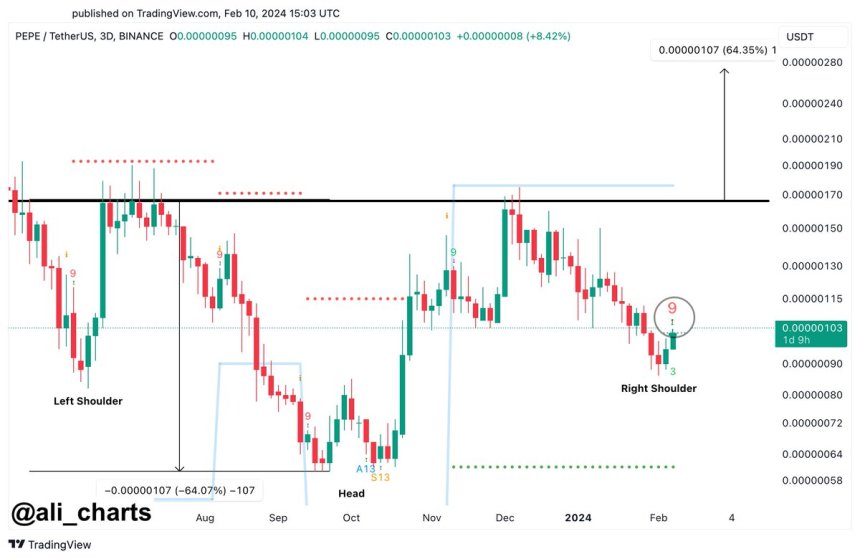
This bullish forecast revolves around the formation of an inverse head-and-shoulders chart pattern on the three-day timeframe. Typically, the head and shoulders price pattern depicts a bullish-to-bearish trend reversal and suggests that an upward trend is coming to an end.

PEPE

An inverse head and shoulders pattern, on the other hand, is a bullish chart formation that indicates a potential reversal of a downward trend. According to Martinez, PEPE’s price is currently forming a right shoulder of the inverse head and shoulders pattern, meaning that upward price movement is on the horizon.

Furthermore, the crypto analyst mentioned that the TD (Tom Demark) Sequential indicator has gone off, sounding a buy alarm for the PEPE meme coin. With this positive signal and the bullish chart formation, Ali Martinez anticipates a bullish trajectory for the cryptocurrency in the long term.

It would be logical to wait for a break and sustained close above the neckline before confirming the bullish thesis. In this case, investors could see the price of PEPE reach as high as $0.0000017, representing a potential 65% rise from the current price point.

PEPE Price

As of this writing, PEPE’s price stands at about $0.000001015, reflecting an almost 1% decline in the past 24 hours. However, the meme coin has managed to retain most of its profit on the weekly timeframe.

According to data from CoinGecko, the PEPE token has witnessed a 10% increase in the last seven days. From a broader perspective, though, the cryptocurrency has struggled to hit the heights it once occupied.

Since the turn of the year, PEPE’s value has slumped by more than 22%. Nevertheless, the meme coin boasts a market capitalization of roughly $428 million.

PEPE

AVAX Price Closes In On $40 With Latest 10% Surge

The Avalanche token has been in a positive form recently, with the AVAX price turning in a good performance over the past week. This latest price boost makes a run to the $40 level more or less inevitable for the altcoin.

However, investors are curious to see how long this rally will last, especially with the unlocking of a substantial amount of AVAX tokens on the horizon.

AVAX Price Overview

As of this writing, the AVAX price is slightly above $39, reflecting a nearly 8% jump in the last 24 hours. This recent increase only underscores how well the cryptocurrency has been performing in recent weeks.

According to data from CoinGecko, the value of the Avalanche token has increased by approximately 10% in the past week. After sinking to a low of $28 in late January, AVAX’s price has recovered quite well in the new month, surging by more than 17% since February started.

With the latest price growth, Avalanche looks set to reclaim $40, a level it occurred between December 2023 and early January 2024. The token, however, lost this level due to the downturn that hit the entire crypto market following the Bitcoin spot ETF approval.

With $40 already in sight, the question is whether AVAX can sustain a rally above this mark in the long term. While price indicators like the Relative Strength Index (RSI) are not showing any signs of trend reversal, upcoming events suggest that the Avalanche token might need to overcome some degree of bearish pressure in the coming days.

Avalanche To Unlock About $370 Million Worth Of Tokens

According to on-chain data, Avalanche will unlock 9.54 million tokens (worth about $372 million) on February 22. This figure represents about 2.6% of AVAX’s total supply and will be disbursed in four tranches.

Breaking it down, 2.25 million AVAX is expected to go to strategic partners, 1.67 million coins to the foundation, 4.5 million tokens to the Avalanche team, and 1.13 million AVAX are set to be released in a little over a week.

It is common for crypto projects to execute token unlocks, which may have a corresponding impact on the value of the unlocked token (AVAX, in this case). This effect is because this substantial amount of token, once unlocked, may become available for trading on the open market.

If these newly unlocked tokens are dumped on the open market, this can place some bearish pressure on the burgeoning price of AVAX. This selling pressure could halt the recent growth of the Avalanche token.

AVAX

Chainlink Price Stalls As $287 Million Worth Of LINK Makes Its Way To Binance

The price performance of Chainlink is one of the previous week’s biggest narratives, rivaling Bitcoin making its way above $43,000 again. According to data from CoinGecko, the altcoin recorded a significant 25% price increase in the last seven days.

However, the price of LINK seems to be slowing down, as it keeps struggling to hold above the $18 level. While expectations are that this sluggishness will blow over soon, the question still is – why is the Chainlink price stalling?

16 Million LINK Tokens Transferred To Binance

The latest on-chain revelation has offered insight into why the price of LINK is facing some form of bearish pressure. In a post on X, crypto analytics firm SpotOnChain disclosed that 19 million tokens (worth about $341 million) were recently unlocked from three of Chainlink’s non-circulating supply contracts.

In a more detailed breakdown, the on-chain analytics firm revealed that 15.95 million tokens (valued at $287 million) were moved to Binance, the world’s largest centralized exchange. Meanwhile, the remaining 3.05 million Chainlink (worth $54.3 million) were transferred to multi-sig wallet, 0xD50f.

According to SpotOnChain, this is not the first time transactions involving Chainlink’s wallets and of this caliber will happen. The analytics platform disclosed that Chainlink has been unlocking and transferring some of the unlocked tokens to Binance as far back as 2022.

On-chain data shows that Chainlink has unlocked a total of 106 million tokens, with 88.95 million LINK sent to Binance since August 2022. At an average price of $9.06, the entire worth of these transactions stands at $805 million.

SpotOnChain noted that the last two unlocks have been followed by a slight dip in LINK’s price. The last unlock saw the Chainlink token fall from almost $19 to $17.5 on Saturday, February 3.

As of this writing, the LINK token is valued at $17.86, reflecting a nearly 1.5% price jump in the past day.

Chainlink Records Multi-Month High In Transaction Volume

It appears that the price of LINK will not remain stagnant for very long, as the most recent on-chain data indicates that Chainlink has experienced a notable increase in network activity over the last few days. Positive network fundamentals could be all the altcoin needs to resume its bullish run.

According to Ali Martinez, the network recently witnessed a significant surge in transaction volume, bringing the metric to its highest in almost two years. Based on IntoTheBlock’s data, more than 72.24 million LINK tokens (equivalent to $1.3 billion) were transacted on Friday, February 4. 

Chainlink

These Altcoins Are Showing High Social Dominance After Recent Price Swings

According to crypto intelligence platform Santiment, some altcoins have been enjoying increased attention from investors over the past few days. This comes as the crypto market continues to undergo a positive recovery from its recent slump in the aftermath of the Bitcoin ETF launch.

These Altcoins Show Potential For More Profit: Santiment

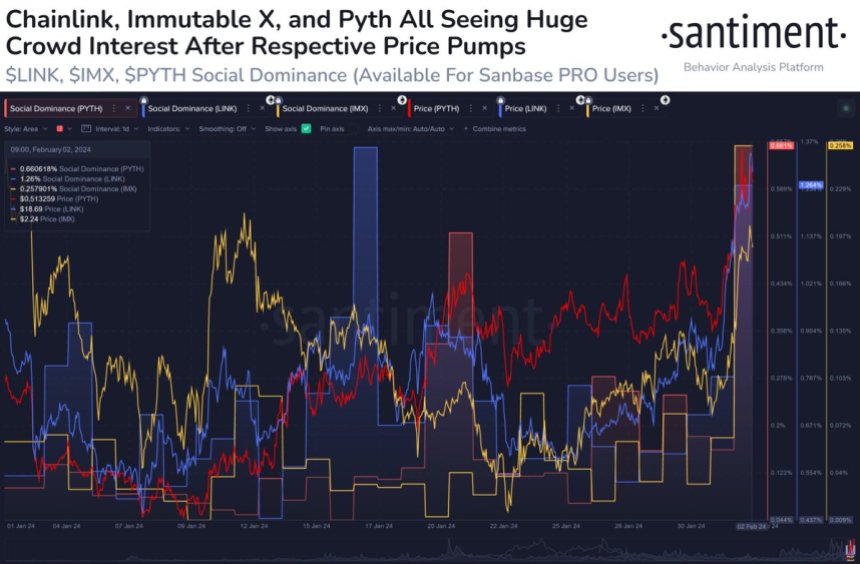
In a post on the X platform, Santiment revealed that three altcoins, including Chainlink (LINK), Immutable X (IMX), and Pyth (PYTH), have become assets of mainstream interest in the past few days. 

This revelation is based on their performance in terms of Social Dominance, an indicator that compares the social volume of a particular asset to the combined social volume of the top 100 cryptocurrencies by market capitalization. 

Altcoins

As shown in the chart above, the Social Dominance of these three altcoins has seen a notable spike in recent days. Interestingly, Santiment has associated this renewed investor interest in Chainlink, Immutable X, and Pyth, with their market cap growth in the past week.

According to data from Santiment, the valuations of LINK, IMX, and PYTH have increased by 34%, 23%, and 26%, respectively, in the last seven. The on-chain analytics noted that the mainstream crowd discussion around these altcoins will lead to FOMO (fear of missing out) amongst investors.

Santiment further highlighted that this FOMO can trigger high price volatility and increased buying pressure for Chainlink, Immutable X, and Pyth. Ultimately, this can lead to more price gains for the three crypto assets.

Chainlink Price Overview

The price performance of Chainlink in the past week has been the most impressive of the three altcoins highlighted by Santiment. According to data from CoinGecko, LINK’s value has jumped by more than 24% in the past week.

In a week dominated by Bitcoin’s resurgence to above $43,000, Chainlink managed to become one of the biggest gainers in the last seven days. The cryptocurrency’s price registered a positive run to almost as high as $19.

As of this writing, the Chainlink token is valued at $17.69, reflecting a 1.2% price decline in the last 24 hours. The altcoin appears to be witnessing some amount of downward pressure as it is struggling to hold above the $18 level.

Nevertheless, Chainlink continues to lay a strong claim to a spot amongst the top 10 largest cryptocurrencies by market capitalization. With a market cap of over $10 billion, LINK ranks as the 13th-largest asset in the cryptocurrency sector.

Altcoins

Analyst Says ‘Bitcoin Price Correction Is Over’ – What’s Next?

The tides seem to be turning in favor of the Bitcoin price, as the market leader has reclaimed the $42,000 level for the second time in as many days. According to data from CoinGecko, the premier cryptocurrency has managed to register a 1.1% profit on the weekly timeframe. 

While Bitcoin appears to be garnering positive momentum at the moment, outflows from the Grayscale BTC ETF (GBTC) continue to brew fear of continued bearish pressure in the hearts of investors. However, a prominent crypto analyst has offered insights into the flagship coin’s recent movement, claiming that the price correction is over.

BTC Price To Make Another Run At $48,000?

In his latest video on YouTube, crypto pundit and analyst Michael van de Poppe declared that he believes that the Bitcoin price correction is over for now. The premier cryptocurrency experienced an almost 10% price decline after notching a multi-month high at around $49,000 on January 11, the day Bitcoin spot ETFs started trading in the United States.

While the general belief is that this price dip is connected to investors cashing out their shares in the Grayscale Bitcoin Trust, van de Poppe claims that it is only one of the negative events that enter the spotlight when the market is going through a correction. The analyst also highlighted the recent news of Mt. Gox paying out approximately 200,000 BTC to its past clients as another such incident.

However, with the selling pressure somewhat dampening, de Poppe speculated that the Bitcoin price might have one more run to $48,000 before the halving event. While acknowledging that the Bitcoin halving is a bullish event, the analyst doesn’t believe there would be a significant price rally prior to it.

In line with his analysis, Michael van de Poppe expects the Bitcoin price action to be within a range of $37,000 – 48,000 over the coming months. The crypto analyst anticipates that the altcoins will go on a positive run during this period.

Finally, van de Poppe mentioned that a trip down to $30,000 is not completely off the cards for the market leader, echoing recent bearish predictions. However, the pundit believes the odds of a $30,000 retest are low, as the crypto market rarely moves in the crowd’s direction.

Bitcoin Price Update

As of this writing, the Bitcoin price stands at $42,124, reflecting a mere 0.7% increase in the past day. With a market capitalization of over $826 billion, BTC maintains its position as the largest cryptocurrency in the sector.

Bitcoin price

Polkadot Rally Incoming? Crypto Analyst Predicts 150% Price Surge For DOT

The Polkadot (DOT) token has witnessed significant downward pressure over the past few weeks. This negative performance was further exacerbated by the recent downturn of Bitcoin’s value, which tumbled below $40,000 over the past week.

However, the altcoin appears to be garnering momentum in the past few days, having rebounded positively from the $6 mark. A popular analyst on the X platform has put forward an exciting projection for DOT, saying the token looks set for a substantial upward move in the coming weeks.

Can Polkadot Reach $17 In This Cycle?

In a recent post on X, prominent crypto analyst Michael van de Poppe noted that the altcoins market is on the verge of a significant surge. Specifically, the crypto pundit singled out the Polkadot token as one of the assets to look out for.

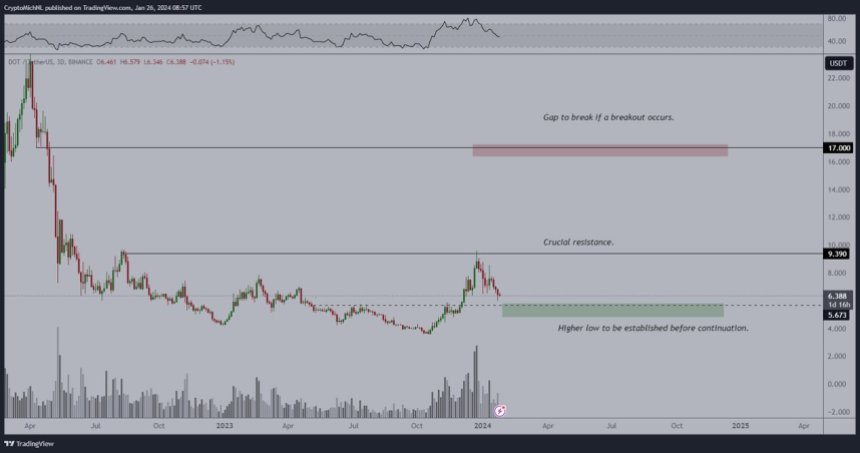
According to Poppe’s post on X, DOT is approaching a significant support level in three days. The analyst identified the support zone between $5.60 and $6 while highlighting the need for this level to hold strong.

Polkadot

If the support level holds, Michael van de Poppe believes that Polkadot’s price is primed for a substantial run to the upside in the current cycle. And the crypto analyst put forward an ultimate $17 target for the cryptocurrency if a breakout does occur.

This potential price action would represent a massive 150% upswing from the current price point. Nevertheless, this would still be a long way from the token’s all-time high of $54.98

It is worth noting that Michael van de Poppe has also identified a price zone that will be integral to DOT’s possible run to $17. According to his analysis, there is significant resistance for the altcoin to overcome at around the $9.39 level.

DOT last hit this price point on Boxing Day. Resistance caused the coin’s value to collapse; since December 26, 2023, it has dropped by almost 30%.

DOT Price Overview?

As earlier inferred, Polkadot’s price has performed poorly since the turn of the year. According to data provided by CoinGecko, the cryptocurrency’s value has dipped by almost 24% in the past month.

As of this writing, the DOT price is $6.69, reflecting a 3.8% increase in the last 24 hours. However, the coin is still red on the weekly timeframe, with a 2.3% price slump over the past seven days.

Nonetheless, Polkadot ranks as the 13th-largest cryptocurrency, with a market capitalization of roughly $8.85 billion.

Polkadot

Solana Stablecoin Volume Reaches Record High Of $300 Billion In January

According to the latest on-chain data, the Layer-1 network Solana has hit a significant milestone in terms of the transfer volume of stablecoins this month.

Solana Overtakes Tron In Stablecoin Transfer Volume

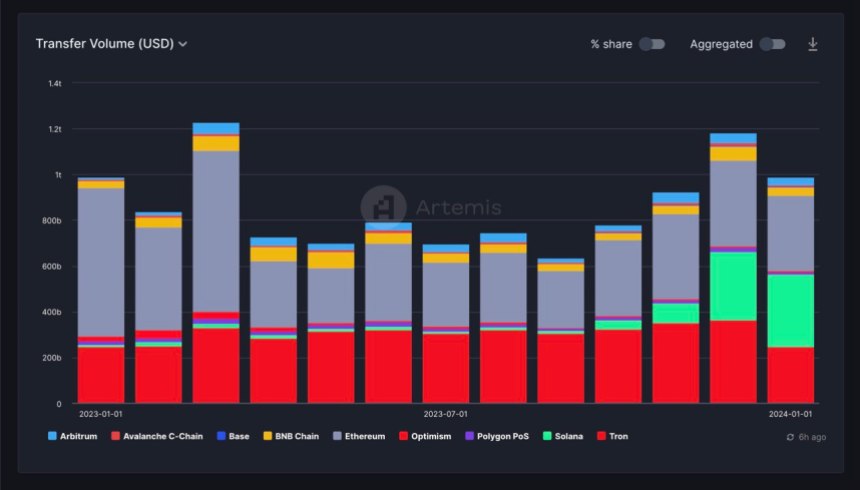
Data from the blockchain analytics platform Artemis shows that the stablecoin transfer volume on Solana has already surpassed $300 billion in January. This is the largest transfer volume recorded by stablecoins on the Layer-1 blockchain in a single month.

To put this figure into context, the Solana network registered $297 billion in stablecoin volume in the entire December. Meanwhile, the blockchain’s stablecoin transfer volume was about $11.56 billion in January 2023, reflecting an over 2,500% growth in the past year.

Solana

From the chart above, it is clear that Solana’s stablecoin activity has been on a steady rise since October, increasing by more than 650% in the past few months.  This growth has also impacted the network’s share in the stablecoin market, with Solana now boasting about 32% market share.

Unsurprisingly, Ethereum leads the market for stablecoins, with its transfer volume already reaching almost $317 billion in January. Meanwhile, the Tron network trails Solana in third place, with a stablecoin volume of roughly $240 billion.

On Thursday, January 18, Paxos revealed the launch of its regulated stablecoin, USDP, on the Solana network. According to DefiLlama data, USDC remains the dominant stablecoin on the Layer-1 network, with a market cap of over $1 billion.

SOL Price Overview

Despite Solana’s burgeoning network activity, the price performance of its native token SOL has somewhat dampened in the past few weeks. As of this writing, the Solana token is valued at $92, reflecting a 0.6% decline in the last 24 hours.

This sluggish performance in the past day underscores the altcoin’s challenges since the turn of the year. After reaching a multi-month high of $124 at the end of 2023, the SOL price has largely struggled to hold above the $100 mark.

According to data from CoinGecko, the Solana token is down by more than 5% in the past week. Meanwhile, the coin has declined by about double that figure since the beginning of 2024.

Nevertheless, SOL maintains its position as the fifth-largest cryptocurrency in the sector, with a market capitalization of more than $40 billion.

Solana

Bitcoin Whale Addresses Hit 15-Month High – A Sign Of Growing Accumulation?

The story has not been much different for the price of Bitcoin this week, as the premier cryptocurrency has struggled to capitalize on its recent advancements. According to data from CoinGecko, BTC is down by more than 3% in the past week, putting doubts over the continuation of the bull run.

However, the latest on-chain revelation has offered some relief, suggesting that the value of Bitcoin might be up for substantial recovery over the next few weeks. 

Can Whale Accumulation Trigger Continuation Of Bull Cycle?

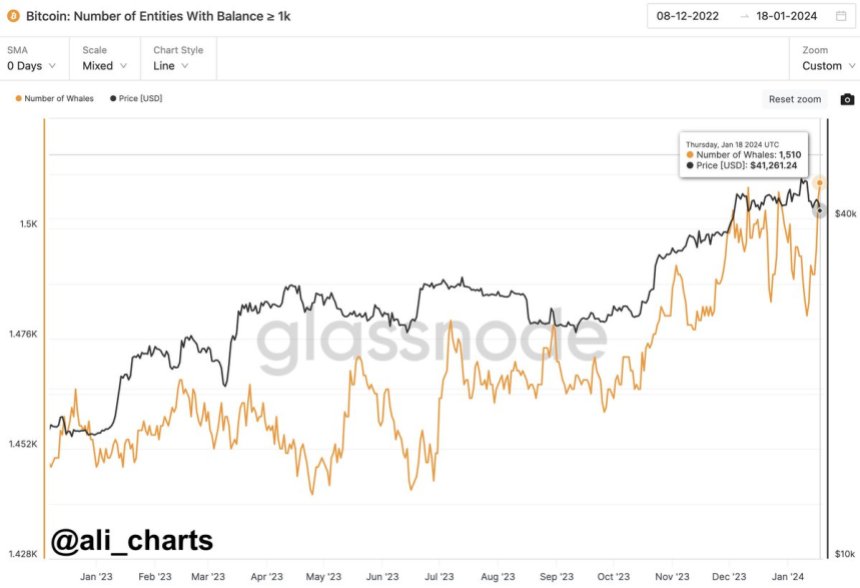
Popular crypto analyst Ali Martinez revealed – via a post on the X platform – that the number of Bitcoin whales has witnessed a significant increase over the past few days. This is based on the “Number of Entities With At Least 1,000 BTC Balance” metric from the on-chain analytics firm Glassnode.

According to the latest Glassnode data, the number of addresses holding at least 1,000 BTC surpassed 1,510 on Thursday, January 18. This figure represents the metric’s highest level in over 15 months (since August 2022). 

Bitcoin

Large holders, commonly known as “whales,” are considered relevant entities in the cryptocurrency market due to their ability to influence prices and market sentiment. Hence, a notable uptick in the number of whales often suggests growing confidence in a cryptocurrency – in this case, Bitcoin.

Furthermore, this surge in whale addresses signals potential accumulation amongst large investors and institutions. Acquisition of large Bitcoin amounts is a positive sign for the market leader, especially in terms of price performance.

A recent Santiment report adds strength to this argument, saying that increased whale accumulation of Bitcoin would be a “key” factor to help trigger another bull run for the flagship cryptocurrency and the entire sector. 

The blockchain analytics firm also highlighted the accumulation of the Tether and USDC stablecoins as a vital signal for the cryptocurrency market’s return to its recent high.

Bitcoin Price Overview

As of this writing, the price of Bitcoin stands at $41,593, reflecting a 1.1% increase in the past 24 hours. This doesn’t fully tell the story of the coin’s performance in the past day, though, as it briefly fell below $41,000.

According to data from CoinGecko, BTC is down by more than 5% in the last 14 days. The cryptocurrency has reversed all its gains and more from the recent launch of spot exchange-traded funds in the United States.

Nevertheless, Bitcoin maintains its spot as the largest cryptocurrency in the sector, with a market cap of over $814 billion.

Bitcoin

Bitcoin To $34,000? Analyst Predicts Next Move For BTC With This Chart Pattern

Bitcoin had a surprisingly underwhelming price performance over the past week despite the United States Securities and Exchange Commission (SEC) approving the trading of spot BTC ETFs. The price of the flagship cryptocurrency almost broke into $49,000 at the peak of this positive news but has since retraced back below $43,000.

Ali Martinez, a popular crypto analyst on the X platform, has offered insight into the current market climate of Bitcoin, highlighting that the cryptocurrency’s price may face further downward pressure over the coming weeks.

Analyst Forecasts 20% Price Drop For BTC 

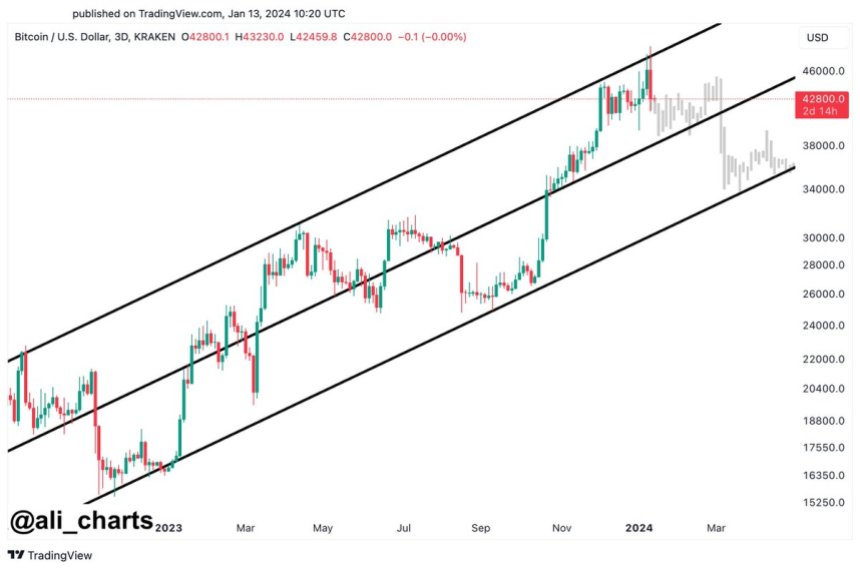
In a recent post on X, the crypto pundit shared an update on his analysis of the Bitcoin’s price chart on the three-day timeframe. On January 4, Martinez initially identified an ascending parallel channel, which seems to be governing the Bitcoin price action since September 2023.

In price analysis, an ascending parallel channel is a technical analysis pattern that features two parallel upward-sloping trend lines. While it is mostly a bullish chart pattern, the ascending parallel channel can signal a short-term bearish move or even a trend reversal.

Bitcoin

Martinez noted in his post that the current setup appears to be holding true after the Bitcoin price faced rejection from the parallel channel’s upper boundary at $48,000. Following this price correction, the analyst has predicted $34,000 at the channel’s lower boundary as the natural next stop for the premier cryptocurrency.

A downward move to $34,000 would represent a significant 20% decline from Bitcoin’s current price point. However, according to Martinez’s analysis, it might not be looking all gloomy for the world’s largest cryptocurrency.

On the bright side, the analyst expects a quick recovery for the Bitcoin price after the downward spiral to $34,000. Martinez said that the pioneer crypto could make a rebound back to the upper boundary at $57,000.

Bitcoin Price Overview

As of press time, the Bitcoin price stands at $42,909, reflecting a negligible 0.6% decline in the past 24 hours. The premier cryptocurrency has struggled to hold above $43,000 since experiencing a massive downturn to below $42,000 on Friday.

Meanwhile, BTC’s profits since the turn of the year have been cut back to a mere 1.6%, putting the bullish future of the coin into question. Bitcoin is down by nearly 3% on the weekly timeframe, according to data from CoinGecko.

Nevertheless, BTC maintains its position as the largest asset in the cryptocurrency sector, with a market capitalization of roughly $841 billion.

Featured image from iStock, chart from TradingView

Grayscale Moves Nearly $1 Billion Worth Of Bitcoin In Past Month – Report

According to the latest report, asset management firm Grayscale has been transferring large amounts of Bitcoin to various wallet addresses over the past month. This data revelation comes days after the asset manager’s application to convert its Bitcoin trust to a spot exchange-traded fund (ETF) was approved by the United States Securities and Exchange Commission (SEC).

It is believed that the Grayscale Bitcoin Trust is one of the largest Bitcoin entities in the world. In September 2023, crypto analytics platform Arkham Intelligence discovered the asset manager’s multi-billion dollar BTC holdings across more than 1,750 wallet addresses.

How Much Did Grayscale Send To Coinbase?

CryptoQuant’s founder Ki Young Ju revealed  – via a post on the X platform – that Grayscale has moved about 21,400 BTC to different wallet addresses in the last 30 days. The CEO also highlighted that some of the funds were sent to Coinbase, the largest centralized exchange in the United States.

Specifically, the recent conversion of the Grayscale Bitcoin Trust to a spot BTC ETF has put some spotlight on the firm’s funds movement in recent days. This is because the shares of GBTC are now redeemable for Bitcoin following the ETF approval on January 10.

However, Arkham Intelligence data on Friday, January 12, a day after the spot Bitcoin ETFs began trading in the US, revealed that Grayscale’s Bitcoin trust sent 894 BTC (about $41 million) to Coinbase in a single transaction. This amount sent to the exchange represents about 0.15% of GBTC’s total holdings.

Arkham’s data shows that an additional $119 million in BTC was sent to other addresses on January 12. Interestingly, these funds outflows from Grayscale Bitcoin Trust are believed to have caused the sudden downturn in the price of BTC on Friday.

Popular crypto trader Ran Neuner agreed with this belief, saying that the Bitcoin price is “dumping” as investors are selling their GBTC shares. Neuner said in his post on X:

GBTC held $25bn+ worth of Bitcoin that has been locked up for years with no option to be sold. As soon as the redemption option opened, for the first time people are starting to exit – as they exit the Bitcoin must be sold on the market.

Bitcoin Price Overview

As of this writing, the price of Bitcoin stands at $42,805, reflecting a 7% decline in the past 24 hours. The premier cryptocurrency has reversed most of its gains in the past week after initially falling to below $42,000 on Friday.

According to CoinGecko data, Bitcoin’s price is down by about 2.5% in the last seven days. Nevertheless, BTC maintains its position as the largest cryptocurrency in the sector, with a market cap of $838 billion.

Grayscale

Crypto Analyst Forecasts MATIC Price Recovery With This 16% Swing

MATIC was one of the altcoins affected by the recent market downturn triggered by the controversial Matrixport report on the Bitcoin spot ETF this week. This negative sentiment pushed the cryptocurrency’s price from trading at nearly $1 to below $0.85 in a single move.

However, the tide seems to be turning in favor of the bulls, as the MATIC coin has jumped more than 1.2% in the past day. In fact, a popular crypto analyst on the X (formerly Twitter) platform has sounded a buy alarm for Polygon’s native token.

Can MATIC’s Price Return To $0.96?

In a recent post on X, crypto analyst Ali Martinez has put forward a bullish projection for the price of MATIC over the coming days. According to the crypto pundit, the cryptocurrency looks set to recover all its lost gains in a potential upward price movement.

The reasoning behind this bullish prediction for the Polygon token revolves around the TD (Tom DeMark) Sequential indicator. For context, the Tom DeMark Sequential indicator is used to identify the exact time of trend exhaustion and price reversal.

Martinez noted in his analysis that the TD indicator is currently flashing a buy sign on MATIC’s 4-hour price chart. However, the crypto analyst highlighted that a bullish future for MATIC hinges on a spike in buying pressure around the current price levels.

This could potentially see the Polygon token climb toward $0.88 and as high as $0.96, Martinez said. Ultimately, this bullish prediction depicts an almost 16% surge from the current price point. 

It is worth noting that the Relative Strength Index (RSI) on the 4-hour timeframe, which tracks the bullish and bearish momentum of a token, is currently at 38.2. When the RSI is below 50, it may suggest that the token is witnessing some bearish momentum.

MATIC Price Overview

As of this writing, the price of MATIC stands at $0.828969, reflecting a mere 1.2% increase in the past 24 hours. Polygon’s sluggish performance in the past day emphasizes the altcoin’s struggles over the last seven days.

According to data from CoinGecko, the MATIC price has declined by more than 14% in the past week. And this recent market downturn saw the cryptocurrency lose virtually all of the profits it accrued in December.

Nevertheless, MATIC ranks as the 14th-largest cryptocurrency in the sector, with a market capitalization of about $7.8 billion.

MATIC

Bitcoin Flash Crash: Crypto Market Witnesses $2.5 Billion Inflow Following Recent Downturn

The past week was largely defined by the Bitcoin price climbing above $45,800 for the first time in over 20 months, marking a great start to the year. However, the premier cryptocurrency soon experienced a sharp price pullback due to negative news about the BTC spot (ETF). 

Interestingly, the latest on-chain data has revealed that investors seem not to have completely lost faith in Bitcoin, the largest cryptocurrency by market capitalization.

$2.5 Billion Flows Into Crypto Market Following Bitcoin Crash

In a post on the X platform, crypto analyst Ali Martinez has offered on-chain insight into the aftermath of the crash that affected Bitcoin and the entire crypto market. The pundit noted in his post that a substantial amount of funds flooded back into the sector a day after the market downturn.

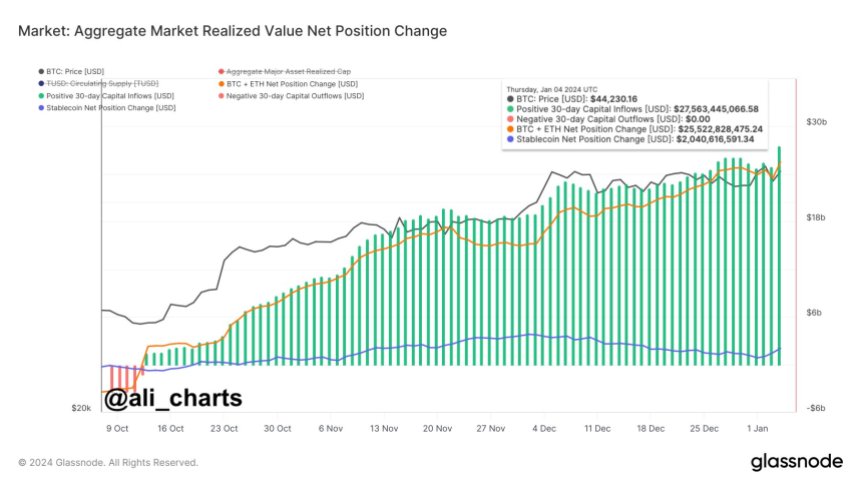
This revelation was based on on-chain data from blockchain analytics platform Glassnode. The relevant indicator here is the “positive 30-day capital inflows”, which tracks the net influx of capital into the crypto market over a 30-day period.

Bitcoin

The chart above shows that a significant amount of funds have been entering the cryptocurrency market over the past few months. According to Glassnode’s data, more than $2.5 billion flowed back into the cryptocurrency market on Thursday, January 4, bringing the positive 30-day capital inflows to about $27.5 billion.

This latest inflow of capital into the market offers insight into the positive shift in sentiment and market condition. It basically signals renewed investor confidence in crypto assets following a short period of uncertainty and price correction. 

As of this writing, the Bitcoin price stands at $43,661, reflecting a 0.2% decline in the past 24 hours. However, the market leader seems to be recovering well, with $44,000 not too far out of reach.

How BTC Holders Reacted To The Market Downturn

A recent analysis shows how various classes of Bitcoin investors reacted to the negative ETF news and the subsequent decline. This evaluation was based on the Spent Output Age Bands USD (SOAB) indicator on the CryptoQuant analytics platform.

The investors were divided into five classes based on the age of their holdings. According to the analysis, short-term holders who fell within the 1-week-to-1-month and 1-month-to-3-month classes exited the market at break-even and profits, respectively.  

Meanwhile, long-term holders who purchased Bitcoin in the first half of 2023, falling between the 6-month-to-12-month class, dumped about $7.6 billion worth of BTC. The 1-year-to-5-year holder class, on the other hand, barely made a move after the market downturn.

Bitcoin

Bitcoin ETF: SEC May Notify Approved Issuers To Launch Very Soon – Here’s When

According to a recent report from Reuters, the US Securities and Exchange Commission (SEC) may notify the asset managers looking to launch a spot Bitcoin ETF (exchange-traded fund) if their applications have been approved as soon as next week. 

SEC To Notify Applicants Of Its Decision By Next Week: Reuters

On Saturday, December 30, Reuters reported that the SEC may notify the 14 Bitcoin ETF applicants if their applications will be approved by Tuesday or Wednesday next week. This move would come ahead of the January 10 deadline for the agency to decide whether or not to green-light the ETF application by Ark Invest and 21Shares.

Citing people familiar with the process, Reuters highlighted that asset managers that met their end-of-the-year filing revision deadlines may be able to launch by January 10, 2024. Some of the firms that recently updated their Bitcoin ETF filings with the SEC include Black Rock, Van Eck, Bitwise, WisdomTree, Invesco, Valkyrie, and Fidelity.

Notably, Fidelity Investments revealed more information and technical details about its potential ETF product in its S-1 form update. The asset management firm hopes to beat fellow applicants in winning investors over by proposing the lowest sponsor fee at 0.39%.

Invesco announced a 0.59% rate while offering a fee waiver on the first $5 billion in assets within the first six months after launch. Meanwhile, BlackRock, the world’s largest asset manager and a frontrunner in the Bitcoin ETF race, unveiled Jane Street Capital and JP Morgan Securities as its authorized participants in its updated application. 

From the latest development, it seems the SEC is looking to wrap up the Bitcoin ETF chapter as soon as the new year arrives. Nonetheless, Reuters’ latest report adds optimism to the possibility of the agency approving several ETF applications by January 10.

How Bitcoin ETF Approval Could Impact Price

There have been wide speculations on the possible effects of the ETF approval on the Bitcoin asset. Options platform Greeks.live has offered insight into the potential impact of the exchange-traded fund on the value of the premier cryptocurrency.

Using options data, Greeks.live believes that the market has priced the potential approval of the Bitcoin ETF, and it may not yield greater returns for the asset. This means that the market has already factored in this information, and any positive development might not lead to significant price movement.

According to the platform, this reasoning is based on the little volatility observed across the major term implied volatilities (IVs) and the price of Bitcoin. For context, implied volatility reflects the market’s expectation of how much an asset will move in the future. 

However, options IV on January 12, which is believed to be strongly correlated to the Bitcoin ETF, decreased rather than increased. This lack of volatility and decrease in implied volatility of options suggests that there may not be a substantial impact on the Bitcoin price, even with significant news on the horizon. 

As of this writing, Bitcoin is valued at $42,154, reflecting a mere 0.4% in the past day. The price of BTC has increased by more than 150% this year, partly due to the anticipation of a Bitcoin spot ETF.

Bitcoin ETF

This Bitcoin Historical Pattern Could Send Price To $50,000 Before Major Correction: Analyst

The pioneer cryptocurrency, Bitcoin, has struggled to hold above the $43,000 price mark over the past few weeks. The last seven days have not been much different for the cryptocurrency, which currently trades below $42,000.

However, a popular crypto analyst on the X platform has come forward with an interesting trajectory for the price of BTC in the coming weeks. Based on his projection, investors could see the market leader trade above the psychological $50,000 level – but there is a caveat. 

BTC Price To $50,000 – But What Happens After?

In a recent post on X, prominent crypto trader Ali Martinez put forward a price prediction, stating that Bitcoin’s value could climb as high as $50,000 in the near future. The analyst came up with this projection after identifying and studying a historical pattern on the coin’s price chart on a higher timeframe. 

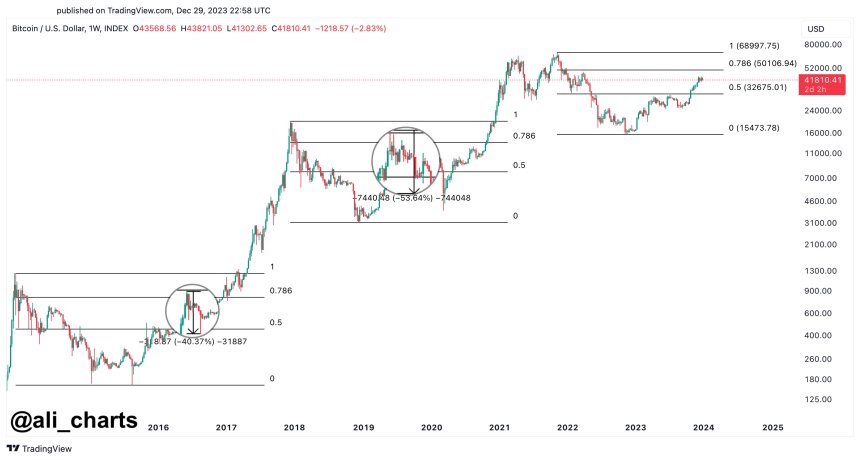
Martinez’s prediction is based on BTC’s price action between 2016 and 2019 on the weekly chart. According to the crypto analyst’s post, the premier cryptocurrency witnessed a major price correction – after reaching a market bottom – when it touched the 0.786 Fibonacci retracement level.

Bitcoin

Martinez believes that current price action mirrors the Bitcoin pattern observed in the last years of the previous decade. Historical price patterns can be helpful in technical analysis and in predicting the future trajectory of a cryptocurrency.

If this history – on the Bitcoin price chart – does repeat itself, investors could see the value of BTC surge toward $50,000. However, Ali Martinez noted that the flagship cryptocurrency could come tumbling down afterward by a significant 40%.

From the current price point, Bitcoin’s journey to $50,000 would mean an almost 20% upward swing. Meanwhile, a 40% decline right after this surge could see the premier cryptocurrency return to around $30,000.

Bitcoin Price Overview

As of this writing, the value of Bitcoin stands at $41,831, representing a 1.5% price decline in the past 24 hours. This recent dip only further reflects the bearish pressure the market leader has had to face in the past week.

According to data from CoinGecko, the Bitcoin price is down by nearly 4% in the last seven days. However, the cryptocurrency has had a fairly successful December, having increased by about 10% in the last month of 2023.

BTC has had one of the best price performances this year, soaring by an outstanding 150% since January. Consequently, Bitcoin retains its spot as the largest cryptocurrency in the sector, with a market capitalization of roughly $823 billion.

Bitcoin

Can Bitcoin Price Climb To $47,000? Here’s What This Crypto Analyst Thinks

The bulls seem to be back in control following the return of the Bitcoin price to above $43,000 this past week. This positive run comes on the back of a period where the premier cryptocurrency struggled, falling below $41,000 at some point.

However, the market leader appears to have regained most of its lost momentum, with new heights now in sight. A popular crypto pundit on the X platform has put forward a new prognosis and set a new target for the Bitcoin price.

BTC Price To $47,000? Here’s What Needs To Happen

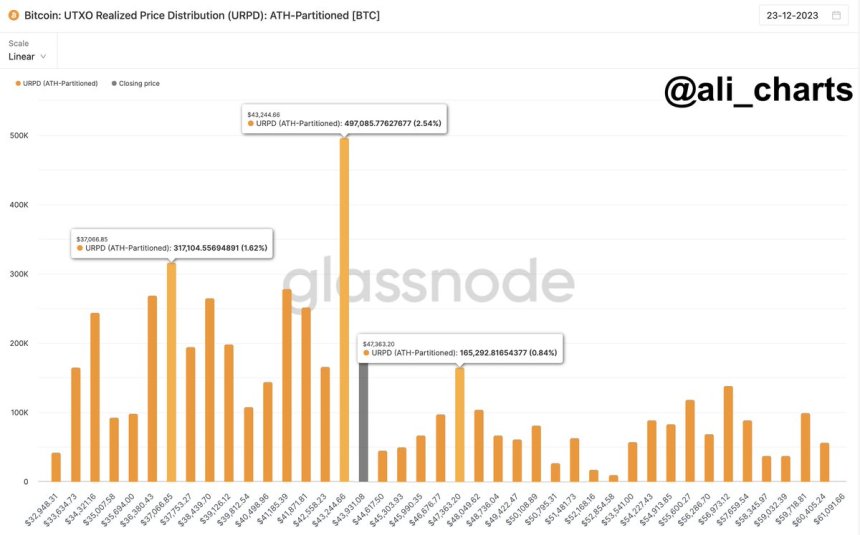
In a post on X, crypto analyst Ali Martinez offered insight into the price action of Bitcoin, explaining the potential movements of the cryptocurrency over the coming weeks. This evaluation is based on the UTXO Realized Price Distribution (URPD) data by the on-chain analytics firm Glassnode.

Bitcoin Price

Martinez identified the $43,200 area as a crucial support level, which can potentially determine the fate of Bitcoin’s price. The premier cryptocurrency broke above this price zone on Wednesday, December 20, and has been trading mostly sideways since.

In his post, Martinez highlighted that so long as the vital $43,200 support holds, the momentum is with the Bitcoin bulls. According to the crypto analyst, staying above this support is one catalyst that could push the Bitcoin price to above $47,360.

On the flip side of his analysis, he noted that the Bitcoin price could possibly undergo a correction. The crypto pundit emphasized that one of the bearish signals to watch out for is a sustained close below the crucial $43,200 mark.

According to Martinez’s projection, a close below $43,200 could send the price of BTC down towards $37,000. This would mean a decline of over 15% from the current price point.

Bitcoin Price Overview

As of this writing, the Bitcoin price stands at $43,783, reflecting a mere 0.5% gain in the last 24 hours. On the weekly timeframe, though, the premier cryptocurrency has shown tremendous recovery to return back to its heights of early January.

According to data from CoinGecko, the value of BTC is up by more than 4.5% in the past seven days. Meanwhile, the coin’s price has surged by nearly 16% in December as the market leader looks to close out the year on a high.

Bitcoin continues to maintain its position as the largest cryptocurrency in the sector, with a market cap of roughly $858 billion.

Bitcoin Price

Optimism Price Up By 34% Today – But Investors Should Watch Out For This Sell Signal

Optimism price has been witnessing significant momentum over the past few days, becoming one of the top gainers in the market today. Thanks to this recent price growth, Optimism has seen its native token OP lay a serious claim to a place within the top 30 cryptocurrencies by market capitalization.

However, it seems that the Optimism price movement may soon be turning bearish following the appearance of a sell signal on the price chart. 

Indicator That Preceded 80% Rally Turns Bearish, Analyst Says

In a recent post on the X platform, crypto analyst Ali Martinez sounded the sell alarm for the OP token. According to the popular crypto pundit, the Optimism price might be in the best range for investors to cash in on their profits.

The reasoning behind this forecast revolves around the TD (Tom DeMark) sequential indicator. Based on Martinez’s analysis, the indicator is currently flashing a sell signal on Optimism’s 12-hour price chart.

The crypto analyst highlighted that a buy signal from the TD sequential indicator preceded a substantial surge in Optimism price earlier in December. And this adds even more weight to the possibility of a bearish turnaround following a sell alarm from the indicator.

Martinez advised investors to think about taking profits right away, given that the OP price may decline and mirror the size of the initial bullish upswing. This projection comes during an exhilarating positive run for OP, putting the altcoin’s bullish trajectory in jeopardy. 

Optimism Price And Network Growth

As of this writing, the Optimism price stands at $3.37, reflecting an almost 34% price increase in the past 24 hours. According to data from CoinGecko, the value of the cryptocurrency has soared by more than 55% in the past week.

The OP coin looks set to end the year as one of the 30 largest cryptocurrencies in the sector, with its market cap recently surpassing $3 billion. This positive performance of the token – in such a short time span – only underscores the increased rate of network growth.

According to recent data from IntoTheBlock, the Optimism network boasts more than 5.9 million addresses with a balance. This represents a nearly 400% surge from 1.2 million in January 2023.

Growth of this caliber and magnitude suggests increased confidence, adoption, and usage of the Optimism network. And if this positive trend is anything to go by, there is a chance the Optimism price won’t be down for long – if the current bearish projection does come true.

Optimism Price