Algorand Market Cap And TVL Skyrocket As ALGO Faces Critical Support Test

Blockchain platform Algorand achieved notable gains in key metrics during the year’s first quarter (Q1), aligning with the overall upward trend observed in the crypto market ecosystem. 

However, despite this growth, its native token ALGO experienced a 22% price decrease since the beginning of Q2, putting a critical support line to the test and raising questions about the cryptocurrency’s prospects.

Algorand Revenue Skyrockets

According to a report by Messari, Algorand’s revenue witnessed a substantial 1,747% quarter-on-quarter (QoQ) surge, primarily driven by a 288% increase in transactions and a 50% rise in the average price throughout the quarter. The Orange memecoin project also contributed to this growth. 

In Q1 2024, ALGO’s commitment to governance on the Algorand platform declined by 60% year-on-year (YoY) and 3% Quarter-on-Quarter, reaching its lowest level in a year at 1.7 billion ALGO staked. 

Algorand

Per the report, this downturn can be attributed, at least in part, to the diminishing governance rewards allocated per governance period. For example, governance participants received 68.2 million ALGO in Q1 2023, but this figure dropped significantly to only 21.9 million ALGO in Q1 2024.

The market cap for stablecoins on the Algorand platform declined 6% QoQ to $73 million. Circle’s USDC market cap on Algorand decreased by approximately 9% QoQ to $50 million. 

In contrast, Tether’s USDT stablecoin market cap remained stable during the same period with no QoQ change, although it recovered 2% of the stablecoin market share. 

Consequently, USDC’s market share decreased by 3% to 68% QoQ, while USDT’s market share increased by 2% to encompass 30% of Algorand’s total stablecoin market cap.

Algorand’s DeFi TVL And Market Cap Lead The Pack

Algorand’s total decentralized finance (DeFi) total value locked (TVL) witnessed growth for the second consecutive quarter, rising by 9% QoQ to $130 million. 

Although TVL experienced a decline in Q3’23 due to Algofi’s deprecation, the entire DeFi market on Algorand rebounded and surpassed Q2’23 levels, nearly reaching the levels seen in Q1’23. 

Folks Finance retained its position as the top DeFi protocol by TVL on Algorand. Even though its TVL fell by 5% QoQ in Q1, it maintained just over 50% market share. 

Algorand

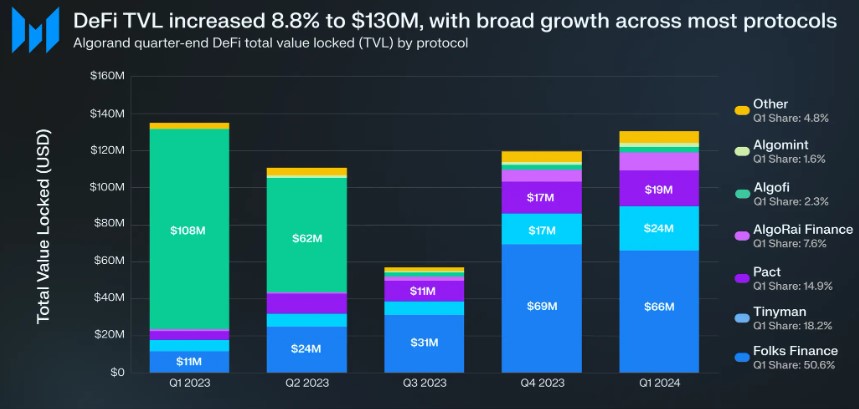
Pact and Tinyman also demonstrated noteworthy gains, capturing approximately 15% and 18% of the DeFi TVL market share in Q1. AlgoRai Finance experienced the most substantial growth, with a remarkable 53% increase in its TVL QoQ.

Lastly, during Q1, Algorand’s market cap expanded by 18% QoQ, reaching $2.1 billion. The global crypto market cap also witnessed significant growth during the same period, nearing all-time highs of around $3 trillion, denoting a 50% increase from the previous quarter. 

Although Algorand capitalized on this upward trend with an 18% increase in its market cap, it experienced a more substantial surge of 123% in the preceding quarter.

Testing Key Support Levels

ALGO’s performance in the early stages of the second quarter has been predominantly bearish. Currently, the token is trading at $0.1935, with a possibility of further testing the support line at $0.1904. A breach of this level could lead to a continuation of the decline towards the next support at $0.1789.

On the upside, the $0.1988 zone presents a significant resistance level for ALGO. Notably, the token has attempted to surpass this threshold three times in the past 10 days without success. 

Algorand

Featured image from Shutterstock, chart from TradingView.com 

FTT Surges 50% On FTX Creditors’ Claims Settlement And Billions In Compensation: How High Can It Rise?

In a significant development, defunct cryptocurrency exchange FTX has unveiled a reorganization plan to reimburse almost all of its customers. 

The announcement has sparked a substantial surge in the exchange’s native token, FTT, which recorded an uptrend of 52% over the past seven days, reaching a monthly high of $2.29 during Wednesday’s early trading session.

FTX Unveils Debt Repayment Strategy

FTX estimates its outstanding debts to creditors to be approximately $11.2 billion, as revealed in the reorganization plan published late Tuesday. The company has disclosed that it possesses between $14.5 billion and $16.3 billion, which it intends to distribute among the creditors.

Under the proposed plan, customers with $50,000 or less claims will receive approximately 118% of the allowed claim amount. This compensation is slated to be disbursed to around 98% of the creditors, relieving FTX customers who have experienced locked funds since the exchange filed for bankruptcy protection in November 2022. 

FTX stated in a press release on Wednesday that the company could not utilize the appreciation of the missing tokens during the Chapter 11 cases. Instead, FTX had to identify other recoverable sources of value to repay creditors. 

Following the departure of founder Sam Bankman-Fried, FTX appointed John Ray III as CEO. Ray, speaking on the matter in November 2022, expressed his astonishment at the “complete failure of corporate controls and such a complete absence of trustworthy financial information” witnessed at FTX. Ray further stated in the press release on Wednesday: 

We are pleased to be in a position to propose a Chapter 11 plan that contemplates the return of 100% of bankruptcy claim amounts plus interest for non-governmental creditors. 

FTX’s founder, Sam Bankman-Fried, faced legal consequences, being convicted on seven criminal counts, including charges related to embezzling billions of dollars from FTX’s customers. Bankman-Fried was subsequently sentenced to 25 years in prison.

FTT Bulls Eyeing $2.55 For Potential Breakout Continuation

As of the latest update, the price of FTT has corrected to $2.050 after reaching its monthly high. This breakout occurred after consolidation between the $1.17 and $1.48 levels.

At the current price level, FTT faces a significant resistance at $2.169, which has led to the ongoing correction. If FTT sustains its bullish momentum, the next resistance level to watch is $2.55 in the token’s daily chart. 

A successful breakthrough of this level could potentially lead to a retest of the $3 mark, which has not been revisited since January.

On the other hand, if the price experiences a further correction, FTT bulls should closely monitor the $1.95 and $1.765 levels, as they serve as crucial support levels. It is essential to prevent a loss of the gains achieved over the past month, which amounts to an 18% increase during this period.

FTX

Featured image from Shutterstock, chart from TradingView.com

Bitcoin ETF Issuer Franklin Templeton Bullish On Solana (SOL), Foresees It As 3rd Largest Crypto

In the wake of the November 2022 crypto market crash, which saw the bankruptcy and collapse of FTX and other firms, Solana (SOL) has emerged as a standout performer, experiencing a year-to-date price increase of over 560%. 

With a market capitalization of $67 billion, Solana has secured its place as the fifth largest cryptocurrency, trailing only Bitcoin (BTC), Ethereum (ETH), Binance Coin (BNB), and Tether’s USDT stablecoin.

Despite its substantial growth, asset management giant and Bitcoin exchange-traded fund (ETF) issuer Franklin Templeton anticipates further expansion for Solana as the emerging bull market takes shape. 

Solana Poised For Continued Growth

A recent report released by the firm highlights Solana’s strong position to capture the next wave of crypto adoption, solidifying itself as a major crypto asset alongside Bitcoin and Ethereum.

The report emphasizes that Solana’s growth will continue due to several key factors. Notably, the crypto industry witnessed accelerated activity during Q4 2023, with Solana as a focal point for major airdrops within its ecosystem, such as Jito and Pyth. 

According to the report, these airdrops generated a wealth effect of over a billion dollars, driving up the value of SOL and other Solana ecosystem tokens, particularly meme coins. This surge occurred concurrently with Bitcoin’s upward trend, providing additional momentum to the Solana ecosystem.

Since then, meme coins have gained significant attention, with a substantial portion of activity occurring on Solana. The network has witnessed the creation and trading of numerous meme coins, with some attaining multi-billion-dollar market caps, including Bonk (BONK) and Dogwifhat (WIF).

The Crypto Industry’s Next Big Breakthrough?

According to the asset manager, Solana has demonstrated significant growth over the past year, which is evident in the network’s increased total fees and decentralized exchange (DEX) volumes. The network’s low fees, transaction latency, and high data throughput relative to other networks have contributed to its success. 

Solana’s network effects are expected to strengthen further as its performance improves, positioning it to capture upcoming trends in the crypto space.

The future remains uncertain as crypto enthusiasts ponder the next big thing in the industry. However, Franklin Templeton suggests that there is a strong possibility that Solana could play a pivotal role. 

According to the report, the Solana ecosystem anticipates additional airdrops in the coming months, which will continue to enhance the ecosystem’s wealth effect. 

Moreover, meme coin activity shows no signs of slowing down on the Solana network, further adding to the bullish sentiment surrounding the cryptocurrency and its ecosystem.

Solana

SOL is now attempting to consolidate above the $150 level and has seen a significant 21% increase in the last seven days alone. 

Featured image from Shutterstock, chart from TradingView.com 

Fantom (FTM) Bull Run: 8% Price Surge And Robust Double-Digit Growth In Key Metrics

Fantom (FTM), a Layer-1 (L1) protocol, and its native token, FTM, have experienced significant gains and notable achievements in the first quarter (Q1) of 2024. 

According to a comprehensive performance analysis conducted by Messari, amid the emerging crypto bull market, Fantom has emerged as one of the major beneficiaries, showing significant growth in key metrics and market capitalization. 

FTM Market Cap Soars 101% QoQ

By the numbers, FTM’s circulating market capitalization saw a substantial 101% quarter-over-quarter (QoQ) increase, jumping from $1.3 billion to $2.6 billion, vaulting it up ten spots to 48th among all tokens (currently 58th). The token’s rally extended for two consecutive quarters, resulting in a fourfold increase since the end of Q3 2023.

Fantom

Although Fantom experienced a decrease of 53% QoQ in revenue measured in FTM, amounting to 1.8 million FTM, revenue denominated in USD exhibited a 4% QoQ increase, reaching $1.2 million. 

According to Messari, the revenue decline was primarily due to reduced inscription activity across all smart contract platforms in Q1. 

Despite this, Fantom maintained an upward trend in average daily transactions, excluding inscription-related activity, surpassing the Q3 average and reaching 247,000 daily transactions. Daily active addresses also rebounded, rising by 24% QoQ to 40,500.

In Q1, the staking requirement for Fantom validators was significantly reduced from 500,000 FTM to 50,000 FTM, aiming to increase accessibility. However, the number of active validators remained unchanged at 55. 

Notably, the total amount of FTM staked increased by 17% QoQ, from 1.1 billion to 1.3 billion FTM, resulting in a 135% QoQ surge in the total dollar value of staked FTM, reaching $1.2 billion. Among proof-of-stake (PoS) networks, Fantom ranked 22nd in the dollar value of funds staked by the end of Q1.

Memecoin Mania Boosts Fantom On-Chain Activity

During the year’s first quarter, Total Value Locked (TVL) denominated in USD experienced a substantial 59% QoQ increase, rising from $810.8 million in Q4 to $1.28 billion. 

Conversely, TVL-denominated in FTM decreased by 21% QoQ, indicating that the surge in USD-denominated TVL was partly attributed to FTM’s price appreciation.

Fantom’s average daily decentralized exchange (DEX) volume surged by 64% QoQ, from $10.2 million to nearly $176.8 million. In Q1, the “Memecoin Mania” trend contributed to elevated on-chain activity across various networks, including Fantom.

Fantom

Fantom’s monthly DEX volume surpassed $1 billion in March, marking the first time since March 2023. The number of DEXs on Fantom increased to 31 by the end of Q1, with no single DEX dominating more than 30% of the market share.

Lastly, following an exploit in the Multichain: Fantom Bridge, which affected stablecoins on Fantom in Q3 2023, the Fantom Foundation took steps to increase the liquidity of stablecoins. 

As of Q1 2024, two independent third-party bridging solutions, Axelar (axlUSDC and axlUSDT) and LayerZero (lzUSDC and lzUSDT), have emerged. USDC remains the predominant stablecoin on Fantom, accounting for 98% of the stablecoin market cap. USDT also experienced considerable growth, with an 86% QoQ increase.

Fantom

The FTM token is currently trading at $0.7037, reflecting an 8.7% increase in price over the past seven days. However, it has experienced a decline of nearly 20% in the monthly time frame.

Featured image from Shutterstock, chart from TradingView.com

NEAR Price Rally: 9% Surge Recaptures Key Level, Records 160% TVL Growth In Q1

Decentralized application (dApp) platform Near Protocol exhibited notable growth in key metrics during the first quarter (Q1) of 2024, driving its native token NEAR to reclaim a crucial key level and paving the way for a potential retest of its all-time high (ATH) from January 2022. 

According to a recent report by Messari, NEAR experienced significant increases in market capitalization, revenue, active addresses, and Total Value Locked (TVL), solidifying its position among the top players in the cryptocurrency market.

NEAR Outperforms Bitcoin And Ethereum

In Q1 2024, NEAR’s circulating market cap surged to $7.2 billion, marking a 94% quarter-on-quarter (QoQ) increase. The fully diluted market cap also witnessed substantial growth, reaching $8.2 billion, representing a 91% QoQ increase. These numbers propelled NEAR to secure a spot among the top 20 cryptocurrencies by market capitalization. 

NEAR

Notably, NEAR outperformed Bitcoin (BTC) and Ethereum (ETH), which recorded QoQ growth rates of 69% and 53%, respectively. Additionally, NEAR’s revenue, derived from network transaction fees, witnessed an 82% QoQ increase, reaching $1.9 million. 

NEAR continued its address growth trend in Q1 2024, with average daily active addresses reaching 1.2 million, representing a robust 42% QoQ increase. 

The network also witnessed a surge in daily new addresses, totaling 236,000 (a 37% QoQ increase), and surpassed the milestone of 100 million total accounts. 

According to Messari, contributions from established protocols like KAIKAINOW, Sweat, and Playember and the adoption of HOT Wallet, averaging over 350,000 daily active addresses in March and nearly 3 million total wallets, drove this expansion.

Stablecoin Market Cap Soars In Q1

Per the report, the protocol experienced a sustained increase in transaction activity throughout Q1 2024, with daily transactions reaching 4.3 million, representing a 78% QoQ increase and a 538% increase over the last six months. 

Similarly, NEAR’s TVL witnessed substantial growth, ending the quarter at $335 million, a 163% increase from the previous quarter and a 547% increase over the last six months. 

NEAR

Furthermore, NEAR’s decentralized exchange (DEX) volume experienced a notable surge, with an average daily volume of $8 million, representing a 95% QoQ increase. Ref Finance emerged as the leading DEX on the protocol, with $6 million daily volume, surpassing Orderly Network.

Lastly, NEAR observed a significant increase in its stablecoin market cap during Q1 2024, soaring 176% QoQ to $214 million. Notably, USDT experienced a significant surge, with its market cap increasing by 1,155% QoQ, reaching $88 million. 

Outperforming Top 20 Cryptocurrencies

Regarding price action, NEAR Protocol’s native token has exhibited strong performance, surpassing the top 20 cryptocurrencies in the market with a 9.4% uptrend in the past seven days. Meanwhile, Bitcoin has experienced a minor 1.5% price correction over the past 24 hours.

This positive trend has enabled NEAR to reclaim the significant $7.40 price level, which is important for bullish investors

Looking ahead, the $7.60 mark may present a potential resistance level for the token, serving as a crucial barrier to monitoring. It could pave the way for a retest of the $8 mark, signaling further upward momentum if successfully breached.

Conversely, the $6.80 mark has demonstrated its significance as a key support level. It was previously tested over the weekend and effectively prevented a more significant price decline. 

Despite the optimistic outlook, it is important to note that the token remains down by over 64% from its all-time high of $20.4, reached in 2022.

NEAR

Featured image from Shutterstock, chart from TradingView.com 

Study Uncovers Surprising Data: 90% Of Stablecoin Transactions Not Driven By Human Users

In a recent report by Bloomberg, it has been revealed that more than 90% of stablecoin transaction volumes do not originate from genuine users, according to a new metric co-developed by Visa.

Stablecoin Market Faces Data Reality

Visa and Allium Labs have created a dashboard designed to filter out transactions initiated by bots and large-scale traders to isolate those made by real individuals. Out of approximately $2.2 trillion in total transactions recorded in April, a mere $149 billion was identified as “organic payments activity” by Visa.

The data challenges the optimistic outlook of stablecoin proponents who believe these tokens can transform the $150 trillion payments industry. 

Fintech giants such as PayPal Inc. and Stripe Inc. have been exploring stablecoins, with Stripe co-founder John Collison expressing bullishness on the tokens due to “technical improvements.” 

Pranav Sood, the executive general manager for EMEA at payments platform Airwallex, commented on the findings: “It says that stablecoins are still in a very nascent moment in their evolution as a payment instrument.” 

Sood emphasized the need to focus on increasing existing payment infrastructure in the short and mid-term while acknowledging the long-term potential of stablecoins.

Accurately tracking crypto activity’s “real” value using blockchain data has always been challenging. Glassnode, a data provider, estimates that the record $3 trillion assigned to digital tokens at the bull market’s peak in 2021 was closer to $875 billion.

Analysts Predict Massive Surge Ahead

According to Bloomberg, the nature of stablecoin transactions often leads to double-counting, depending on the platform users employ for fund transfers. For example, converting $100 of Circle’s USDC stablecoin to PayPal’s PYUSD on the decentralized exchange (DEX) Uniswap would result in $200 of total stablecoin volume being recorded on-chain.

Visa, which processed over $12 trillion the previous year, could suffer if stablecoins gain widespread acceptance as payment. 

Interestingly, despite this troubling data, analysts at Bernstein predicted that the total value of all stablecoins in circulation could reach $2.8 trillion by 2028, nearly 18 times their current combined circulation.

While PayPal and Stripe have made strides in adopting stablecoins, Airwallex has observed limited demand for stablecoin-based payment solutions among its customers, primarily due to concerns about “user-friendliness.” 

Sood emphasized the significant barrier of overcoming entrenched payment methods, citing the continued use of checks for 40% to 60% of business payments in the United States.

The Bloomberg report sheds light on the dominance of non-genuine user activity in stablecoin transactions. The study underscores the importance of improving existing payment infrastructure and addressing user-friendly concerns to unlock the long-term potential of stablecoins.

Stablecoin

Featured image from Shutterstock, chart from TradingView.com

Record-Breaking Q1 For Polkadot: Daily Active Addresses Hit 514,000 As DOT Price Surges 7%

According to a Messari report, the Polkadot (DOT) blockchain protocol made significant progress in the first quarter (Q1) of the year in terms of market capitalization, revenue, and Cross-Consensus Message Format (XCM) activity, as well as a record increase in daily active addresses.

DOT’s Market Cap Surges 16% QoQ

During Q4 2023, Polkadot’s market capitalization experienced a notable 111% quarter-on-quarter (QoQ) increase, reaching $8.4 billion. Building on this momentum, Q1 2024 witnessed a further 16% QoQ rise, elevating the circulating market cap to $12.7 billion. 

Despite these gains, DOT’s market capitalization remains 80% below its all-time high of $55.5 billion, set on November 8, 2021. 

Polkadot

In Q4 2023, Polkadot’s revenue also skyrocketed by 2,880% QoQ, amounting to $2.8 million. Per the report, this surge was primarily attributed to an exponential increase in extrinsics, driven by the Polkadot Inscriptions. 

However, revenue metrics for Q1 2024 declined significantly on a QoQ basis, with revenue in USD dropping by 91% to $241,000 and revenue in DOT decreasing by 92% to 28,800. It is worth noting that Polkadot’s revenue tends to be relatively lower compared to its competitors due to the network’s structural design.

Polkadot’s XCM activity continued to show growth in Q1 2024. Daily XCM transfers surged by 89% QoQ to reach 2,700, while non-asset transfer use cases, known as “XCM other,” witnessed a 214% QoQ increase, averaging 185 daily transfers. 

The total number of daily XCM messages grew 94% QoQ to 2,800, demonstrating the network’s dynamic ecosystem. In addition, the number of active XCM channels grew 13% QoQ to a total of 230.

Polkadot’s Parachain Network Soars To New Heights

Q1 2024 marked a significant kick-off to the year for Polkadot’s parachains, with active addresses reaching an all-time high of 514,000, representing a substantial 48% QoQ growth. 

Moonbeam emerged as the leading parachain with 217,000 monthly active addresses, a solid 110% QoQ increase. Nodle followed closely with 54,000 monthly active addresses, doubling from the previous quarter. 

Polkadot

Astar on the other hand, experienced a modest 8% QoQ growth to reach 26,000 active addresses, while Bifrost Finance grew slightly by 2% QoQ to 10,000 addresses. However, Acala experienced a decline, with monthly active addresses falling to 13,000, down 16% QoQ.

Notably, the Manta Network stood out among parachains in Q1 2024, with a significant surge in daily active addresses, reaching 15,000. According to Messari, this increase was fueled by the successful launch of the MANTA token TGE and subsequent listing on Binance, propelling Manta’s Total Value Locked (TVL) to over $440 million. 

Polkadot Price Sees Upside Potential Ahead

In terms of price action, Polkadot’s native token DOT has regained bullish momentum following a sharp drop to the $5.8 price mark after reaching a yearly high of $11 on March 14. 

Currently, DOT has regained the $7.25 level, up 7% over the past week. However, DOT’s trading volume decreased slightly by 4.7% compared to the previous trading session, amounting to $320 million over the past 24 hours, according to CoinGecko data.

Polkadot

If the bullish momentum persists, Polkadot faces its first resistance at the $7.4 zone, which serves as the last threshold before a potential retest of the $8 resistance wall. 

On the other hand, the $6.4 support floor has proven to be successful after being tested for two consecutive days this week, highlighting its significance as a key level to watch for the token’s upward movement prospects.

Featured image from Shuttestock, chart from TradingView.com

Bitcoin Price Surges Towards $61,000, Eyeing Potential Breakout To $67-$68k Range

Bitcoin (BTC), the largest cryptocurrency in the market, has experienced a notable resurgence in its bullish momentum, with the Bitcoin price reclaiming the crucial $61,000 threshold. 

This recovery follows a week-long downtrend that led to a 20% drop to $56,000 on Wednesday. As the bullish momentum returns, the possibility of further testing upper resistance levels and reclaiming previously lost price levels grows stronger.

Bitcoin Bulls Eye $68,000

According to market expert Justin Bennett, a recovery of the $61,000 resistance level would open up potential areas such as $67,000 to $68,000. However, at the present moment, this level continues to pose a significant resistance.

Analyzing the recent correction in the Bitcoin price, analyst Crypto Con suggests that the market correction was necessary for the long-term price trajectory. 

The full retest of the 20-week Exponential Moving Average (EMA) support at $56,700 and the return to indicator support zones, such as the Directional Movement Index, indicate a healthy price consolidation.

In addition to the technical indicators, on-chain and market data analytics firm CryptoQuant’s founder and CEO, Ki Young Ju, highlights the current bullish sentiment. 

Bitcoin price

According to their data, whales accumulated a significant amount of Bitcoin, totaling 47,000 BTC, within the past 24 hours. This increased accumulation by large investors further bolsters the positive outlook for Bitcoin’s price.

Bitcoin Price Poised For Bullish Surge

Crypto analyst Titan of Crypto has provided further bullish predictions for the Bitcoin price, suggesting that recent corrections have resulted in the grabbing of leverage longs liquidity. In addition, the Stochastic Relative Strength Index (RSI)on the 5-day chart is on the verge of crossing into bullish territory. 

This occurrence has historically been followed by an upward price movement in Bitcoin, leading to higher highs. Such a pattern has the potential to fuel renewed investor confidence and attract further buying pressure.

Another positive signal highlighted by Titan of Crypto is the recent buy signal generated by the Supertrend indicator, as seen in the chart below. This technical tool helps identify trends in an asset’s price movement. 

Bitcoin Price

The buy signal, which occurred just three months ago, implies that Bitcoin may still have significant room for growth before reaching its cycle top. According to the analyst, historical data suggests that the average duration from the buy signal to the cycle top is approximately 19 months, indicating the potential for a sustained upward trend.

Bitcoin price

Currently trading at $61,600, Bitcoin has seen a significant increase of 4.7% in the last 24 hours alone. It remains to be seen if BTC will successfully break above resistance levels, while also challenging the ability of previously retested support levels to withstand potential future downtrends.

Featured image from Shutterstock, chart from TradingView.com

Friend.tech Token Launch Turns Into A Nightmare As Price Dives 98%

The decentralized social network Friend.tech, launched in August 2023, is facing a significant setback as its native token, FRIEND, experiences a staggering 98.5% drop in value. 

Investors who participated in the recent airdrop of FRIEND tokens have expressed serious concerns about the development, highlighting issues with token claiming and app functionality.

Investors Hit Hard As FRIEND Token Crashes

Upon its debut, the FRIEND token entered the market with a trading price of $169 per token, attracting 18,000 holders, and boasting a circulating supply of 14 million tokens. 

However, the current trading price has plummeted to approximately $1.26, resulting in a market cap of $27.7 million and liquidity of $5.4 million, according to DexScreener data, leaving many investors frustrated. 

Friend.tech

The airdrop process, which aimed to distribute tokens to the community, has faced its fair share of challenges. Users on social media site X (formerly Twitter) expressed frustration over the declining value of their airdropped tokens. 

Some claimants experienced difficulties claiming their tokens, while others reported watching the value of their holdings diminish significantly in hours. 

One user even accused a prominent figure of orchestrating a rug pull, further fueling the community’s discontent. 

DeFi Researcher Slams Friend.tech V2 Launch

Despite the current downturn, some crypto analysts predict a potential recovery for the FRIEND token. Notably, crypto analyst Daan Crypto Trades suggests that the token’s value may rise in the future, emphasizing that market sentiment may change once users start to see returns on their investments.

However, concerns remain regarding the functionality of the Friend.tech app, which experienced significant issues during its initial weeks.

DeFi researcher DeFi Ignas expressed disappointment in Friend.tech’s V2 launch, describing it as a “massive flop.” Ignas criticized the app’s usability issues and questioned whether the team’s focus was misplaced during development. Speculation arose regarding whether the team deliberately orchestrated a price decline to prompt a subsequent surge in value.

Despite this, the self-proclaimed number one creator on Friend.tech’s platform, using the pseudonym “Captain Levi,” stated the following in support of the token:

The dump is brutal but actually healthy as jeeters sell at heavily discounted prices while real users have not even waken up to the full potential of V2 and money clubs given the app barely works. think we already saw bottom and price should slowly recover as users buy clubs

As Friend.tech grapples with the challenges surrounding the FRIEND token, the crypto community eagerly awaits improvements in app functionality and a potential revival of the token’s value. 

Friend.tech

Featured image from Shutterstock, chart from TradingView.com

TON Price Soars 9% On Pantera Capital’s Investment, Capitalizing On Telegram User Potential

Venture capital firm Pantera Capital has invested significantly in The Open Network blockchain. The news, announced on Thursday, resulted in a 9% surge in the network’s native token, Toncoin (TON), pushing its value above the $5 mark.

Pantera Capital Bullish On TON And Telegram Integration

In a statement, Pantera Capital expressed enthusiasm about their latest investment in TON. The Layer 1 network, initially conceived by Telegram and continued by the open-source community, can potentially introduce cryptocurrency to the masses due to its extensive usage within the Telegram network. 

Telegram, used by over 900 million monthly active users, is known for personal and group communication, community building, content sharing, and more. Pantera Capital believes that by leveraging Telegram’s vast user base and user experience, combined with TON’s growing ecosystem, the network could become one of the largest in the cryptocurrency space. Pantera’s announcement further reads:

We at Pantera Capital are thrilled to announce our latest investment in TON, a Layer 1 network originally designed by Telegram and continued by the open-source community.  We believe TON has the capacity to introduce crypto to the masses because it is used extensively within the Telegram network. 

The integration of TON with Telegram aligns with the platform’s vision of providing a “seamless” and “borderless” experience for peer-to-peer (P2P) payments within its user base. 

Tether’s Integration With The Open Network

As previously reported by NewsBTC, Tether, the company behind the largest stablecoin in the market, USDT, recently announced the launch of its USDT dollar-pegged token and Tether Gold (XAUT) on The Open Network. 

This integration further increases the potential for P2P payments within Telegram’s extensive user base, a prospect that Pantera Capital aims to capitalize on.

In addition to the investment in TON, Pantera Capital is actively pursuing the launch of a new fund, Pantera Fund V, to raise over $1 billion. This fund aims to provide investors with diverse investment options across the blockchain asset spectrum, encompassing startup equity, early-stage tokens, and liquid tokens.

The new fund has established a minimum investment threshold of $1 million for qualified investors, and the first close is scheduled for April 1, 2025. 

Insiders familiar with the matter have indicated that Pantera Fund V is anticipated to reach a similar size as its predecessor, which successfully amassed approximately $1.25 billion in capital two years ago.

TON

Following the disclosure of Pantera Capital’s investment in The Open Network, the price of TON experienced a notable 9% surge on Thursday, reaching a current trading price of $5.09. This increase comes after a significant price decline, with TON dropping as low as $4.6 after reaching its all-time high (ATH) of $7.65 in mid-April.

Featured image from Shutterstock, chart from TradingView.com 

Eclipse And Neon EVM Drive Solana-Ethereum Integration For Blockchain Interoperability

Layer 2 (L2) blockchain Eclipse and developer-oriented bridge Neon EVM have formed a new collaboration to implement changes in the blockchain landscape, increasing interoperability and scalability with the integration of Ethereum (ETH) and Solana (SOL). 

Aiming to combine the capabilities of both blockchains, Eclipse has consolidated the compatibility between the Ethereum Virtual Machine (EVM) and the Solana Virtual Machine (SVM) by deploying Neon Stack.

Solana And Ethereum Integration 

The primary objective of this collaboration is to integrate Solana’s transaction handling capabilities, which can process thousands of transactions per second, into Ethereum

This integration will be facilitated by Neon Stack, a standardized development stack that enables smart contract developers to achieve Ethereum Virtual Machine compatibility on Solana Virtual Machine-based blockchain networks. Eclipse plans to leverage Neon Stack on its SVM L2 to facilitate this integration.

The Neon Stack consists of Neon EVM smart contracts and Neon Proxy. It has been live on the Solana mainnet since July 2023. It has deployed numerous Ethereum-native Solidity decentralized applications (dApps), including decentralized finance (DeFi), gaming, and decentralized exchanges (DEXs), on Solana from its existing codebase. 

Neon EVM-Eclipse Partnership For Cross-Chain Development

Davide Menegaldo, Chief Commercial Officer (COO) of Neon EVM, expressed enthusiasm for Neon Stack and the collaboration, stating: 

With Neon Stack, we are paving the way for high-performance, scalable dApps infrastructure that transcends the limitations of traditional blockchain architectures and redefines computational efficiency. We are pleased to see Eclipse as the first industry partner to utilize the Neon Stack.

On the other hand, Neel Somani, founder of Eclipse Labs, the company behind the development of the Layer 2 blockchain, also emphasized the importance of the partnership, saying:

Our collaboration with Neon Stack enables developers to seamlessly deploy their dApps from EVM chains to Eclipse, further strengthening the harmonization between Solana and Ethereum. Solidity developers who wish to build on a high-performance L2 that leverages the strengths of the SVM can finally do so.”

Interestingly, the Ethereum ecosystem hosts over 13,000 dApps, with only a small fraction, 0.4%, cross-chained with Solana. This collaboration between Neon EVM and Eclipse could also provide further opportunities for developers to build new dApps with the new integration. 

In sum, it is believed that developers will be able to build advanced dApps that leverage the features of Ethereum and Solana, along with their respective native ecosystems and virtual machines, by leveraging the design of the NEON Stack and Eclipse.

Neon EVM

As of the current update, the native token of NEON EVM, NEON, is trading at $1.0135. It has shown a 2.6% recovery over the past 24 hours, aligning with the overall positive movement in the cryptocurrency market. However, during the past 7 days, the token has witnessed a price decline, experiencing a nearly 8% drop.

Featured image from Shutterstock, chart from TradingView.com 

Market Downturn? Not For Optimism: A16z’s Major OP Purchase Sends Price Skyrocketing By 9%

In a month marked by a challenging correction in the crypto market, Layer 2 (L2) blockchain protocol Optimism has emerged as a standout performer. Within the past 24 hours, Optimism’s native OP token skyrocketed by 9%, positioning it as the best-performing token among the top 100 cryptocurrencies. 

Behind this surge lies venture capital firm a16z, which has reportedly invested around $90 million in Optimism’s OP token, signaling further institutional support for the layer 2 protocol. 

OP Receives Major Investment

Sources familiar with the matter have revealed to Unchained that a16z has acquired a significant stake in Optimism’s OP token. 

The investment, which comes with a two-year vesting period, underscores a16z’s interest in the Layer 2 protocol and aligns with its growing involvement in crypto. Notably, a16z’s portfolio already includes crypto exchange Coinbase. 

The investment by a16z comes amidst notable activity and growth within the Optimism ecosystem. Optimism’s OP Stack has experienced increased usage, further validating its value proposition. The protocol’s ability to increase scalability and reduce fees on the Ethereum blockchain has also garnered significant attention. 

Optimism’s spokesperson expressed enthusiasm for the investment, acknowledging the energy and momentum surrounding the protocol. The partnership with a venture capital firm like a16z is expected to fuel further development and innovation within the Optimism ecosystem.

On March 7, the Optimism Foundation disclosed the sale of approximately 19.5 million OP tokens, valued at nearly $90 million, to an undisclosed buyer. 

These tokens were reportedly sourced from a 30% pool of OP’s original treasury, dedicated to the foundation’s working budget. Reports indicated that the buyer could delegate their tokens to third parties, enabling them to participate in Optimism’s governance.

The foundation clarified that, due to the private nature of the sale, specific details regarding the terms and purchaser were not disclosed. 

Key Levels To Watch For Optimism

Despite the recent surge in the Optimism ecosystem and its native token OP, the token still trades well below its all-time high (ATH) reached on March 6, 2024, currently down over 47% from that level.

However, OP’s trading volume has experienced a notable surge, indicating continued interest in the token. According to CoinGecko data, the OP trading volume has increased by over 113% compared to the previous trading day on April 30, amounting to nearly $600 billion in 24 hours.

Optimism

Key levels to monitor for the token soon include OP’s significant resistance at the $2.62 price mark and a potential retest of the $3 zone. 

However, a clear indication of a positive trend for the Optimism token would require a successful consolidation above the $3.92 zone, marking the end of the month-and-a-half downtrend structure.

Conversely, the $2.37 zone has proven to be a crucial support level for OP, as it has held for the past five days and prevented further price decline for the token. 

Digging deeper, the $2.25 mark is also a key support, with the most critical support level at $2.11. This level holds the key to Optimism’s macro bullish structure, as it initiated the token’s current uptrend.

Featured image from Shutterstock, chart from TradingView.com 

Stablecoin Giant Tether Strikes Gold: Achieves Record Net Profit Of $4.5 Billion In Q1

Stablecoin issuer Tether, a prominent player in the cryptocurrency market behind the widely used USDT stablecoin, has released its audit statement for the first quarter of 2024, accompanied by a report conducted by independent accounting firm BDO. 

The report, which provides additional financial information beyond the reserves backing Tether’s fiat-denominated stablecoins, shows the company’s profit for the first quarter of the year, which saw an increased influx of capital into the market. 

Tether Q1 2024 Financials Soar

Digging into the numbers, the first quarter of 2024 proved highly profitable for Tether, with a net profit of $4.52 billion. 

The main contributors, the entities responsible for issuing stablecoins and managing reserves, reportedly generated approximately $1 billion of this profit from net operating gains, primarily from US Treasury holdings. The remaining profits were attributable to mark-to-market gains on Bitcoin (BTC) and gold positions.

The report also highlighted Tether’s success in increasing its direct and indirect holdings of US Treasuries to over $90 billion. This includes indirect exposure through overnight reverse repurchase agreements collateralized by US Treasuries and investments in US Treasuries through money market funds.

Tether

In a sign of significant growth, Tether also disclosed its net equity for the first time, revealing a figure of $11.37 billion as of March 31, 2024. This is an increase from the $7.01 billion equity reported as of December 31, 2023. 

The report also highlighted a $1 billion increase in excess reserves, which support the company’s stablecoin offerings, bringing the total to nearly $6.3 billion.

CEO Emphasizes Transparency And Stability

The BDO confirmation reiterated that Tether-issued tokens are 90% backed by cash and cash equivalents, underscoring the company’s stance on maintaining liquidity within the stablecoin ecosystem. Furthermore, the report revealed that over $12.5 billion worth of USDT was issued in the first quarter alone.

Tether Group’s strategic investments, which exceed $5 billion as of the report date, span various sectors, including artificial intelligence (AI) and data, renewable energy, person-to-person (P2P) communication, and Bitcoin Mining. 

In response to the latest report, Paolo Ardoino, CEO of Tether, expressed the company’s commitment to transparency, stability, liquidity, and responsible risk management. 

Ardoino highlighted Tether’s record-breaking profit benchmark of $4.52 billion and the company’s efforts to increase transparency and trust within the cryptocurrency industry. Ardoino further claimed:

In reporting not just the composition of our reserves, but now the Group’s net equity of $11.37 billion, Tether is again raising the bar in the cryptocurrency industry in the realms of transparency and trust. 

Tether

Featured image from Shutterstock, chart from TradingView.com

Solana Projected To Reach $500 This Year Despite Market Meltdown, Expert Predicts

Solana (SOL), currently ranked as the fifth largest cryptocurrency with a market capitalization of $56 billion, has experienced a significant decline amid the recent market meltdown affecting the digital asset space. 

Over the past 24 hours, SOL has witnessed an 8% drop, reflecting the broader market downturn. Despite this setback, experts believe that if the cryptocurrency maintains support above the $120 price level, it holds notable potential for a strong price recovery in the coming months.

Bullish Price Outlook And Key Support Levels To Watch 

After reaching a yearly high of $209 on March 18, SOL’s current trading price is $124. However, according to crypto market experts, SOL still has a promising outlook. 

Altcoin Sherpa, a renowned analyst, suggests that if the altcoin market continues to decline, the $120 price level may become an area of significant interest for SOL. 

Altcoin Sherpa maintains a bullish sentiment, strongly believing that SOL can potentially exceed $500 this year. Such a surge would represent a significant 300% price increase from current levels, building upon the impressive 426% year-to-date price growth

It is worth noting that this projection is nearly double SOL’s previous all-time high (ATH) of $259, reached during the last crypto market bull run in November 2021.

Solana

In addition to the analyst’s focus on the $120 price mark, other major resistance levels for SOL have been identified. These include $110, $102, and the critical long-term support level at $74, representing SOL’s uptrend structure over the past six months. 

Solana Dominates Blockchain Trading Volume

According to a recent CoinGecko report, Solana has secured its position as the second-largest blockchain by trading volume, commanding a substantial 21.3% market share in March 2024. 

The blockchain platform experienced a notable monthly growth of 244.8%, with trading volume surging to $40.05 billion, a significant increase from $11.61 billion in February. 

Solana’s performance in the first quarter of 2024 was equally significant. It accounted for 14.4% of all decentralized exchange (DEX) trading volume, totaling $62.31 billion. 

This represents a quarter-on-quarter (QoQ) growth of 242.7% compared to the previous quarter’s volume of $18.18 billion. Despite strong growth, Solana’s market share in the same quarter ranked fourth, trailing behind Binance Smart Chain (BSC).

Solana

According to CoinGecko, Solana’s trading volume has been greatly bolstered by several factors. Firstly, the doubling in the price of Solana’s native token, SOL, has attracted increased attention and trading activity on the platform. 

Additionally, the network has witnessed large airdrops from projects such as Jito (JTO) and Jupiter (JUP), further fueling trading volume. Moreover, the surge in memecoins on the Solana network has significantly contributed to its trading volume. 

Notably, the launch of Book of Memes (BOME) in March proved successful, as it achieved a market capitalization of $1 billion within two days. BOME also secured listings on crypto exchanges like Binance and Bybit, further amplifying trading activity on Solana.

Featured image from Shutterstock, chart from TradingView.com

BREAKING: Former Binance CEO CZ Behind Bars: Sentenced To Jail For 4 Months

In a significant development for the crypto industry, Changpeng Zhao, commonly known as CZ, the founder of Binance, the world’s largest cryptocurrency exchange, has been imprisoned for four months. 

The sentencing follows his guilty plea to charges related to enabling money laundering activities within his crypto exchange. The verdict was delivered in Seattle federal court and marks the culmination of US authorities’ multiyear investigation into Binance.

Lighter Sentence For Binance Founder

The sentence handed down to Zhao was notably less severe than the three-year prison term sought by federal prosecutors. In contrast, the defense had requested five months of probation, ultimately given the outcome wanted. 

Under the terms of a settlement reached in November of 2023, Zhao agreed to step down as CEO of Binance, as part of an agreement to resolve the investigation. 

The probe primarily focused on allegations that Binance failed to implement an effective anti-money laundering program, as the Bank Secrecy Act required. 

Regulatory Pressure Mounts 

Zhao was also accused of knowingly allowing Binance to process transactions involving funds derived from unlawful activities, including transactions between US citizens and individuals residing in sanctioned jurisdictions.

As part of the resolution, Binance was ordered to pay an imposing $4.3 billion fines and forfeiture. Additionally, Changpeng Zhao personally agreed to pay a substantial $50 million fine, underscoring the severity of the charges and the commitment to accountability.

The legal challenges for Binance do not end there. The company faces separate lawsuits from the US Securities and Exchange Commission (SEC) and the Commodity Futures Trading Commission (CFTC) for alleged mishandling of customer assets and operating an illegal, unregistered exchange within the United States. 

Binance

As of this writing, the exchange’s native token, Binance Coin (BNB), is trading at $573, down over 3% in the last 24 hours and 7% in the last seven days. 

Featured image from Bloomberg, chart from TradingView.com 

EigenLayer Makes A Big Splash With EIGEN Token Launch And Major Airdrop Plan, Get The Full Scoop!

EigenLayer, a decentralized restaking protocol built on Ethereum (ETH), has made significant announcements, paving the way for new developments within the crypto ecosystem. 

The protocol unveiled its native token, EIGEN, which the newly formed Eigen Foundation will distribute. Alongside this, EigenLayer introduced a major plan for an airdrop and released a comprehensive new Whitepaper.

EigenLayer Unveils EIGEN With Novel Mechanism

According to the protocol’s announcement, the introduction of the EIGEN token brings forth a complementary mechanism designed to address “intersubjective” faults, which cannot be resolved through ETH restaking alone. 

By expanding ETH restaking, EigenLayer positions ETH as the Universal Objective Work Token, while the universality of EIGEN makes it the Universal Intersubjective Work Token. EIGEN’s universality is reportedly aimed at allowing it to fork and slash for intersubjective errors committed by EIGEN stakers in any AVS (Automated Verification System) within the protocol. 

To ensure widespread adoption of EIGEN across applications, EigenLayer has designed an application-independent mechanism to maintain the system’s cryptoeconomic security. 

In EigenLayer, EIGEN staking and ETH restaking play complementary roles. EIGEN addresses safety properties through objective slashing, and ETH restaking ensures liveness and censorship-resistance properties dependent on stake decentralization.

The launch of EIGEN also introduces intersubjective staking, marking a significant milestone for the protocol and the Ethereum ecosystem. However, due to its newly introduced design, the concept requires widespread adoption and discussion among ecosystem participants. 

At launch, the Eigen token will have a total supply of 1.67 billion tokens, with the Foundation allocating 45% of the tokens to the community. This allocation is further divided into staked drops, community initiatives, and ecosystem development.

Investors will reportedly receive almost 30% of the tokens, while early contributors will receive over 25%. Both these groups are subject to a three-year lockup period for their allocations. 

A complete lock will be in place during the first year, followed by a gradual release of their total holdings at a rate of 4% per month over the subsequent two years.

EIGEN Token Launches Meta-Setup Phase

While the initial implementation of intersubjective staking at launch mirrors only a limited extent of the full protocol, several parameters still need to be determined for its full actuation. 

To address this, EIGEN is being launched in a meta-setup phase, serving as a call to action for researchers, experts, and the broader community to engage in public discourse. 

As EigenLayer announced, this collaborative effort aims to help define the necessary parameters to make the protocol and its interaction with the rest of the Ethereum ecosystem as effective as possible.

EigenLayer

Featured image from Shutterstock, chart from TradingView.com 

Hong Kong Bitcoin ETF Readies For Stellar Debut, Expected To Outshine $125M US Launch

The eagerly anticipated Hong Kong Bitcoin ETF market is scheduled to commence trading on Tuesday, marking a significant milestone in the increasing adoption of the leading cryptocurrency and building upon the success of the US ETF market. 

With their approval, the newly regulated index funds are poised for a noteworthy debut, surpassing the first-day inflows in the United States.

HK Bitcoin ETF Market Poised For Record-Breaking Debut

Zhu Haokang, the Digital Asset Management Supervisor and Family Wealth Supervisor at Warsaw Fund expressed great confidence in the trading volume of Hong Kong Bitcoin ETFs on its inaugural day.

This volume exceeded the scale achieved during the US launch on January 10th of this year, which amounted to over 125 million US dollars. 

Haokang further stated that Huaxia, one of the three ETF issuers, is confident in becoming the largest ETF issuer on the first day of trading. At the same time, OSL, a digital asset platform, has already completed the initial fundraising with two funds, including Huaxia. 

Furthermore, the capital inflow during the Hong Kong spot Bitcoin ETF’s first-day listing transaction has surpassed that of the US spot ETF market. 

According to Haokang, this difference can be attributed to two factors: the purchase and redemption of spot and in-kind transactions, which are unavailable in the US spot Bitcoin ETF.

Unprecedented Investment Options

One unique aspect of the China Summer Fund’s Hong Kong spot ETF is its incorporation of Hong Kong dollars, US dollars, and dual counter offers (RMB counters), distinguishing it from the other two offerings. 

Additionally, the fund features a non-listed share alongside the listed share, further setting it apart from its counterparts. Given the physical purchase method, investors, including Bitcoin miners, can directly acquire the Hong Kong virtual asset spot ETF using the Bitcoin they already hold. 

Moreover, outreach efforts have reportedly been made to attract investors from countries and regions without ETF offerings, such as Singapore and the Middle East, generating significant interest.

Despite the substantial market size of the current US spot Bitcoin ETF market, Hong Kong’s utilization of cash and in-kind subscriptions, coupled with the appeal of open trading during Asian market hours, is expected to attract numerous American investors, according to Haokang. 

Mainland Chinese Investors Restricted

Wayne Huang, OSL ETF and Trusteeship Business Manager, highlighted that Victory Securities could facilitate physical purchases, and the winning securities in China can also leverage OSL’s support. 

Three vouchers enable physical purchases, with more expected to follow suit. Following the ETF’s listing, various voucher chambers of commerce are likely to participate, increasing the overall ecosystem of the Bitcoin ETF market in May.

On the other hand, Zhu Haokang also clarified that mainland Chinese investors are currently restricted from investing in Hong Kong’s spot ETF market. However, qualified investors, institutional investors, retail investors, and qualified international investors in Hong Kong can participate in the spot ETF race. 

Individuals seeking further details are advised to consult voucher providers and sales channels while closely monitoring potential regulatory adjustments and the development of a specific regulatory framework in the future.

Bitcoin ETF

Currently, BTC is trading at $63,000 after failing to consolidate above the key $66,000 level in recent days. However, the launch of the ETF market in Hong Kong is expected to significantly impact the price of BTC in the long run. 

Featured image from Shutterstock, chart from TradingView.com 

Forbes Unveils 20 Crypto ‘Zombies,’ Declares Ripple And XRP Among The Undead

In a controversial report, Forbes unveiled a list of 20 “crypto billion-dollar zombies,” Layer 1 (L1) tokens, which the news outlet defines as crypto assets with substantial valuations but “limited utility beyond speculative trading.” 

These cryptocurrencies and projects include Ripple, XRP, Ethereum Classic (ETC), Tezos (XTZ), Algorand (ALGO), and Cardano (ADA), among others. 

XRP And Ethereum Classic In The Spotlight

Ripple Labs, the company behind XRP, was highlighted as a prominent crypto zombie. Despite XRP’s active trading volume of around $2 billion daily, Forbes asserts that the token’s primary purpose remains “speculative” and “lacking meaningful utility.” 

However, Ripple Labs and XRP are not alone in this regard. Forbes reveals that 50 blockchains, excluding Bitcoin (BTC) and Ethereum (ETH), currently trade at values surpassing $1 billion, with at least 20 of them classified as “functional zombies.” Collectively, these 20 blockchains hold a market value of $116 billion, despite having “limited user bases.”

Crypto

According to Forbes, an example of a “functional zombie” is Ethereum Classic, which maintains the distinction of being the original Ethereum chain. 

While ETC has a market value of $4.6 billion, its fee generation in 2023 was less than $41,000, raising questions about the blockchain’s viability for the news organization.

Another crypto project in Forbes’ report is Tezos, which raised $230 million through an initial coin offering (ICO) in 2017. 

Tezos’ XTZ token currently holds a market capitalization of $1.2 billion. However, the blockchain’s fee earnings were meager, with $5,640 in February 2024 and a total of $177,653 for all of 2023. 

Algorand, once hailed as an “Ethereum killer” due to its capability of processing 7,500 transactions per second, faces similar challenges. 

Despite a market cap of $2 billion and a treasury holding of $500 million, Algorand earned $63,000 in blockchain transaction fees throughout 2023. For Forbes, this casts doubt on its actual adoption and utility.

Crypto ‘Zombie’ Blockchains

The zombie blockchains are categorized into two groups by Forbes: spin-offs and direct competitors to established blockchains like Bitcoin and Ethereum. 

Spin-off zombies include Bitcoin Cash (BCH), Litecoin (LTC), Monero (XMR), Bitcoin SV (BSV), and Ethereum Classic. 

These blockchains, collectively valued at $23 billion, reportedly emerged from “disagreements” among programmers regarding the governance and direction of the original chains

Forbes notes that when such conflicts arise, hard forks occur, resulting in new networks that share the same transaction history as their predecessors. The agency claims that their market value “often exceeds” their real-world usage.

Overall, The report highlights a growing disparity between the valuations of certain projects in the cryptocurrency industry and their actual utility and usage. Consequently, Forbes refers to these projects as “zombies.”

Crypto

Featured image from Shutterstock, chart from TradingView.com 

Timing The Breakout: When Will Bitcoin Escape The Post-Halving Consolidation?

Bitcoin (BTC), the largest cryptocurrency in the market, has been trading within a re-accumulation range between the $59,000 and $70,000 price levels for the past month and a half. 

Crypto analyst Rekt Capital recently shared its perspective on this phase and its potential duration, drawing from historical patterns and data in a post on social media platform X (formerly Twitter).

Breakout Timing And Historical Patterns

According to Rekt’s analysis, Bitcoin tends to experience a re-accumulation range following the Halving event, which occurs every four years to counteract any inflationary effect on Bitcoin by lowering the reward amount for miners and maintaining scarcity. 

Historically, This consolidation phase lasts up to 150 days before Bitcoin breaks into a parabolic uptrend. Based on this pattern, if Bitcoin continues to consolidate for the next 150 days, Rekt suggests a breakout would be expected in September 2024.

The ideal duration of a re-accumulation range is crucial in determining Bitcoin’s future trajectory. Rekt Capital noted that when Bitcoin reached a new all-time high (ATH) of $73,700 in mid-March, it accelerated its cycle by 260 days. However, with over 49 days of consolidation, the acceleration has reduced to approximately 210 days.

Resetting The Bitcoin Halving Cycle

Repeating historical trends, where Bitcoin consolidates for 150 days after the Halving, would still indicate an acceleration in the current cycle, albeit by a lesser extent of 60 days. 

Nevertheless, Rekt contends that Bitcoin would ideally need to consolidate for at least 210 days to fully resynchronize with its historical Halving cycles and reset the current acceleration in this cycle to 0. This would bring the rate of acceleration to 0 days and potentially lead to a breakout around November 2024.

The analyst further suggested that to achieve a 200+ day post-Halving consolidation and fully resynchronize with historical Halving cycles, Bitcoin would need to replicate its mid-2023 re-accumulation range, which lasted 224 days before a new uptrend emerged. Rekt concluded:

Overall, how long this current Re-Accumulation Range will last will dictate the remaining acceleration in this cycle and ultimately influence where Bitcoin will finally peak in its Bull Market. 

Bitcoin

The largest cryptocurrency, with a market capitalization of $1.2 billion, is currently trading at $64,400, showing minimal fluctuations compared to Thursday’s price movements. 

Recently, Bitcoin has encountered resistance at the $66,000 level, hindering its ability to consolidate above this threshold. Conversely, the $63,400 level may serve as a support base for the cryptocurrency in the event of heightened downward volatility over the weekend.

Featured image from Shutterstock, chart from TradingView.com

Vertex AI Price Forecast: Bitcoin Has 60% Chance Of Hitting $100,000, Key Predictions Unveiled

On-chain analytics firm Spot On Chain’s team of analysts, using Google Cloud’s Vertex artificial intelligence (AI), has conducted an in-depth analysis to forecast the future price of Bitcoin (BTC). 

Their latest report provides valuable insights into the leading cryptocurrency’s short-, medium-, and long-term outlook.

Bitcoin Price Forecasts

According to Spot On Chain’s report, Bitcoin prices are expected to fluctuate between $56,000 and $70,000 during May, June, and July 2024. 

This projected range indicates the potential for market volatility, with a 48% probability assigned to the scenario where BTC prices may dip below $60,000. Moreover, the report advises a cautious approach, acknowledging the possibility of short-term fluctuations or corrections in the price.

Spot On Chain’s analysis reveals a significant movement in the latter half of 2024, with a compelling 63% probability of Bitcoin reaching $100,000. 

This mid-term projection reflects a prevailing bullish sentiment in the market, further fueled by anticipated rate cuts after the Federal Open Market Committee’s (FOMC) December 2023 meeting. 

These rate cuts aim to bring the federal funds rate down to 4.6% and are expected to boost demand for risk-on assets such as stocks and Bitcoin.

Looking ahead to the first half of 2025, Spot On Chain’s modeling indicates a strong probability that Bitcoin will cross the $150,000 threshold. Specifically, a 42% probability is assigned to this scenario, indicating a bullish outlook for Bitcoin’s price trajectory.

What’s more, looking at the entire year of 2025, the probability of Bitcoin exceeding $150,000 rises to an eye-popping 70%. Based on historical data and patterns in previous cycles, Bitcoin reached a new all-time high approximately 6 to 12 months after the Halving event

Price Consolidation On The Horizon?

Crypto analyst Retk Capital has also provided insights into the current Bitcoin price action, shedding light on key resistance levels and the potential for a consolidation phase before an anticipated parabolic upside.

According to Retk Capital’s analysis, Bitcoin has consistently been rejected from the $65,600 resistance level, failing to regain it as a support level. 

This resistance zone has significantly impeded Bitcoin’s upward movement in recent days, as seen on the cryptocurrency’s daily BTC/USD chart below. 

Bitcoin

Retk Capital further highlights that Bitcoin has been witnessing downside wicks into a pool of liquidity at approximately $60,600. This occurrence has been observed over multiple weeks, indicating the presence of buyers in that price range. 

If Bitcoin experiences further downward movement, the analyst believes that there is a possibility that it may approach this area once again. The analyst further notes:

Price dropping without context can be emotionally challenging. However, understanding that this downside is part of the consolation within a technical range-bound structure that will precede Parabolic Upside makes this experience much more comforting.

As of this writing, BTC is trading at $63,900, down nearly 8% over the past two weeks and the same percentage over the past 30 days.

Featured image from Shutterstock, chart from TradingView.com