Meme Coin Mania Sweeps The Globe: Top 10 Countries Leading The Craze In 2023

The rise of the meme coin mania in 2023 has taken the cryptocurrency world by storm, and a new report by CoinGecko shows that the trend is most popular in the United States, India, and the United Kingdom. These countries account for over 50% of all meme coin fans this year, indicating a strong interest in these assets.

But the appeal of meme coins continues beyond there. The report also highlights the popularity of these coins in other regions, including Southeast Asia’s Philippines and Malaysia, Nigeria and Morocco in Africa, Oceania’s Australia and New Zealand, and Canada. This diverse mix of countries suggests that meme coins have a global appeal.

From the US to India, The Global Phenomenon Of Meme Coins Takes Hold

The top 10 countries leading the meme coin craze in 2023 make up the majority of interest in these assets, representing 82.9% of all fans. This indicates that even though meme coins may have started as a niche trend, they have quickly gained a following worldwide.

Meme Coins

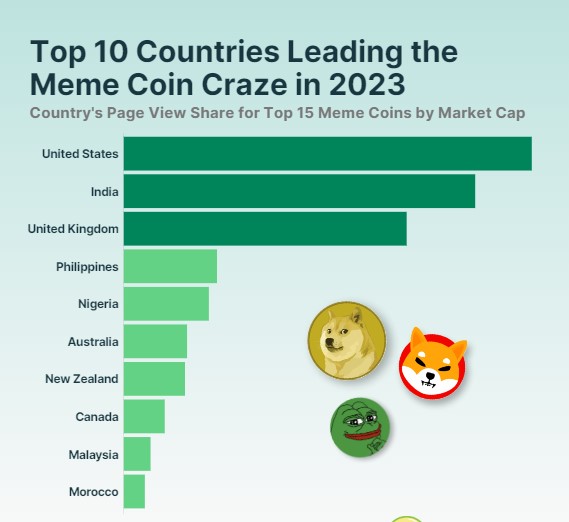
According to the report, the United States is at the forefront of the meme coin craze in 2023, accounting for a whopping 23.6% of the global interest in these speculative assets. With over 2 million views on the top meme coin pages, it is clear that Americans are embracing this new type of cryptocurrency.

The report shows that the most popular meme coin in the US this year is Shiba Inu, which generated 60.7% of all US interest in meme coins. This is not surprising given the coin’s recent surge in popularity due to celebrity endorsements and high-profile listings on major cryptocurrency exchanges.

Following closely behind Shiba Inu is Pepe, a trending crypto that recently drove 11.8% of meme coin interest in the US. Other popular meme coins in the country include Bonk and Volt Inu, which generated 5.7% and 4.9% of US interest, respectively.

Moreover, India will be the second-largest driver of the meme coin hype in 2023, accounting for 20.3% of all interest across the countries. Shiba Inu is the most popular coin in India, generating 55.8% of the country’s interest in these speculative assets. Baby Doge Coin also received a relatively high share of interest, with 29.9% of India’s meme coin interest.

Floki is the most popular meme coin in the Philippines, generating 26.7% of the country’s interest in these assets. Shiba Inu and Bonk also received similar interest levels at 18.3% and 17.8%, respectively. Baby Doge Coin and Pepe were close behind, with 12.7% and 10.2% share of Philippines meme coin interest, respectively.

Shiba Inu Reigns Supreme

According to the report,  Shiba Inu is the most popular meme coin among investors in 2023, driving 46.7% of interest among the top meme coins. 

Baby DogeCoin is the second most popular, generating 12.3% of investor interest. This is followed by more recent coins, Pepe (9.4%), Floki (8.6%), and Bonk (8.2%). Furthermore, Pepe captured the most interest in Canada, accounting for 26.9% of all interest in the country.

Interestingly, while Dogecoin pioneered the meme coin space, it generated only 61.1% of interest in Morocco and received only minor interest in the other countries surveyed. 

Overall, the report by CoinGecko shows that meme coins continue to gain popularity and are a force to be reckoned with in the cryptocurrency market. As new coins emerge and gain traction, it will be interesting to see how this market evolves and whether meme coins will continue to be a dominant trend in the cryptocurrency world.

Meme coins

Featured image from Unsplash, chart from TradingView.com 

FTX Bold Move: Sells SUI For $100 Million, Tokens Now Worth $1 Billion

According to the trader and analyst of the crypto market under the pseudonym “Googly,” the fallen crypto exchange FTX sold warrants for $884 million SUI tokens to Mysten Labs and preferred stock for less than $100 million in March. The paper valuation for the tokens is now worth $1 billion.

The sale of the warrants and preferred stock is significant for FTX, providing additional funding to support its operations and expansion. FTX has been gaining traction in the cryptocurrency market, and the additional funding will undoubtedly help the company continue to grow and innovate.

However, It is worth noting that the value of the tokens and preferred stock can only be realized if FTX relaunches. 

FTX Laughing All The Way To The Bank? Not Quite

FTX filed a court document on March 22, 2023, outlining its sale of interests in SUI Foundation and the Purchaser-Subject Company. According to the document, FTX Ventures Ltd. acquired 560,045 Series B Preferred Stock shares in the Purchaser-Subject Company and a warrant to purchase 363,636,305 SUI Tokens for a total of $99,999,843.06. 

Additionally, Cottonwood Grove Limited acquired a warrant to purchase 173,333,333 SUI Tokens, and FTX Trading Ltd. acquired a warrant to purchase 346,666,667 SUI Tokens. These warrants are only exercisable upon achieving certain milestones and events concerning the implementation of SUI protocols and trading SUI tokens on the FTX.com platform.

On August 31, 2022, FTX Ventures Ltd. acquired an additional 7,000 shares of Preferred Stock in the Purchaser-Subject Company and a warrant to purchase 4,114,898 SUI Tokens. All of the SUI Token Warrants are only exercisable after the SUI Tokens are minted, generated, or created, if ever. The Preferred Stock and the SUI Token Warrants held by the sellers are referred to collectively as the “Interests.”

FTX has now filed a court document outlining the sale of these Interests for cash consideration. The document states that the Interests are easily separated from the Debtors’ core operations. The sale of the Interests will not affect the Debtors’ ability to operate any of their businesses.

In addition, any income that the Preferred Stock might generate in the form of dividends or distributions is uncertain and would only be received at the discretion of the Purchaser-Subject Company’s board of directors.

What You Need To Know About SUI

SUI Tokens are a digital asset created by Sui Foundation, a blockchain-based platform that aims to provide secure, transparent, and decentralized data management and storage solutions. The SUI Tokens are designed to be used within the Sui ecosystem, allowing users to access various services and applications.

Furthermore, the SUI Tokens are based on the Ethereum blockchain and are ERC-20 compliant, meaning they can be easily integrated with other Ethereum-based applications. The tokens can be used to pay for services within the Sui ecosystem, such as data storage and data management, and can also be traded on various cryptocurrency exchanges.

As reported by NewsBTC, the highly anticipated launch of SUI, a blockchain-based platform for secure and decentralized data management, is finally here. Dubbed the next “Ethereum killer,” SUI is expected to shake up the cryptocurrency market with its unique technical approach.

FTX

Featured image from Unsplash, chart from TradingView.com 

More Dip To Come: Bitcoin Liquidity On The Move Ahead Of Major Event

As the Federal Reserve (Fed) prepares to announce its decision on interest rates, Material Indicators, a research and analysis firm in the cryptocurrency market, is keeping a close eye on the Bitcoin (BTC) liquidity movements. FireCharts, a popular charting platform, has tracked liquidity movements on the BTC/USDT Binance order book. Their observations have led them to believe that the recent dip in Bitcoin’s price may extend.

Liquidity refers to the amount of Bitcoin available for trading at a given price level. When there is a large amount of liquidity at a particular price level, traders can easily buy or sell Bitcoin at that price without significantly affecting the market. However, low liquidity at a certain price level can lead to volatility spikes as traders scramble to buy or sell the asset. 

Will Bitcoin Face Another Dip

Material Indicator’s FireCharts analysis shows that liquidity in the Bitcoin order book has been moving ahead of the Federal Reserve’s decision, indicating that traders are preparing for potential volatility in the market. This could lead to further price drops if liquidity to the upside declines. 

Bitcoin

Added to the above, according to Kaiko, a leading cryptocurrency market data provider, liquidity in Bitcoin and Ethereum continues to deteriorate, with market depth for both cryptocurrencies approaching one-year lows, which could have significant implications for bulls, as low liquidity can lead to increased volatility and price instability.

As of writing, the price of Bitcoin stands at $28,300, representing a 1.4% decline over the past 24 hours. Despite the recent news of more bank failures, which briefly pushed the price above $29,000, Bitcoin has remained within its established trading range of $27,800 to $28,600. The attempt to exceed the $29,000 mark was unsuccessful, and the price has since retraced to its current level. 

The market remains in flux as investors monitor the ongoing price movements, waiting for a clear direction to emerge after the Federal Open Market Committee meeting. But will this lead to more retracement, or will the market react positively to the news?

BTC Braces For Potential Impact Of Federal Reserve’s Rate Hike

The Federal Reserve’s latest measures on employment and wages suggest that more rate hikes may be on the horizon. This comes after the key labor costs metric for the first quarter came in higher than expected. One of the Fed’s preferred inflation gauges, the Personal Consumption Expenditure (PCE) index, remains persistently high. 

Furthermore, according to the latest report by Bitfinex, a leading cryptocurrency exchange, the labor costs metric for the first quarter came in hotter than expected, indicating that wages are rising faster than anticipated. This could lead to higher inflation, as companies may pass higher labor costs to consumers through higher prices.

This suggests that the Federal Reserve may need to raise interest rates to manage inflation and maintain price stability. The Fed has already signaled that it may raise rates in May, and these latest measures on employment and wages reinforce that decision.

The implications of a rate hike are significant for the financial markets, including the cryptocurrency market. A rate hike could increase volatility and uncertainty as investors adjust their expectations for future economic growth and earnings. However, it could also lead to a stronger dollar and increased demand for safe-haven assets like gold and Bitcoin.

Bitcoin

Featured image from iStock, chart from TradingView.com

US Banking Crisis Worsens With Half Of America’s Banks On the Verge Of Failure

The recent sharp decline in shares of major U.S. regional banks has sparked fears of another banking crisis. The collapse of First Republic Bank, the largest U.S. bank failure since 2008, has sent shockwaves through the financial sector, prompting experts to warn that a “confidence crisis” could happen to any bank in the country.

Investors have reacted quickly to the news, with shares of PacWest Bancorp, Western Alliance Bank, and KeyCorp plummeting by as much as 30%, 21%, and 10%, respectively. The KBW Regional Banking Index has also taken a hit, falling by 5.2% and its lowest since December 2020.

Banking

US Banking Industry In Peril, Half Of America’s Banks Nearing Insolvency

Mario Nawfal, a renowned financial expert, has expressed concern over the recent plummeting of bank shares in major U.S. regional banks, signaling a deepening banking crisis in the country.

In the aftermath of the collapse of First Republic Bank, the largest U.S. bank failure since the 2008 financial crisis, shares of PacWest Bancorp, Western Alliance Bank, and KeyCorp fell drastically, with the KBW Regional Banking Index hitting their lowest level since December 2020.

Nawfal warns that if a confidence crisis can happen to the First Republic, it can happen to any bank in the country. He attributes the current state of the US banking industry to “insatiable greed and reckless” money printing, which have had dire consequences. The collapse of First Republic Bank is just the tip of the iceberg, and things could get much worse if the Federal Reserve doesn’t pivot, Nawfal claimed. 

The implications of JPMorgan being the government’s first line of defense in a banking crisis are also a cause of concern for analysts from Evercore ISI, a global independent investment banking advisory firm. Nawfal further stated that the US banking industry is in peril, and urgent measures must be taken to prevent a complete collapse.

Major US Banks Experience Significant Share Price Falls, Halting Trading

PacWest Bancorp and Western Alliance Bancorp, two major players in the US banking industry, have halted trading in their equities after experiencing significant share price falls of 24% and 20%, respectively. 

This follows the recent sale of First Republic Bank to JPMorgan, which occurred after the US regulator, the Federal Deposit Insurance Corporation (FDIC), took control of the struggling San Francisco-based lender. First Republic Bank’s share price had collapsed by a staggering 97% this year following the crisis of confidence triggered by the collapse of Silicon Valley Bank in March.

According to a report by The Telegraph, First Republic Bank’s deposits plunged by $100 billion in the first quarter of the year, highlighting the severity of the crisis. The sale of the bank to JPMorgan indicates the dire state of the US banking industry and the need for urgent action to prevent a complete collapse.

Furthermore, according to The Telegraph, The US Federal Reserve has begun a two-day meeting to determine whether it should raise its benchmark lending rate for the tenth time. Since March last year, the Fed has aggressively increased interest rates to combat high inflation, which remains above its long-term target of two percent. 

The Federal Open Market Committee (FOMC) is widely expected to raise its base rate by a quarter-point on Wednesday, bringing the interest rate to between 5 and 5.25%, the highest level since the global financial crisis.

The situation is not just concerning for investors but also the wider US economy. The banking industry plays a critical role in the economy, and a collapse could have severe repercussions, including a credit crunch and a recession.

Banking

Featured image from Unsplash, chart from TradingView.com

Avalanche (AVAX) Climbs Higher: Q1 2023 Results Show Impressive Growth

According to the latest report by Messari, Avalanche (AVAX) has shown a strong rebound in the first quarter of 2023. The market cap of the blockchain platform increased by 65.8% quarter on quarter (QoQ), reflecting the broader market trend and the thaw of the crypto winter that took by storm the crypto industry in 2022. 

Avalanche’s Q1 2023 Performance

According to the report, Avalanche experienced a decline in daily average active addresses and transactions during Q1 2023. The 20.7% and 31.9% decline followed an anomalous spike and a high growth period of subnet activity in Q4.

However, the report also highlights that Avalanche’s supply of Bitcoin BEP2, a token on the Binance chain (BTC.b), increased by 64% during Q1, reaching over $250 million in market cap. This is a positive sign for the platform’s growth and demonstrates the increasing interest in Avalanche as a blockchain platform.

Avalanche

The report further notes that mainstream interest in Avalanche network infrastructure continued to grow during Q1, with partnerships with blockchain services (AWS) and Tencent Cloud, a secure, reliable, and high-performance cloud computing service. This demonstrates the growing recognition of Avalanche as a major player in the blockchain space.

In addition, Avalanche launched several notable developments during Q1 aimed at ushering in developers. These include the launch of HyperSDK, Glacier API, and integration with The Graph. These developments are expected to increase the adoption of Avalanche as a blockchain platform and attract more developers to build on the platform.

The Avalanche Effect

According to Messari,  Avalanche’s Total Value Locked (TVL) denominated in USD increased by 4.2% QoQ in Q1 2023, following the crypto market relief rally in January. However, TVL denominated in AVAX declined by 34.3%, suggesting that the increase in USD was due to asset price increases rather than new capital inflow.

Avalanche

Despite this decline, liquid staking derivatives (LSDs) and yield farming platforms supported Avalanche and its DeFi ecosystem. Benqi liquid staking TVL grew by 88.6% QoQ to $100 million by the end of Q1, and Vector Finance, a yield optimization platform, increased by 50% QoQ to $36 million. Collectively, these two protocols finished Q1 in the top 10 by TVL, with ~$136 million in TVL.

Avalanche’s most prominent protocol by TVL denominated in USD, Aave, was down slightly 5% QoQ, but Benqi Lending, Trader Joe, and GMX grew by 49%, 24%, and 70%, respectively. However, there remained concentration risk in the leading application, with Aave making up 43% ($432 million) of Avalanche’s DeFi TVL by the end of Q1.

Avalanche Validators Show Volatility

According to the report,  Avalanche’s network health remained stable in Q1 2023, with the average number of validators, total stake, and average engaged stake remaining consistent. However, the average number of delegators grew by 26.1% QoQ, indicating increasing participation in the network.

Despite the stability of stake across a greater number of validators and delegates, there was some volatility in the number of validators that went offline during Q1. Both the average amount of unresponsive stakes and the number of unresponsive validators increased by over 70% QoQ. However, the percentage of unresponsive stakeholders and validators remained high enough to sustain block production.

Overall, the Messari report indicates that Avalanche’s network health remained stable in Q1 2023, with consistent numbers of validators, total stake, and average engaged stake. The growth in the number of delegators also suggests increasing participation in the network. 

While there was some volatility in the number of validators that went offline during Q1, the percentage of unresponsive stakes and validators remained high enough to sustain block production. These findings demonstrate the continued growth and resilience of the Avalanche network and its potential for further expansion and adoption in the blockchain space.

Avalanche

Featured image from Unsplash, chart from TradingView.com

PEPE Goes To The Moon: Meme Coin Listed On OKX, Binance Listing In the Works?

PEPE, the popular meme coin, has recently been listed on OKX, a major cryptocurrency exchange. This move has generated excitement among investors who believe that the coin has the potential to become a major player in the crypto market and the meme coin sector. 

PEPE Coin Leaps Into The Big Leagues

The recent listing on OKX is a significant milestone for PEPE, providing the coin with greater exposure and access to a larger pool of investors. OKX is one of the largest cryptocurrency exchanges in the world, and its listing requirements are rigorous, which speaks to the increased enthusiasm generated by the cryptocurrency. This move also bodes well for the coin’s future, as it may lead to additional listings on other major exchanges.

Furthermore, there is speculation that Binance, another major player in the crypto space, may list PEPE if it meets their criteria. Binance CEO Changpeng Zhao recently hinted at this possibility during an Ask-Me-Anything (AMA) session, further fueling excitement around the coin.

In addition to the already thrilling news, there has been a surge of over 90% in the value of the meme coin since yesterday. This has resulted in a record-breaking market capitalization of over $435 million, making it the 101st most valuable coin in the cryptocurrency market, as reported by NewsBTC.

Frogging Amazing, Meme Coin Takes The Crypto World by Storm

According to Lookonchain, a blockchain analytics firm, three “SmartMoneys” have sold a portion of their PEPE holdings and made a profit of over $1 million. This impressive feat was achieved in just two weeks.

Lookonchain has reported that an individual with the following wallet has significantly profited from investing in PEPE. According to Lookonchain, the wallet holder purchased 5.42 trillion PEPE tokens for the equivalent of 1 Ethereum, worth approximately $2,100.

The wallet holder sold 3.42 trillion PEPE tokens for 929 Ethereum, worth around $1.77 million. Despite selling some holdings, the individual still holds 2 trillion PEPE tokens, worth approximately $2.37 million at current market prices.

If this investor were to sell their remaining meme coin tokens at the current market price, it could potentially profit approximately $4.14 million. 

Furthermore,  a user using dimethyltryptamine.eth has made a significant profit investing in the cryptocurrency project. The user reportedly purchased 5.9 trillion PEPE tokens for the equivalent of 0.125 Ethereum, worth approximately $251.

Dimethyltryptamine.eth sold 2 trillion meme coin tokens for 560 Ethereum, worth around $1.06 million. Despite selling a portion of their holdings, dimethyltryptamine.eth still holds 3.9 trillion PEPE tokens worth approximately $2.37 million at current market prices.

PEPE

Featured image from PEPE on Twitter, chart from TradingView.com

Bitcoin Faces Potential Price Drop To $25,000, On-Chain Data Signals Bearish Trend

Bitcoin (BTC) has been experiencing a volatile price action since late April, with significant fluctuations in its value. At the time of writing, the cryptocurrency has experienced a 3% decline in the last 24 hours and is currently trading at $28,400. However, it has now settled within an accumulation range of $27,800 to $30,000.

Bitcoin Bulls Take Caution

BaroVirtual from Cryptoquant recently shared his analysis regarding the potential downside targets for Bitcoin. According to the analyst, the bearish divergence of the BTC: On-Chain Summation Index suggests a target of approximately $27.200. A Head and Shoulders (H&S) pattern also indicates a lower range target of $25,000.

The BTC on-Chain Summation Index is a metric that tracks the number of Bitcoin being transferred on the blockchain. When the index shows a bearish divergence, it suggests a decrease in the amount of Bitcoin being transferred, which could lead to a decline in price.

On the same note,  Binance, one of the world’s largest cryptocurrency exchanges, received its largest single Bitcoin deposit in the past week. The deposit, made to an address that had remained inactive for four months, came from five separate addresses and totaled over 1,200 BTC, worth over $35M at current market prices.

Bitcoin

Arkham, a blockchain analytics firm that tracks cryptocurrency transactions, reported the news. The firm noted that the deposit was made in a single transaction and that the funds were sent to a previously unused deposit address. Will this translate into an extension of the bearish momentum? It remains to be seen. 

Moreover, according to Material Indicators, a crypto analytics firm, the recent Bitcoin monthly candle close/open has signaled a potential short-term price correction for the cryptocurrency. The firm’s Trend Precognition A2+ algo flashed a short signal, indicating a potential decline in Bitcoin’s price, as seen in the chart below. 

Bitcoin

However, according to Material Indicators, the signal is tentative until the candle closes, and a pump above the April high could invalidate it. Additionally, Wednesday’s upcoming U.S. Federal Open Market Committee (FOMC) Federal Reserve interest rate decision could catalyze a significant price move in either direction.

If the Federal Reserve raises interest rates by 25 basis points, it could lead to a stronger US dollar and put downward pressure on Bitcoin’s price. However, continuing to pause or maintain current rates could boost investor confidence and lead to a price increase for the cryptocurrency.

Although the potential downside targets predicted for BTC, evidence suggests that the $27,000 mark could support the cryptocurrency and push back the bears. This level has already demonstrated its resilience as a support floor, holding up well against significant selling pressure since April 21st.

Bitcoin

Featured image from Unsplash, chart from TradingView.com

Bitcoin Emerges As the King Of Assets,10X Growth Over Gold During US Banking Crisis

Despite the volatile price action of Bitcoin (BTC), the world’s largest cryptocurrency has outperformed every other asset, including gold. Although it is trading below its psychological milestone of $30,000 at $29,000, Bitcoin is expected to grow further in 2023, as it acts as a safe haven for investors amidst the US banking crisis.

 Bitcoin Reigns Supreme As the Best-Performing Asset

Capriole Investment, which provides research and analysis on cryptocurrencies, has reported that the current market cycle favors hard assets like gold, as indicated by the 200-week Gold-to-Stocks ratio. This classic indicator highlights when the market favors safe-haven assets like gold over riskier equity assets. Both gold and Bitcoin have generated some of their best returns during these phases.

As the market continues to favor hard assets, Bitcoin has emerged as the preferred safe haven for wealth amidst the US banking crisis and fiat currency weakness. During this period of high correlation, Bitcoin has outperformed gold by 10X in 2023, making it the best-performing asset of the year among major asset classes.

Bitcoin

The strong positive correlation between Bitcoin and Gold has also increased significantly, making them attractive options for investors looking to diversify their portfolios and hedge against economic uncertainty. With unsustainable tightening, banking crises, and de-dollarization looming, the market is turning to these safe-haven assets to protect their wealth.

Bitcoin

According to the report by Capriole Investment, the current Bitcoin rally in 2023 is believed to be organic and spot driven. The report highlights a key metric showing total futures Open Interest as a ratio of the total Bitcoin and USDT market cap. 

This metric provides insight into the market’s leverage and shows that the crypto market leverage peaked with the FTX fraud in November 2022. Since then, this ratio has been on a one-way downtrend, despite Bitcoin’s price rallying over 80% from $16,000 to $30,000. This indicates that there has been little speculation in the market this year.

The report suggests that until this ratio spikes or Bitcoin dominance peaks, the foundations for sustainable price appreciation remain in place. This means that the current rally is driven by organic demand rather than speculation, which is a positive sign for the long-term growth of the cryptocurrency market.

Furthermore, the report suggests that the decrease in leverage indicates a healthy market less vulnerable to sudden price drops. This is because a high level of leverage can often lead to market instability, causing sharp price swings and potentially resulting in a market crash.

BTC’s $30-32K Dilemma

According to the report, Bitcoin is trading within the largest technical resistance block on the chart since $20,000. This region, which ranges from $30,000 to $32,000, represents the bottom of the 2021 range and the breakdown point into the bear market that began in 2022. 

Additionally, it is a major weekly order block level and Fibonacci extension level from the prior cycle. $30,000 is also a major round number level, representing a 50% increase from the 2017 cycle all-time-high of $20,000, and $32,000 marks a 100% appreciation in Bitcoin since the FTX Fraud bottom at $16,000.

BTC

While Bitcoin has shown remarkable resilience in recent months, it is important to note that past performance is not an indicator of future results. However, according to Capriole’s report, if Bitcoin manages to close above $32,000 weekly, it wouldn’t be surprising to see a new trend carry its price into the $40,000 mark.

Bitcoin

Featured image from Unsplash, chart from TradingView.com

XRP Dominates The Market: ADV On Centralized Exchanges Surged by 46% In Q1 2023, Report

XRP, the sixth-largest cryptocurrency by market capitalization, has recorded significant gains in the first quarter of 2023. Despite a drop from its yearly high of $0.590, XRP dominated the crypto market with total sales in Q1 2023 of $361.06M, net of purchases, compared to $226.31M in the previous quarter.

XRP Shines In Q1, Records Impressive Growth And Performance

According to the Q1 report by Ripple, XRP Ledger (XRPL) on-chain activity remained strong, with decentralized exchange volumes increasing by 34% to $115M in Q1 2023 versus Q4 2022. Furthermore, XRP Average Daily Volume (ADV) on centralized exchanges jumped 46% in Q1 to $1B from $698M, indicating high demand for the cryptocurrency.

XRP

While financial turmoil dominated the markets in Q1 of 2023, the token recorded a 46% increase in volumes compared to the previous quarter, according to the report. This increase can be attributed to market recovery and large volatile events spike volumes.

Furthermore, according to the data released by Ripple, the XRPL’s on-chain activity remained strong in Q1 2023. The total number of transactions increased to 116,341,516, up from 106,429,153 in the previous quarter. The average cost per transaction (in XRP) also increased slightly to 0.00121 from 0.00096 in Q4 2022, while the average cost per transaction was $0.000484.

In addition, the XRPL burned 140,993 tokens for transaction fees in Q1 2023, reflecting an increase from the previous quarter. The average XRP closing price during the period was $0.40, slightly lower than the previous quarter’s $0.42.

The XRPL’s decentralized exchange (DEX) volumes also increased in Q1 2023, with $114,567,441 traded on DEX, up from $85,772,947 in the previous quarter. The number of trust lines remained stable at 8,317,321, while the number of new wallets created was 140,558.

Moreover, The XRP Ledger’s on-chain activity remains robust, with Ripple’s latest report revealing that transactions increased by 9% in Q1 2023 to 116 million, compared to 106 million in the previous quarter. NFTs have emerged as a key driver of activity, with over one million assets minted on the Ledger since XLS-20 went live on the mainnet.

Rising Above The Rest

The report also notes that due to the recent banking crisis, Ripple temporarily stopped purchasing XRP for several days due to the disruption. However, the company has since resumed purchases and plans to continue purchasing XRP as ODL (On-Demand Liquidity) adoption grows.

In addition, during Q1 2023, three billion XRP were released out of escrow, with one billion released each month, in line with prior quarters and the official escrow arrangement. Of the three billion XRP, 2.1 billion were returned and subsequently put into new escrow contracts throughout the quarter, ensuring the stability and predictability of XRP’s supply.

At the time of writing, XRP is trading at $0.4640, representing a decline of 2.5% over the past 24 hours. In the wider time frames, XRP is experiencing a downturn, with 5%, 8%, and 3% decreases in the seven-day, fourteen-day, and 30-day timeframes, respectively.

XRP

Featured image from Unsplash, chart from TradingView.com

Bitcoin Bloodbath: Market Volatility Sparks Panic, Wipes Out $1 Billion In Open Interest

In the last 24 hours, Bitcoin (BTC) has experienced a sharp increase in volatility, with prices fluctuating between $29,000 and $27,000, given the lack of liquidity in the market. This sudden price action has had a significant impact on bulls and bears.

However, as of this writing, Bitcoin has managed to recover the $29,000 level, and it remains to be seen if it can continue to recover and consolidate above its key psychological level of $30,000, supporting the continuation of its bull run or if it will be further slumps in the coming days or weeks.

False Rumors Cause Bitcoin Investors To Liquidate In Droves

According to Satoshi Club, the rumors of the US government and Mt. Gox sales were initially believed to be true, leading to panic selling among Bitcoin traders. However, it was later confirmed that the data was misclassified, and no such sales were taking place.

Bitcoin

The impact of these rumors on the market was significant, as traders were already on edge due to the high levels of volatility in the market. The news of potential large-scale sales by the US government and Mt. Gox, a now-defunct Bitcoin exchange, only added to the uncertainty and fear among traders.

The market panic led to liquidating $300 million worth of positions as of this writing and the wiping out of $1 billion in open interest within 24 hours. This was a significant blow to both long and short traders, as many were forced to exit their positions at a loss.

Open interest can impact the price of Bitcoin because it reflects the level of market participation and sentiment. When open interest is high, it suggests greater interest and activity in the market, potentially leading to price movements.

However, the market has since recovered, and Bitcoin’s value has risen again. The Funding Rate has returned to around 0.003, indicating that traders are no longer overleveraged, and the open interest has also decreased, indicating a lack of significant activity in the market.

Will BTC Reclaim The $30,000 Mark?

Material Indicators, a leading cryptocurrency analytics provider, has analyzed the Weekly BTC/USDT chart, which shows bid liquidity moving up and ask liquidity moving down. According to Material Indicators, when bid and ask liquidity becomes more concentrated around a price point, it dampens volatility, leading to a sideways chop until one side makes a move.

Per Material’s analysis, this type of price action differs from what was observed yesterday, as bids and asks were initially moving up, indicating a clear path for a pump. However, as things started getting “toppy,” asks began dropping down, ultimately dumping into the liquidity void created on the way up.

Furthermore, CryptoCon, a leading provider of cryptocurrency analysis, has highlighted the recent drop in Bitcoin’s value, which saw a 15% decline. This drop has allowed the Chaikin Money Flow (CMF) indicator to reset slightly, as it nears dangerously close to hitting the Mid-Top .35 line.

Bitcoin

The CMF indicator is a technical analysis tool that measures buying and selling pressure in the market. When the CMF is above zero, buying pressure is stronger than selling pressure, and vice versa when it is below zero. The Mid-Top line at .35 represents the halfway point in the cycle for Bitcoin’s true gains.

According to CryptoCon, the mid-top cycle for Bitcoin is approaching soon, but it is only half of the “true gains” for Bitcoin in a cycle. This means there is still significant potential for Bitcoin to experience further gains in the market.

Bitcoin

Featured image from Unsplash, chart from TradingView.com

Bitcoin Bulls On Edge As Pivotal Level Sets Stage For Potential Price Surge Or Slump

Bitcoin (BTC), the world’s largest cryptocurrency by market capitalization, has experienced a volatile market over the past few days, with its price fluctuating between highs and lows. However, BTC has recently bounced back from a major trend line at $27,000 and is currently trading at $29,600, representing a profit of over 8% in the last 24 hours.

This latest surge in BTC’s price comes after the collapse of a major US bank, First Republic Bank. The news of this collapse may have contributed to the uptick in BTC’s price, as investors seek alternative investment options after the bank’s failure.

Another Bank Failure Tied To BTC’s Price Surge

Theto the trader and analyst, who goes by the pseudonym “CJ,” has identified what they believe to be the current parameters for the market. According to CJ, if Bitcoin’s price closes above 30k and the US dollar index (DXY) breaks to a range of 97-100, the market will likely reach the 33k liquidity level. However, if Bitcoin’s price rejects this level and closes below 29250, it could be a bearish re-test.

It is worth noting that Bitcoin has recently bounced from a key pivotal support level of $27,000, which is good news for bulls in the short term. However, the market is still uncertain whether Bitcoin will break above the $30,000 resistance again or experience another slump. 

On the other hand, the recent bank failure, as described by Nick Gerli, CEO and Founder of Reventure Consulting, has highlighted the potential risks associated with traditional banking and finance. This has led investors to question the stability of the traditional financial system and seek alternative options.

On the contrary to this situation, Bitcoin has been on the rise since the beginning of 2023, and some analysts believe that the current economic climate could be a contributing factor. The recent contraction in the money supply in the US has led to a decrease in available capital, which could lead investors to seek alternative investment options. 

With its decentralized nature and limited supply, Bitcoin has become an attractive option for investors looking to diversify their portfolios. Furthermore, Bitcoin’s recent price uptick can be attributed to several factors, including increased institutional adoption and growing mainstream acceptance. However, the current economic climate has undoubtedly played a role in Bitcoin’s recent surge in value.

As the economic outlook remains uncertain, many investors turn to Bitcoin as a safe haven asset. The cryptocurrency has been touted as a hedge against inflation and economic instability, and its recent price uptick could reflect these beliefs.

Bitcoin Highs Already Made For The Year?

The Puell Multiple, a metric used by cryptocurrency traders and analysts to gauge the value of Bitcoin, has recently made a perfect retest of its uptrend, according to CryptoCon, a trader and analyst of the crypto market. This retest suggests that the upward trend of Bitcoin remains intact and could potentially lead to much higher valuations in the future.

Bitcoin

The Puell Multiple is calculated by dividing the daily issuance value of Bitcoin by the 365-day moving average of the daily issuance value. It is a useful metric for understanding the current state of Bitcoin’s mining ecosystem and can provide insights into the potential future direction of Bitcoin’s price.

With the Puell Multiple’s recent retests of its uptrend, CryptoCon suggests that the upward momentum of Bitcoin remains strong and could lead to even higher valuations in the future. This is welcome news for bulls eagerly anticipating a continued rise in Bitcoin’s price.

Bitcoin

Featured image from Unsplash, chart from TradingView.com 

Notorious B.I.D. 2.0: Biggie-Sized Bidder Will Fuel Bitcoin Rally Again?

The cryptocurrency market has experienced significant volatility in recent months, with the price of Bitcoin (BTC) dropping from its new yearly high of $31,000 to its current trading price of $27,300. This pullback has left Bitcoin at a crossroads, with traders waiting to see whether the key support level of $27,000 will hold or break.

However, Bitcoin is known for its volatility, and bid liquidity movement can provide valuable insights into market activity. In Q1/2023, a block of bid liquidity was identified in what appeared to be controlled by a single entity, which was named Notorious B.I.D, according to the research and analysis firm Material Indicators. 

Bitcoin Rally 2.0 On The Horizon?

This entity was successful in attracting more bids to fuel a Bitcoin rally, and the movement of bid liquidity became predictable over time. However, the game ended with a rug pull in the first week of March.

As of this writing, according to Materials,  there are indications that a similar entity may be active in the market again, with bid liquidity movement that looks similar to what was seen in Q1. While there is no way of knowing for sure if Notorious B.I.D. is back, it appears that somebody is using a large stack to play a similar game.

Bitcoin

One of the key differences between what was seen in Q1 and what is being observed now is that the buy walls are changing size. This could be a distribution strategy, as the large buyer seeks to push the price up to a higher distribution range and ultimately use those bids as exit liquidity. 

According to the fire chart of the Material Indicator, there is a substantial bid wall situated just below the $26,000 mark. This bid wall may have the potential to prevent a further decline in Bitcoin’s price shortly, but only if the $27,000 support floor is broken. Despite this, Bitcoin’s current support level has remained stable, indicating that there is a possibility of a rebound to higher levels. Therefore, it cannot be ruled out that Bitcoin’s price may bounce back to higher levels.

BTC’s MVRV Reaches 11-Month High

According to Gaah, a researcher and analyst from the CryptoQuant Firm, the MVRV (market-value-to-realized-value) ratio is a key indicator of market sentiment and can provide valuable insights into investor behavior. The ratio is calculated by dividing the market capitalization of Bitcoin by its realized capitalization, which is the sum of the value of all Bitcoin transactions since they were last moved on-chain.

Bitcoin

When the MVRV ratio is in the green quadrant, below a value of 1.44, it is considered to be in the accumulation zone. This indicates that there is decreased selling pressure in the market, as the realized capitalization of Bitcoin exceeds its market capitalization. In other words, investors are less motivated to sell their Bitcoin, as they believe that its true value is higher than its current market price.

Gaah notes that the MVRV ratio reached a high of 0.82 in December 2022, when Bitcoin was still trading at around $17,000. This is the same level that the ratio reached in 2018, just before Bitcoin experienced a significant drop in value. However, Gaah believes that the current market conditions are different and that the MVRV ratio is a reflection of the increasing institutional adoption of Bitcoin.

Bitcoin

Featured image from Unsplash, chart from TradingView.com

Ethereum Staking Takes A Leap Forward: Here’s What’s On The Horizon

Ethereum’s (ETH) staking ecosystem has made headlines in the blockchain space since the recent Shanghai upgrade. As the crypto market continues to grow, Ethereum has emerged as a market leader in staking, offering some of the best yields and attracting more investors. But what exactly makes Ethereum’s staking so attractive?

Ethereum Staking Goes Big

According to DeFi Ignas, a leading expert in decentralized finance (DeFi), Ethereum’s ETH has the best token economics in crypto. One of the main reasons for this is Ethereum’s decision to move away from the Proof of Work (PoW) to a Proof of Stake (PoS) consensus mechanism. 

He suggests that If Ethereum had remained on PoW, $4.7 billion worth of ETH would have been issued, more than the entire market cap of UNI, Uniswap’s native token, at $4 billion. This move has made Ethereum supply deflationary, creating a more valuable asset for investors.

However, as DeFi Ignas points out, Ethereum’s staking ratio currently stands at just 14.8%, the lowest among major blockchains. This is despite offering a competitive ~4.5% APR. One reason for this low staking ratio is that other blockchains have a more concentrated token distribution, with insiders, team members, and early investors actively staking for rewards. 

According to DeFi Ignas, recent data suggests that the staking landscape is shifting, with some major players losing market share and a significant amount of ETH being withdrawn from staking platforms. In particular, Kraken, Coinbase, and Huobi have all seen a decline in their market share in the past month. Furthermore, 36% of all ETH staking withdrawals originate from Kraken.

Ethereum

It’s worth noting that when there are more withdrawals than deposits, it typically indicates a bearish sentiment among investors, as they sell their holdings in larger quantities than they are buying. This is further supported by the fact that around 40% of all ETH stakers have a negative ETH PnL, meaning they are holding ETH at a loss.

However, there is a silver lining to this data. According to DeFi Ignas, 29% of all ETH stakers have staked their ETH at the current price, which suggests that there are still many investors who believe in the long-term potential of ETH and are willing to hold onto their investments despite short-term market fluctuations, which for him, this is a bullish sign for the future of Ethereum staking.

ETH Staking, The Best Risk/Reward Option For Financial Freedom?

According to DeFi Ignas,  Ethereum staking is poised to overtake decentralized exchanges (DEXes) by total value locked (TVL), with just 15% of all ETH currently staked across 83 protocols.

Also, despite being a relatively new industry, the Liquidity Staking Derivative (LSD) ecosystem has already surpassed lending, bridging, and CDP stablecoins in terms of TVL, and it’s expected to continue growing in the future. 

Additionally, Distributed Validator Technology (DVT), which enables “squad staking” by allowing groups to stake different amounts of ETH collectively, is another trend gaining traction in the Ethereum staking ecosystem.

On the same note, the prominent crypto analyst McKenna has stated in a recent Twitter post that Ethereum’s staking rate has increased from 14.15% to 14.93% post-Shanghai, and this trend is expected to continue. McKenna predicts that ETH staking will become a major sink, with a staking rate close to 20% by the end of the year.

The increase in staking is also a bullish sign for the future of Ethereum, as it demonstrates the community’s commitment to the network and its success. As more funds are locked in staking, the circulating supply of ETH decreases, creating a scarcity that could potentially drive up the asset’s price.

Ethereum

Featured image from Unsplash, chart from TradingView.com

Bitcoin’s Upcycle Shows Small Drawdowns, Report

The Bitcoin (BTC) market has faced some resistance this week, according to a report by cryptocurrency analytics firm Glassnode. The market reverted from a weekly high of over $31,000 to a low of $27,000, signaling a potential correction in the market.

Despite this recent dip, Glassnode’s analysis shows that the opening to 2023 has been historically strong for Bitcoin, with remarkably few significant corrections. The largest correction seen so far has been -18.6%, a relatively small drawdown compared to past cycles.

Bitcoin Market Sees Transition From Loss To Profit

According to the report by Glassnode, the aggregate market for Bitcoin has confidently transitioned out of a period of unrealized loss and into one of unrealized profit. This is evidenced by the sharp divergence between supply held in profit versus supply held at a loss.

Bitcoin

As this shift occurs, the incentive to take profits grows, also reflected in the ratio between supply in profit and supply at a loss. Glassnode’s analysis shows that this oscillator has achieved escape velocity in 2023, confirming the transition out of a regime of loss dominance near cycle lows. This phenomenon has only been observed on 415 out of 4,638 trading days, or just 9% of the time.

This shift in the market is significant because it suggests that investors are becoming more confident in Bitcoin’s long-term prospects. As more investors move into a position of unrealized profit, they may be more likely to hold onto their investments rather than take profits and risk missing out on potential gains.

Will BTC Retest The $25,000 Support?

Altcoin Sherpa, a well-known cryptocurrency analyst, recently shared his thoughts on the current state of Bitcoin. He believes that if the current market area fails, the next area up is around $25k. He also noted that the .382 fib level, a technical indicator, usually gets tapped as a retest eventually. Despite this potential dip, Altcoin Sherpa maintains a bullish outlook on Bitcoin’s market structure. 

On the same note, Michael Van de Pope, a crypto analyst and trader, suggests that the market is seeking a higher low (HL) in the weekly timeframe, potentially around the $26,500-27,000 range or even as low as $25,000. This suggests that there may be some downside risk in the short term.

However, Van de Pope notes that breaking back above $27,800 could lead to a strong upwards reaction for Bitcoin, potentially continuing the uptrend toward $29,000.

Bitcoin

At the time of writing, Bitcoin is trading at $27,300, representing a 0.8% decrease over the past 24 hours. Despite this drop, Bitcoin is holding above its last major resistance level of $27,100. However, some analysts are predicting a potential retest of the $25,000 support floor, which could lead to further downside potential for the largest cryptocurrency in the market.

Featured image from Unsplash, chart from TradingView.com

XRP Correction Continues: Elliott Waves Theory Predicts Wave 2 At $0.38

Since reaching its yearly high of $0.5842 on March 29th, XRP has experienced a significant price drop. The token has lost its bullish momentum and failed to breach higher levels, disappointing investors who were optimistic about the uptrend of one of the largest cryptocurrencies in the market.

It is worth noting that XRP’s recent price drop is part of a wider market correction affecting the entire cryptocurrency market. Despite this, trader and crypto analyst “Dark Defender” believes that there is still further correction ahead for XRP.

No Signs Of Recovery For XRP?

On April 1st, Dark Defender made a bold prediction for the price of XRP based on Elliott Waves theory. According to Dark Defender, the token completed its first wave (W1) at around $0.59 and is expected to enter a second wave (W2) that will find support between $0.48 and $0.38.

XRP

As of now, there have been no changes to Dark Defender’s prediction, and XRP remains in correction unless it breaks its resistance level of $0.59 and stays above it for three consecutive days. Dark Defender has provided a list of support levels for XRP, including $0.4812, $0.45544, $0.42044, and $0.38813. The analyst believes that XRP will finish this last correction at one of these levels before targeting the $3 mark. 

Furthermore, the analyst has provided a bullish prediction for XRP’s future, stating that the third wave (W3) of this structure is expected to reach between $2 and $3.47 by the end of this year. However, this wave 3 above $1.33 will be the predecessor of the Grand Wave 3. In scenario 2, Dark Defender predicts that XRP will continue to rise in value.

As of this writing, XRP is currently trading at $0.4582, which represents a drop of over 2.6% in the last 24 hours. On wider time frames, the token has recorded significant drops of 11% and 9.2% in the seven and fourteen-day time frames, respectively. This means that if Dark Defender’s prediction is correct, XRP may still have plenty of downtrends to experience, potentially reaching the lower lows of March 21st at $0.380.

XRP’s Wide Adoption Continues To Increase

XRP has been gaining traction in recent months, with its unique utility in cross-border payments attracting attention from financial institutions and investors, which has been raising with its continuous innovations to provide a better service to its users. 

According to pro-XRP lawyer John Deaton, Uphold, a digital platform that allows users to buy, sell, and hold various cryptocurrencies and traditional currencies, currently holds $1.04 billion in XRP, making XRP the single largest asset holding on the platform. This amount is significantly greater than Uphold’s Bitcoin holdings, which currently stand at $131 million.

In addition, the token volume accounted for 28.33% of total transactions on Uphold’s platform. This indicates a growing demand for XRP among Uphold’s user base and suggests a positive outlook for the cryptocurrency’s future growth and adoption.

XRP

Featured image from Unsplash, chart from TradingView.com 


Is The Final Shakeout Moment Coming For Bitcoin? Expert Weighs In

In January of this year, Bitcoin broke above its 200-day MA for the first time since the end of 2021. This was a significant milestone for the cryptocurrency, as it had not seen such a signal in over a year. This breakout was a clear indication of Bitcoin’s bullish momentum and its potential for further growth in the future.

Additionally, Bitcoin retested the 200-day moving average in March and remained well above it, demonstrating its robust behavior. However, the leading cryptocurrency is approaching a lower-level retest at $28,000. Whether Bitcoin will withstand further price decline and continue its bullish trend or if a final shakeout is imminent.

Bitcoin’s Halving Cycle And Potential Dip Below The 200-Day MA

Recently, there has been speculation that Bitcoin’s price might be poised for a significant rally as spring arrives. However, the situation is not quite simple as with many things in the crypto world. 

According to the expert in the cryptocurrency industry, Mr. Ben Lily, the current halving cycle is an important factor to consider when evaluating Bitcoin’s price movements. When BTC comes off halving cycle lows, it commonly does not immediately clear the 200-day moving average (MA) and stays above it.

Instead, it tends to return below the 200-day MA before ultimately moving on to form all-time highs. This pattern can be observed in the chart below, which shows the 200-day MA (represented by the dark red line) and the orange circles, which indicate when the price dipped below the 200-day MA.

Bitcoin

Furthermore, Lily argues that nothing suggests that the market should expect anything different this time. He believes a catalyst coming this summer will coincide with Bitcoin’s price dipping below the 200-day MA. 

FedNow Rollout And Bitcoin: A Tale Of Two Timing

Additionally, Ben Lily has provided further analysis on the potential impact of the upcoming rollout of the Federal Reserve’s CBDC, FedNow, on Bitcoin’s price movements. According to Lily, if the rollout occurs as scheduled in July, it could benefit BTC’s price trajectory.

However, Lily notes that in each of the last three halving cycles, Bitcoin’s price dipped below the 200-day moving average (MA) between 217 and 315 days before the halving itself. If this pattern holds for the current halving cycle, we can expect BTC’s price to dip below the 200-day MA sometime between June and August.

With FedNow set to roll out in the middle of that period, Lily suggests we can expect regulator “war drumming” to be at a fever pitch. This could lead to a final shakeout moment as Bitcoin drops below the 200-day MA, creating a higher low in the market.

At the moment of writing, Bitcoin, the largest cryptocurrency by market capitalization, is being traded at $28,000, indicating a decrease of over 2.5% in the last 24 hours. And, as reported yesterday by NewsBTC, the $27,700 line is key for Bitcoin, as a breakout below this level could signal a shift in the market sentiment and potentially lead to a further decline in price.

Bitcoin

Featured image from Unsplash, chart from TradingView.com

Does the Crypto Market Have The Strength To Break To The Upside? QCP Capital Weighs In

The conditions of the cryptocurrency market have changed drastically; according to an analysis by QCP Capital, the options market in its current state makes the crypto industry look like a major crisis, such as the shutdown of crypto exchange FTX after filing for bankruptcy, never happened.

Trading desk QCP Capital published observations on the crypto industry, revealing some key points to consider for the coming months.

The Crypto Market Comes Back To Life

QCP’s analysis points out that Bitcoin (BTC) risk reversals have been trading in positive territory over the past week, which tells us that calls (buys) have been more expensive than puts (sells) since 2021 across multiple tenors.

This is unusual for the sector as BTC typically has a persistent put skew, mainly due to miner/treasury hedging activity. The chart below depicts this market behavior and the bullish sentiment impacting the options sector.

Put skew drives the price of puts higher and calls lower. This difference in pricing between options is called skew and, under normal circumstances, puts trade with higher volatility than calls precisely because investors are hedging some of their bullish positions.

For the trading desk, this means that the sentiment in the cryptocurrency market has shifted from bearish to bullish, a culmination of what has been happening in the macro market and the slight recovery in the economy.

Bulls Might Get Their Hearts Broken On Valentines Day

Ethereum’s (ETH) implied volatility (IV), which represents the expected volatility of a stock or currency over the option’s life, has fallen, indicating complacency as the market prices out fears of a price collapse, according to the analysis.

Crypto

The enthusiasm in the market can be measured by the amount of “fear of missing out” (FOMO) that has set in, with many chasing prices and the top by buying high delta calls and going long in the spot market over the past week.

With the upcoming “Big Bad” Federal Open Market Committee (FOMC) meeting, the trading desk expects the market to be more cautious and conservative.

According to QCP, the following potentially problematic date will be February 14th, when the following CPI report will occur, which can potentially “break the heart of the bulls.”

For QCP, this is the same scenario the market experienced in December. Similarly, the price may experience a topside breakout characterized by a highly sharp and violent movement.

Bitcoin is currently trading at $23,200 and seems to be paving the way for the conquest of new levels. It has gained 0.7% in the last 24 hours and 10.3% in the last seven days. Bitcoin is trying to break the next obstacle represented by the $24,400 level.

Crypto BTC BTCUSDT ETH ETHUSDT

Ethereum is trading at $1600, up 0.3% in the last 24 hours, with sideways price action. The next resistance wall is at $1,691, a zone the bulls have not visited since September 2022. Ethereum has gained 3.8% in the last seven days.

Crypto ETH ETHUSDT Bitcoin BTC BTCUSDT

Cover image from Unsplash, charts from Tradingview.

XRP Bulls Try To Break Consolidation At $0.4 To Conquer New Levels

XRP bulls are trying to ride the wave along with Bitcoin to reclaim previously lost territory. The bulls are targeting new annual highs.

XRP has been trading in the green zone since the beginning of the year with a strong recovery and bullish sentiment from its investors. At press time, XRP is trading at $04.96, representing a gain of 0.78% in the last 24 hours. The token is auctioning 34% below its 2018 high of $3.40.

Can XRP Sustain Its Bull Streak?

XRP started the year with a spike in volatility that characterized the market and has been able to profit 11.85% in the last 30 days, pushing its market cap to $20.6 billion. 

In addition, the trading volume that XRP has experienced in recent days and weeks and the profitable trend of XRP shows that market makers are involved in the project. According to a recent report from NewsBTC, it’s possible to assume that  XRP whales are once again buying and accumulating the token. 

This increase in activity in the XRP Ledger’s native token suggests that more wallets are being created with large amounts of XRP. While the perspective of many investors may be bullish, we can also find traces that lead us to consider a bearish scenario. 

XRP can break the trend line that touches three key levels and continue its bullish trend to find a position in the following challenge represented by $0.5.

XRP Heaven or Hell Levels

Despite the breach of previous target zones, there are strong signals that XRP’s bullish days may be numbered. The current market scenario, where some tokens are consolidating or forming a range price, suggests that the price action can explode in any direction.

As with any pivotal moment in the market, this leaves XRP with two scenarios, which are explained in the following chart:

XRP can break the trend line that touches three key levels and continue its bullish momentum to find a position in the following challenge represented by $0.5.

XRP XRPUSDT

On the daily chart above, XRP has formed a bearish divergence, which may represent a significant pullback for the token. The Relative Strength Index (RSI) sits at 42.51, approaching oversold territory, but for XRP, there needs to be a correction in the daily time frame before the price action can follow the RSI indicator.

If this is confirmed, XRP could significantly retreat to the $0.36 support level. If the bulls cannot stop this hypothetical scenario, the token may also lose territory and test the $0.288 level. 

In short, XRP needs to find its momentum before a significant correction of the token and the cryptocurrency market, with Bitcoin (BTC) and Ethereum (ETH) forming bearish divergences on the daily charts.

Confirmation of the bearish divergences for XRP will be complete when the price action breaks below $0.379. In that case, bears may find themselves in the perfect scenario to ride down the hill to visit lower prices. If XRP’s downturn continues, it could retest $0.33, the following primary support line for the token.