Cardano Entry Of A Lifetime: Analyst Predicts 5,600% Rally To $25

Cardano is currently in a downtrend, continuing to show bearish tendencies as its price trends below $0.5. However, where many have seen an altcoin that does not have many prospects, crypto analyst FieryTrading believes that the digital asset is giving investors an opportunity to get in for cheap.

Cardano Can Break Out Of Parallel Channel

In an analysis on the TradingView website, crypto analyst FieryTrading alludes to Cardano’s ability to break out and go on a massive bull run. The analysis draws from a previous analysis where the analyst had pointed out that the Cardano price had entered a parallel channel.

This parallel channel emerged with the last cycle’s top going into the current cycle top with a line drawn from the last cycle’s bottom when the lockdown had sent crypto prices crashing. Despite the crypto analyst first pointing out this parallel channel back in 2023, they believe that it continues to remain valid, especially as the price continues to rtend low.

Back then, the crypto analyst had predicted that the ADA price, if it were to break out of this parallel channel, could rise as high as as $35. This bullish expectation continues with the most recent analysis, albeit with a price adjustment.

In the Wednesday analysis, FieryTrading notes that There is still the possibility for the altcoin’s price to reach the top of the channel. In this case, the price would fully complete the move toward $30. However, the crypto analyst’s chart carries a $25 target, which would be a 5,600% rally from its current level.

Cardano price chart from TradingView.com

ADA Bears Maintain Control

Despite the bullish outlook maintained by the crypto analyst, Cardano has succumbed to the bears. The price has dropped as low as $0.44 in the last day, indicating a 1.38% decline. On a wider timeframe, the ADA price looks even worse, with an almost 28% drop in one month.

However, despite this trend, the analyst still believes that investing in Cardano right now is a risk worth taking. FieryTrading refers to it as “the entry of a lifetime” that could guarantee good returns. Moreover, the analyst gives it a R/R (risk/reward) ratio of 116, which is a good number.

For now, the ADA price is still struggling to hold up in the market. This is not helped by the decline in market sentiment, leading to a nasty 22% drop in its daily trading volume, according to data from Coinmarketcap.
Cardano price chart from Tradingview.com

Crypto Analyst Predicts 350% Surge For Shiba Inu – Here’s The Target

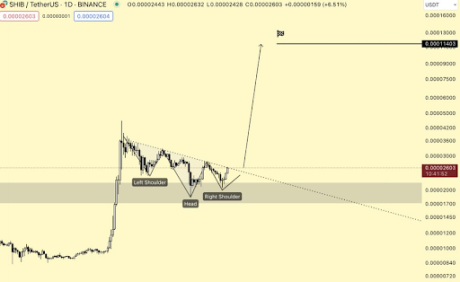
Crypto analyst Crypto Dona has predicted a 350% price surge for Shiba Inu (SHIB). He suggested that the meme coin will unlikely go higher than that in this bull run. 

Shiba Inu To Rise To $0.00011

Crypto Dona revealed in an X (formerly Twitter) post that his price target for Shiba Inu is $0.00011 and that he doesn’t see the meme coin going higher. A rise to that level represents a 350% price surge for the meme coin, which will undoubtedly appeal to Shiba Inu investors.

Related Reading: Here’s How This Ethereum Whale Made $16 Million From A Single Trade

Crypto Dona joins a host of other crypto analysts who predict that Shiba Inu could shed another zero from its current price level and rise to $0.0001. However, some of these analysts have given a way higher price prediction than Crypto Dona’s. One is Javon Marks, who predicts that Shiba Inu could rise to as high as $0.0001553.

Crypto analysts like Armando Pantoja and Ali Martinez have also made much higher predictions, predicting that Shiba Inu could rise to $0.001 and $0.011, respectively. Forecasts like these have undoubtedly raised the expectations for SHIB in this bull run, with community members optimistic that the meme coin could flip Dogecoin (DOGE) in this market cycle. 

Shiba Inu’s lead developer, Shytoshi Kusama, is also confident about the meme coin’s potential in this market cycle. He suggested that the meme coin is in a good position to lead this season. He alluded to Shiba Inu’s technology, vision, plan, and community as some of the reasons he holds this belief. 

The First Step Is Hitting A New All-Time High (ATH)

While Shiba Inu undoubtedly looks primed to make big moves in this bull run, the first step will be for the meme coin to rise above its current all-time high of $0.00008845, as it is currently 70% down from that price level. Shiba Inu’s Marketing Lucie has earlier predicted that the meme coin could hit a new ATH before or shortly after the Bitcoin Halving.

Related Reading: Can Ethereum Reclaim $4,000? Fragile Fundamentals Threaten To Send ETH Crashing

Crypto analyst and trader Xanrox also hinted that SHIB may hit a new ATH of $0.00008854 by July. Shiba Inu rising to a new ATH by then could set the pace for it to hit other bullish price predictions that crypto analysts have made for the meme coin. Meanwhile, it is also worth mentioning that Shiba could soon come close to its current ATH with Ali Martinez highlighting a bull flag on Shiba Inu’s chart which he belives could send the meme coin to $0.000072323. 

At the time of writing, Shiba Inu is trading at around $0.0000227, down over 4% in the last 24 hours, according to data from CoinMarketCap. 

Shiba Inu price chart from Tradingview.com

Fundstrat CEO Predicts When Bitcoin Price Will Reach $150,000 And $500,000

Thomas Jong Lee, the Chief Executive Officer (CEO) of Fundstrat, an independent financial research boutique, has maintained a bullish stance on Bitcoin. The financial analyst has predicted that the world’s largest cryptocurrency could surge massively, doubling its current price to reach $150,000 during the 2024 crypto market cycle. 

Bitcoin Could Go Parabolic In 2024

During a recent interview on Squawk Box, CNBC on May 7, Lee doubled down on his previous Bitcoin forecast, expressing strong confidence that the pioneering cryptocurrency would experience a dramatic surge before the end of 2024. He predicts that Bitcoin, currently priced at $62,371, according to CoinMarketCap, will exceed previous all-time highs and reach $150,000. 

Related Reading: Can Ethereum Reclaim $4,000? Fragile Fundamentals Threaten To Send ETH Crashing

The Fundstrat CEO disclosed earlier in April in an interview with CNBC Television, that “Bitcoin would definitely make new all-time highs this year,” predicting that the cryptocurrency could surge to $150,000 in 2024, and $500,000 long term. 

He highlighted that the strong demand for BTC has been fueling its price increase. Furthermore, the integration of the Rune Protocol, a new token standard for issuing fungible tokens on the Bitcoin network, has also bolstered the blockchain’s network. 

Lee’s ambitious forecast of Bitcoin comes at a time when the market has been experiencing significant volatility and periods of fluctuations. Bitcoin previously surged to an all-time high above $73,000 in March, propelled by the hype and demand for Spot Bitcoin ETFs.

However, after Bitcoin halving on April 20, which many analysts and investors believed would trigger another price rally, BTC witnessed a dramatic drop, falling as low as $57,000 at some point in May. 

Despite the upheaval in the broader crypto market, Lee remains optimistic about Bitcoin’s long-term value. His unwavering confidence in the cryptocurrency’s robust price fundamentals is reflected in his expectations of a potential price surge to or even exceeding half a million in the coming years. 

Factors Point To Upward Momentum After FED Rate Cut

While Lee made his bullish projections about Bitcoin, he also discussed the present inflationary situation and economic conditions of the United States. According to the Fundstrat CEO, inflation in the US is set to cool off dramatically, potentially triggering an upward momentum for Bitcoin if this happens. 

Related Reading: Here’s How This Ethereum Whale Made $16 Million From A Single Trade

The CEO disclosed that the Federal Reserve (FED) currently has more leeway to cut rates, citing their impacts on the country’s banking balance sheet. Although he refrained from specifying a precise timeline for the drop in the US inflation rate, Lee indicated that it could potentially occur by the second half of 2024. 

Overall, the Fundstrat CEO has maintained an optimistic outlook for inflationary pressures in the US, with Bitcoin typically serving as a hedge against inflation and a store of value during these periods of economic uncertainty. 

Bitcoin price chart from Tradingview.com

Bitcoin Suffers Massive Outflows Amid Crypto Market Uncertainty, Tops $284 Million

The recent unimpressive price action of Bitcoin is playing out in the minds of institutional investors, with recent data highlighting their bearish sentiment. This has led to a wave of massive outflows from  Bitcoin investment products, which could negatively impact the flagship crypto. 

Bitcoin Investment Products Record $284 Million Of Outflows

CoinShares revealed in a blog post that Bitcoin investment funds recorded an outflow of $284 million last week. Most of these outflows are said to have come from the US Spot Bitcoin ETFs, which saw outflows of $156 million last week. CoinShares noted that last week was the first time these funds recorded such a measurable amount of outflows. 

Related Reading: Can Ethereum Reclaim $4,000? Fragile Fundamentals Threaten To Send ETH Crashing

These US Spot Bitcoin ETFs indeed had a week to forget last week, as even BlackRock’s iShares Bitcoin Trust (IBIT) recorded its first day of outflows since launch, with almost $37 million exiting the fund. 

CoinShares suggested that the magnitude of outflows was likely due to Bitcoin dropping below $62,000, which they estimate is the average purchase price of these ETFs since launch. Therefore, they claim that Bitcoin’s decline may have triggered automatic sell orders. 

Before now, institutional investors had already shown mixed feelings towards these funds thanks to Bitcoin’s recent price action. As such, it makes sense that Bitcoin dropping below $60,000 made them panic sell instead of holding their positions. 

Despite this development, CoinShares noted that the Spot Bitcoin and Ethereum ETFs in Hong Kong which launched last week, were a bright spot, recording $307 million in inflows in the first week of trading. The launch of these funds could prove timely, with Bitcoin needing a catalyst to continue its upward trend. 

Interestingly, CoinShares revealed that Bitcoin was the only crypto asset to record outflows. On its part, Ethereum broke its seven-week streak of recording outflows, with $30 million flowing into Ethereum investment products. Other altcoins like Avalanche, Cardano, and Polkadot also saw inflows. 

Spot Bitcoin ETFs Still Not In The Clear

With Grayscale’s GBTC recording its first day of net inflows last week, there was the feeling that such development could spark a turnaround in the outflows that the Spot Bitcoin ETFs have been recording. However, that hasn’t been the case. On May 7, these funds recorded a net outflow of $15.7 million. 

Related Reading: Here’s How This Ethereum Whale Made $16 Million From A Single Trade

GBTC was again the primary culprit, with the fund seeing a net outflow of $28.6 million. These outflows have continued to affect Bitcoin’s price negatively, given the amount of selling pressure it is piling on the flagship crypto. 

At the time of writing, Bitcoin is trading at around $62,300, down over 2% in the last 24 hours, according to data from CoinMarketCap. 

Bitcoin price chart from Tradingview.com

Can Ethereum Reclaim $4,000? Fragile Fundamentals Threaten To Send ETH Crashing

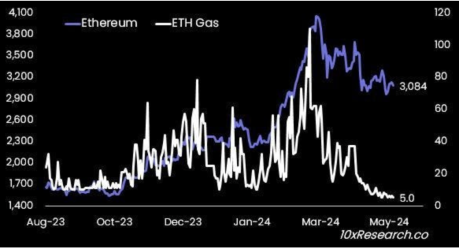
Ethereum has put on a disappointing performance for its investors over the last few weeks, leading to concerns on whether the second-largest cryptocurrency by market cap has lost its shine. The cryptocurrency continues to skirt around the $3,100 level, not making any significant breaks upward. This points to weak fundamentals that could trigger a price decline.

Ethereum Fails To Make Meaningful Moves

Markus Thielen, Head of Research at 10x Research, has pointed out some worrying developments with the Ethereum price. In a new report shared with NewsBTC, he explains that despite Ethereum remaining highly correlated to Bitcoin with an R-Square of 95%, it continues to perform poorly while the latter has made new all-time highs.

Thielen points back to ETH’s performance in the last bull market, which was closely tied to new sectors popping out of the network, such as decentralized finance (DeFi) and non-fungible tokens (NFTs). This caused demand to skyrocket, and in turn, the price followed as users gobbled up ETH for the high gas fee required to transact on the blockchain.

However, Ethereum has failed to maintain this momentum, which can be attributed to its inability to bring the upgrades that users needed in time. Thielen explains that the Dencun upgrade which helped solved the high gas fee issues had come three years too late because by 2024 when the upgrade arrived, users had moved on to Layer 2 networks. Also, during this time, other Layer 1 networks have seen a rise in users and Solana is one example of this.

Ethereum fees

The researcher further explained that the weak fundamentals of ETH are now not only affecting its price but has had a spillover effect to Bitcoin. “Ethereum’s weak fundamentals are becoming a roadblock for Bitcoin as they prevent broad fiat inflow into the crypto ecosystem,” Thielen stated.

Better To Short ETH

Thielen’s analysis of Ethereum also spreads to the drop in stablecoin usage on the network. Back in 2021, Ethereum had dominated stablecoin transactions such as USDT and USDC. However, it seems like, with other things, the high fees have driven users towards other networks. Blockchains such as Tron (TRX) are now dominating stablecoin transactions, leaving ETH in the dust.

Additionally, there is also the fact that ETH’s issuance is turning inflationary once again. After the London Hard Fork, also known as EIP-1559, was completed in 2021, the network saw its issuance turn deflationary for the first time as ETH burned quickly surpassed ETH being brought into circulation.

However, this has now changed in the past months as there have been more ETH issued than those burned, Thielen notes. To put this in perspective, a total of 74,000 ETH were issued compared to only 43,000 ETH burned. This inflation, coupled with the fact that staking rewards have now dropped to 3%, below the 5.1% offered by Treasury Yields, Ethereum has had a hard time maintaining bullish sentiment.

Given these developments, the researcher believes it is better to be bearish on Ethereum right now. “Right now, we would be more comfortable holding a short position in ETH than a long one in BTC as Ethereum’s fundamentals are fragile, which is not yet reflected in ETH prices,” Thielen concludes.

Ethereum price chart from Tradingview.com

Bloomberg’s Mike McGlone Reveals Why A $150,000 Bitcoin Price Target Is Far Off

Mike McGlone, Senior commodity strategist at Bloomberg Intelligence, has made a rather pessimistic prediction for Bitcoin, emphasizing that the cryptocurrency’s potential rise to $150,00 was a long shot. The strategist has revealed factors that could make Bitcoin’s projected surge to $150,000 difficult, highlighting both macroeconomic trends and Bitcoin’s performance in 2024

Bitcoin Surge To $150,000 Unlikely

In a recent interview with Scott Melker, the host of “The Wolf Of All Streets,” podcast, McGlone discussed Bitcoin’s price fundamentals and its possible rise to $150,000 in the 2024 bull cycle. 

Comparing Bitcoin with the stock market index, the S&P 500, the Bloomberg strategist disclosed that the cryptocurrency was currently showing “divergent weakness,” highlighting that Bitcoin’s performance against the S&P 500 in 2021 was greater compared to 2024. 

He also revealed that Bitcoin was displaying a similar weak performance to Gold, emphasizing current market conditions and the risk of short-term deflation in the financial market. 

The combination of these factors pushes McGlone to believe that Bitcoin’s short-term projected rise to $150,000 was unlikely. 

While the Bloomberg strategist made his foreboding prediction despite Bitcoin’s overperformance at the beginning of the year, McGlone still remains optimistic about the cryptocurrency’s price and fundamental value in the long term. 

Co-founder and CEO of CoinRoutes, Dave Weisberger, who was also in the podcast with McGlone, made a more optimistic prediction for Bitcoin. Basing his analysis on historical trends and patterns as far back as 2015, Weisberger forecasted that Bitcoin could rise to $200,000 this cycle. 

His forecast is also acknowledged by reformed hedge fund manager, James Lavish, who revealed in the podcast that Spot Bitcoin ETFs could become a potential driver for Bitcoin’s continuous growth. This is attributed to the massive impact Bitcoin ETFs had on the cryptocurrency’s price following its launch on January 11, 2024. 

After Spot Bitcoin ETFs were successfully released into the market, the price of Bitcoin skyrocketed to new all-time highs above $73,000. At the time of writing, the cryptocurrency is trading at $63,778, marking a 0.89% increase over the past seven days, according to CoinMarketCap. 

BTC Crash Presents Perfect Opportunity

According to Lavish, if Bitcoin crashes down to the $30,000 to $40,000 range, it would present a “tremendous opportunity” for investors to acquire substantial value in a long-term asset that will essentially hold its value and continue to appreciate in the future. 

The reformed hedge fund manager revealed that Bitcoin’s short-term volatility and market unpredictability could produce long-term capture of value. This suggests that by strategically navigating through the price fluctuations of Bitcoin, investors could potentially capitalize on its volatility to accumulate wealth over time, which in turn could favorably impact the price of the cryptocurrency.

Bitcoin price chart from Tradingview.com

Here’s How This Ethereum Whale Made $16 Million From A Single Trade

An Ethereum whale was recently revealed to have made $16 million from a single trade involving the second-largest crypto token by market cap. This whale’s story again highlights how conviction in an investment can be very rewarding in the crypto space. 

How This Ethereum Whale Made $16 Million In A Single Trade

On-chain analytics platform Lookonchain revealed in an X (formerly Twitter) post that the whale withdrew 12,906 ETH ($24.39 million) from Binance when the crypto token was still trading at $1,890 a year ago. With Ethereum currently trading at around $3,100, the whale’s ETH investment is now worth over $40 million, signifying a profit of about $16 million. 

Interestingly, his profits from this trade will likely be more than $16 million, as the trader deposited those tokens in the staking platform Lido when he withdrew them from Binance last year. That means he also earned significant staking rewards to go alongside his $16 million profit. 

On-chain data shows the whale recently withdrew 7,000 ETH ($21 million) from Lido back to Binance but has yet to offload these tokens. However, that is something to keep an eye on as the whale offloading those tokens could have a negative impact on Ethereum’s price. 

Tron’s founder, Justin Sun, looks to be another Ethereum whale that could make such significant returns on their ETH investment. Two wallets believed to belong to Sun are reported to have accumulated 295,757 ETH ($891M) at an average price of $3,014 since February 12. Since then, Sun has made some notable moves that could be profitable for him.

One such move is that the Tron founder recently deposited 120,000 eETH into Swell L2, a liquid restaking protocol. Although Sun claims that this move isn’t profit-motivated, he could still make huge profits from his venture, considering that restaking is one of the leading narratives at the moment. 

The Bull Run Presenting A Lot Of Opportunities

There have been a lot of reports highlighting how crypto investors and traders have been making life-changing, which suggests that the bull run is already in full force despite Bitcoin’s unimpressive price action lately. One opportunity that these traders have taken advantage of in this market cycle is meme coins

Before the bull run began, there was the belief that memes would be one of the leading narratives, and that has been the case. Bitcoinist recently reported two Solana meme coin traders turned $6,400 into $8 million. Meanwhile, Lookonchain revealed a Solana trader who turned 60 SOL ($8,673) into $1.26 million in 2 months, making a 144x return on his investment. 

Ethereum price chart from Tradingview.com

Why Is The Bitcoin Price Falling Today?

Bitcoin (BTC) has experienced a price slowdown, having recently recovered above $60,000. This tepid price movement is believed to be due to a couple of factors, including the reduced demand for the Spot Bitcoin ETFs

Spot Bitcoin ETFs Have Lost Their Spark

The Spot Bitcoin ETFs recorded billions of dollars in net inflows in the first three months of launch. This contributed to the significant rally that Bitcoin recorded right around when the funds were approved, with the flagship crypto rising to a new all-time high (ATH) in March. However, demand for these funds has declined since the start of this month. 

Research firm Kaiko also noted in its recent report that net inflows across all ETFs have steadily dropped for a while now. This has ultimately affected Bitcoin’s bullish momentum, with the flagship crypto trading sideways. Bitcoin’s price performance in the last 24 hours suggests that the recovery above $60,000 wasn’t necessarily a bullish reversal.

Andrey Stoychev, Head of Prime Brokerage at Nexo, had previously warned that Bitcoin was unlikely to experience any significant price surge without a catalyst. He added that the crypto token would likely continue to trade around the $67,000 price range. That means one can expect Bitcoin to keep bouncing off the support and resistance in the meantime. 

The silver lining is that the demand in the Spot Bitcoin ETFs could pick up soon enough, with these funds likely to provide a much-needed boost to Bitcoin’s price when that happens. A trend reversal for these ETFs looks imminent, especially after Grayscale’s GBTC recorded its first day of net inflows on May 3. 

Another Reason Why Bitcoin’s Price Is Down

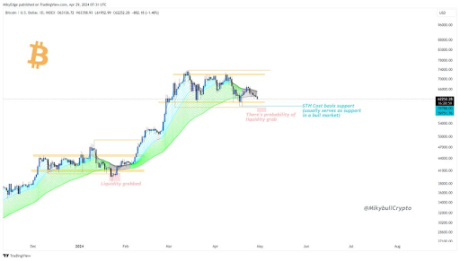
Crypto analyst Mikybull Crypto also recently predicted that Bitcoin could drop below to clear the CME (Chicago Mercantile Exchange) gap at around $62,580. This price gap exists because the CME’s Bitcoin futures market doesn’t run on weekends. The crypto analyst added that things could pick up once Bitcoin clears the CME gap. 

The analyst also suggested that the worst may be behind, irrespective of whether Bitcoin continues to trade sideways, as he stated that the crypto token’s local bottom is in. However, Mikybull Crypto also predicts that Bitcoin will need to clear out the $67,000 price level and consolidate before it can move towards $73,000. 

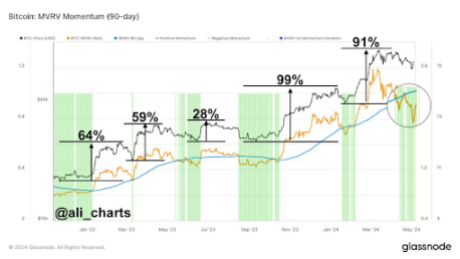
In anticipation of this price surge, now looks to be an excellent time to accumulate the flagship crypto as crypto analyst Ali Martinez mentioned that Bitcoin’s Market Value to Realized Value (MVRV) 90-day ratio indicates that it is still in a “prime buy zone.”

At the time of writing, Bitcoin is trading at around $63,400, down over 1% in the last 24 hours, according to data from CoinMarketCap. 

Bitcoin price chart from Tradingview.com

Crypto Analyst Says Cardano Bloodbath Far From Over, Sets Bottom Price For ADA

Cardano has recovered from its April lows and continues to maintain a strong momentum above $0.45. This has prompted expectations that the altcoin will go on a rally from here. However, not everyone shares this sentiment as one crypto analyst expects the price to crash further from here.

Cardano Will Crash Back Below $0.45

In the latest video on his YouTube channel that revolved around Cardano’s future trajectory, crypto analyst, ‘More Crypto Online’, revealed why the ADA price is poised for more decline. The analyst pointed out that the altcoin is currently in its 3-wave corrective rally.

Now, the Elliot Wave Theory which is being referred to by the crypto analyst consists of five waves. Out of the five, three are bullish and two are bearish. The bullish waves involve the 1, 3, and 5, with 2 and 4 being bearish waves.

If the analyst is correct and the Cardano price has only completed three waves so far, that means the fourth wave, which is a bearish wave, is yet to be established. As a result, the crypto analyst believes that the Cardano price will further break down as it enters the fourth wave.

He further pointed out that the altcoin’s price had fallen below the $0.48 support, which was an important level for it. This, coupled with the fact that it is yet to enter the fourth wave, has the analyst convinced that the price crash is far from over.

As for where the ADA price might end up in this fourth wave, the crypto analyst believes it will go as low as $0.42 before recovering again. However, the good news is that once the fourth wave is completed, it gives way for the fifth wave to begin, which is the most bullish of all the waves and could see the ADA price barrel past $1.

ADA Metrics Still Bullish

Despite the bearish outlook presented by the crypto analyst, major Cardano metrics continue to show bullish divergence. For example, the daily trading volume of the altcoin has risen almost 17% in the last day to cross $286 million, data from CoinMarketCap shows.

This drastic rise in daily trading volume suggests a return of interest in the altcoin and this could quickly translate to a bullish trend, especially in the short term. Additionally, the fact that the price is on the rise at this time suggests that the majority of the transactions as a result of this renewed interest is from buyers rather than sellers. This suggests that the price will continue to rise if this demand is sustained.

At the time of writing, ADA is still sitting firmly above $0.45, with a 1.78% increase in the last day.

Cardano price chart from Tradingview.com

Shiba Inu Price Prediction: Crypto Analyst Says Massive Surge Is Coming, Here’s The Target

Shiba Inu has rebounded by over 19% from its $0.00002081 price point at the beginning of the month. Current price action shows the cryptocurrency might be on its way to performing an interesting price surge in the coming weeks. According to one crypto analyst, SHIB could actually go on a 120% price surge after breaking out of the current consolidation.

Crypto Analyst Says Massive Surge Coming

SHIB kickstarted a price correction immediately after reaching 0.00003556 in early March. Bullish investor sentiment surrounding the meme cryptocurrency at the time quickly changed into a bearish one. This pushed SHIB on a decline that bottomed out at $0.00002117 in the middle of April, indicating a 40% price correction in those two months. Interestingly, this was the worst SHIB price decline since the May 2022 collapse of the Terra ecosystem.

Related Reading: Why Did The Solana (SOL) Price Jump Today?

As noted on the 8-hour timeframe chart shared on social media platform X by crypto analyst World Of Charts,  SHIB has been on a consolidation channel for the past two months. However, the analyst foresees a bullish breakout to create a strong bullish wave that’s going to send SHIB holders on a profit margin between 100% and 120%.

Interestingly, a further look into the chart shared by World Of Charts shows that the analyst is open to a higher price surge over a longer period of time. The last price target indicated on the chart is $0.00009500, which is a 280% target from the current price levels. 

Can Shiba Inu Push Higher?

Shiba Inu recently formed a higher low on the weekly timeframe, an indicator that the bulls might be starting to gain the upper hand. Despite the past decline, over 56% of SHIB holders remained in profit as many long-term holders opted to hold on to their tokens. At the time of writing, SHIB is trading at $0.00002489 and is up by 6.4% in the past seven days. This price increase has seen the number of SHIB holders in profit rising concurrently to 61%.

Related Reading: Bitcoin Relative Strength Jumps To 40%: 10x Research Reveals Next Steps From Here

Many addresses that just moved into profit margin are not taking profit indicating that majority of investors are anticipating a price increase in May. One catalyst that could lead to a further price increase is the recent partnership between PayPal and MoonPay which will allow PayPal users within the United States to buy the dog-themed cryptocurrency easily.

Popular crypto analyst Ali Martinez also predicted a SHIB price surge based on a bull flag that has recently appeared on the token’s price chart.

Shiba Inu price chart from Tradingview.com

Crypto Whale Spends $10.4 Million On PEPE, Do They Know Something You Don’t?

A crypto whale’s transaction involving the third-largest meme coin by market cap, PEPE, has drawn the crypto community’s attention. The magnitude of the transaction, coupled with some other whale transactions, suggests that it may be high time to pay more attention to PEPE. 

Crypto Whale Spends $10.4 Million On PEPE

On-chain analytics platform Spotonchain revealed a wallet (3eAaAC3C9) that had purchased 1.238 trillion PEPE from Binance at an average price of $0.000008424 ($10.4 million). This wallet then proceeded to withdraw the tokens in two transactions. On-chain data shows that the whale withdrew 322.5 billion PEPE in the first transaction and the remaining 915.85 billion PEPE in the second transaction

At the time of writing, the whale hasn’t moved the tokens, suggesting they may be looking to hold for the long term. Some notable smart traders look to have been accumulating the meme coin lately, most likely in anticipation of significant price moves from it. Spotonchain also recently revealed two whales that had withdrawn 660.7 billion PEPE from Binance and MEXC. 

The platform also mentioned another whale that withdrew 322.48 billion PEPE ($2.68 million) from Binance for the first time. More recently, Spotonchain drew the crypto community’s attention to a smart trader who has been profiting from the meme coin since last year. This trader is said to have completed 8 trades and realized a cumulative profit of $917,000. 

Seeing how PEPE has performed since the start of the year, these whales’ interest in the meme coin isn’t surprising. Data from CoinMarketCap shows that PEPE has made a year-to-date (YTD) gain of over 500%, and this bullish momentum looks to be far from over. Interestingly, many traders have yet to jump on the the wave, as just over 200,000 persons hold the meme coin. 

Price To Hit New All-time High (ATH) Soon

Crypto analyst Plazma recently suggested that PEPE could soon hit a new all-time high. PEPE’s current ATH is at $0.00001074, with the meme coin trading just 20% below this price level. Crypto analyst Yazan also hinted that meme coin would soon hit a new all-time high, asking his followers if they were ready for this to happen. 

PEPE is currently ranked as the thirtieth largest crypto token by market cap and is likely to climb higher if it eventually hits a new ATH. Crypto analyst and trader Murad believes that the meme coin could rise to the top 10 crypto tokens by market cap since he predicted that PEPE could flip Shiba Inu (SHIB) and possibly Dogecoin (DOGE).

At the time of writing, the meme coin is trading at around $0.000008615, down in the last 24 hours, according to data from CoinMarketCap.  

PEPE price chart from Tradingview.com

Here’s Why This Crypto Analyst Believes Bitcoin Is At A ‘Prime Buy Zone’

Crypto analyst Ali Martinez has revealed that it may still be an excellent time to accumulate Bitcoin. This comes amidst the flagship crypto’s recent price recovery, with the crypto token skyrocketing above $64,000. 

Bitcoin Is Still In A “Prime Buy Zone”

Martinez mentioned in an X (formerly Twitter) post that Bitcoin’s Market Value to Realized Value (MVRV) 90-day ratio indicates that it is still in a “prime buy zone” despite its recent price surge from $57,000 to $64,000. The MVRV is a metric used to determine whether a crypto token is undervalued or overvalued. 

 Bitcoin

Based on Martinez’s findings, Bitcoin looks to be currently undervalued, which presents a good opportunity to accumulate the crypto token. The analyst’s revelation undoubtedly provides reassurance for those who failed to buy the dip and are looking for a perfect entry to invest in Bitcoin. 

Interestingly, Bitcoin whales didn’t waste time accumulating during Bitcoin’s recent decline, as Bitcoinist reported that these investors bought 47,500 BTC ($2.8 billion) between May 2 and 3. However, the MVRV ratio being at that level suggests that many of these whales are investors adding to their positions, meaning that significant buying pressure shouldn’t be expected anytime soon. 

Crypto analyst Michaël van de Poppe also recently suggested that Bitcoin is still undervalued. He noted that the crypto token is back above $60,000, and retail isn’t here yet. He mentioned in another X post that these retail investors won’t return until the summer, which means that everyone currently positioning themselves is still early. 

BTC Almost Ready For Next Leg Up

Crypto analyst Mikybull Crypto recently hinted that Bitcoin is almost ready for another parabolic rally. He stated that Bitcoin’s local bottom is in considering that the “next liquidity grab interest is above.” He added that Bitcoin will first “clear out the $67,000 level and consolidate in preparation for the $73,000 level. 

Related Reading: Fantom Revival: Crypto Analyst Predicts A Jump To $1.2 For FTM Price

Bitcoin 2

Meanwhile, the analyst revealed in another X post that Bitcoin has “finally experienced a MACD (Moving Average Convergence/Divergence) bullish cross” on the daily chart, just like it did in January 2024, which led to the crypto token rising to as high as $73,000 in March. According to Mikybull Crypto, Bitcoin reclaiming above the 50-day Moving Average will “further confirm the bullish continuation.”

For those looking to long Bitcoin, Mikybull Crypto remarked that the $64,000 range is an “ideal zone” to do so. He predicts that Bitcoin might clear out the CME gap between $62,580 and $64,105 before consolidating at around $64,000. 

At the time of writing, Bitcoin is trading at around $65,300, up over 2% in the last 24 hours, according to data from CoinMarketCap. 

Bitcoin price chart from Tradingview.com

Why Did The Solana (SOL) Price Jump Today?

Solana (SOL) is currently up by 4% after jumping from $142 to $148 in the past 24 hours. Interestingly, Solana has made a 23% gain from $119.56 since May 1 and could hold on to sustain this price increase steadily for the rest of the month. On-chain data has revealed behind the scenes that some whales are accumulating and transferring SOL tokens which reflects some intuition of bullishness surrounding the cryptocurrency. 

Particularly, on-chain data from whale transaction tracker Whale Alert has revealed the movement of 267,077 SOL worth $38.6 million from crypto exchange Binance into an unknown wallet in the past 24 hours. Another notable transfer was the movement of 11 million SOL worth $1.6 billion from a private wallet address to another private wallet address.

Solana Whale Movement

Whale transfers are very common in the crypto industry. They are of different types and they generally tend to shift the sentiment among crypto traders. Whale transfers from exchanges into private addresses could indicate whales are holding onto their assets in anticipation of a price surge.

On the other hand, transfers from private wallets into crypto exchanges most likely mean a selloff, which could increase selling pressure on these exchanges. A third type of whale transfer is between two private wallets, which could be for a various number of reasons.

The recent transfer of 11 million SOL falls into the third category of whale movement. A further look into on-chain transaction data shows that the transfer was made between two stake addresses.

Consequently, the tokens are locked up and inactive at the moment. As of now, their movement is likely going to have little to no effect on the price of Solana. 

Whale Accumulates Solana

On the other hand, private wallet “8NWAHM” has been accumulating SOL in the past 24 hours. While Whale Alert only noted an interesting transfer of 267,077 SOL worth $38.6 million into the address, a closer look into this wallet address shows this is the second major inflow into the address in the past 24 hours.

In an earlier transaction, 49,999 SOL worth $7.23 million made their way from crypto exchange Binance into the wallet address. 

This whale seems to be positioning itself for a price surge in the coming weeks, and the accumulation has, in turn, contributed to buying pressure for SOL. 

At the time of writing, Solana is trading at $145. Despite the 24-hour price gains, Solana is still experiencing a 20% correction in a 30-day timeframe. However, the cryptocurrency could continue this price uptick and eventually break above $200 again in May. 

Featured image from Pixabay, chart from TradingView

Cardano Comeback: Analyst Reveals Why It’s Time To Get Back Into ADA

Cardano (ADA) might be going through a lackluster price action at the moment, but analyst Ali Martinez believes the crypto might be gearing up for a parabolic run. While taking to social media platform X, Martinez talked about an intricate price analysis that ADA investors might find appealing.

Particularly, the analyst noted that the cryptocurrency’s current price formation is showing signs of a comeback, according to its price history.  

Cardano Price History Shows Signs Of Comeback

The price of Cardano has been on a correction path since the middle of March when it peaked at $0.79. Interestingly, current price levels means that the cryptocurrency has corrected over 40% from this peak.

This has led to concerns from some investors about the ADA’s price trajectory for the rest of the years, particularly considering different inactivity concerns and others surrounding the cryptocurrency. However, according to Martinez, this cycle is normal for the cryptocurrency.

The renowned analyst’s take on ADA is based on its historical trend. According to the 1M ADA/USD timeframe chart shared by Martinez, the 50% price drop ADA recorded in the past month could be a golden opportunity for crypto investors to position themselves for a price surge. 

Looking at ADA’s price history shows this may just be a temporary setback before the next rally. A similar price action played out between 2019 and 2020 before the surge to new all-time highs in 2021.

After breaking out of a consolidating channel in 2020, ADA went on a 75% surge and then corrected by 56% over three months. This correction was soon forgotten as ADA bounced up and went on an impressive 4,095% bull run to reach its current all-time high of $3.09.

As Martinez noted, a similar price action seems to be playing out. ADA recently broke out of a consolidating channel which played out for almost the entirety of 2023. This break above the channel saw ADA performing a 72% surge before its recent correction.

If history were to repeat itself, ADA might kickstart a parabolic run in May and push up to new highs in the coming months. Martinez predicted a 2,480% price surge to $9.98 within the next nine months. 

What To Expect In Cardano’s Next Bull Run

It is important to note that the crypto market has evolved significantly since 2021 and crypto assets have become less volatile, especially during uptrends. Many things have to be put in place in order for a $9 ADA price to become a reality.

For instance, there needs to be a wider inflow and mainstream adoption of cryptocurrencies. According to crypto prediction website Telegaon, Cardano could reach the $9 price level by the end of the decade. 

Martinez believes the recent price correction might actually be one of the last buy-the-dip opportunities for investors to get on ADA. At the time of writing, ADA is trading at $0.4638 and is down by 1% in the past 24 hours.

Featured image from Pexels, chart from TradingView

Bitcoin Relative Strength Jumps To 40%: 10x Research Reveals Next Steps From Here

Crypto research platform 10x Research recently noted that the Bitcoin Relative Strength has jumped to 40%. In line with this, they provided insights into what major moves the flagship crypto might make soon enough. 

What Next For Bitcoin?

In their newsletter titled “Fake Dip?” 10x Research drew the crypto community’s attention to the fact that Bitcoin has historically experienced potential rallies whenever its relative strength index (RSI) drops to 40%. As such, there is the possibility that BTC could again rally following its recent decline. 

The research platform warned that a “line in the sand” at the $62,000 mark could keep the flagship crypto from rallying. However, Bitcoin has already broken above that level, which could mean there is still a bullish sentiment around the crypto token. 

Meanwhile, the research hinted that BTC would need a catalyst to enjoy a sustained rally. They highlighted four bullish events that helped Bitcoin enjoy a parabolic run soon after breaking a vital support level. These events included Treasury Secretary Janet Yellen’s bid for uncapped deposit insurance, BlackRock’s application for a Spot Bitcoin ETF, Franklin Templeton also filing for a Spot Bitcoin ETF, and when US Core PCE dropped below 3.0%.

This echoes the sentiment of Andrey Stoychev, Head of Prime Brokerage at Nexo, who previously mentioned that Bitcoin would need a catalyst to make a significant move to the upside. He predicts that Bitcoin will only continue to trade around the $67,000 range without this catalyst. 

10x Research didn’t sound optimistic about BTC enjoying a sustained rally, as their trend model indicates that the flagship crypto is in a downtrend. Despite that, they are not ruling out the possibility of BTC experiencing a bullish reversal. The research firm also revealed that they would look to buy the dip if Bitcoin drops significantly or rallies from here. 

BTC Still Destined To Hit New Highs

Crypto analyst Mikybull Crypto recently suggested that Bitcoin will still hit new highs. He stated that Bitcoin’s current price action is meant to create “more fear across the market and then bottom for upward continuation.” Crypto analyst Ali Martinez also recently suggested that the bull run was far from over, bearing in mind that Bitcoin consolidated around this period in the last two bull runs. 

He claimed that BTC might be over 500 days away from hitting its market top for this cycle. As to how BTC could rise, Martinez mentioned that it could hit a new all-time high (ATH) of $92,190 if it breaches the resistance level of $69,150. It is also worth noting that crypto analyst PlanB stated that Bitcoin hitting $100,000 this year is “inevitable.”

At the time of writing, BTC is trading at around at around $63,500, up over 7% in the last 24 hours, according to data from CoinMarketCap.

Bitcoin price chart from Tradingview.com

Analyst Says Bitcoin Price Is Headed To $90,000, Here’s Why

Bitcoin is now at a critical junction, which many determine its price trajectory for the rest of the year. The crypto has managed to return into $60,000 territory after dropping down to $56,000 for the first time since April. Some analysts are of the notion that the Bitcoin bulls haven’t actually started on their momentum yet, with many expecting a surge above $74,000 in the coming weeks. 

According to a crypto analyst, impulse waves formed by Bitcoin over the past 1.5 years are indicating that the price of Bitcoin will soon jump to between $90,000 and $100,000. 

Bitcoin To $90,000

A crypto analyst known pseudonymously as TechDev recently shared a Bitcoin price outlook on social media platform X with over 448,000 followers. Interestingly, his analysis is based on Elliot impulse waves, a technical analysis tool that has become extremely popular among crypto analysts when forecasting Bitcoin’s price. 

According to the BTC/US Dollar 2D timeframe shared by the analyst, Bitcoin has been forming impulse waves on an uptrend since May 2023. The chart indicated that the recent correction since Bitcoin reached an all-time high of $73,780 is the fourth impulse wave formation, which is generally known to be a corrective wave. Interestingly, the asset is now at a critical junction after bouncing up at $56,800. 

As noted by the analyst, Bitcoin is set to form its fifth (bullish) impulse wave and go parabolic in the coming months. The first price target is around $90,000 to $100,000 in the short term. The second price target is around the projected peak of the fifth impulse wave, which sits just below $150,000.

TechDev’s analysis is based on a similar five-impulse wave formation in the 2020 to 2021 bull market cycle. A similar fourth impulse wave correction during this period saw Bitcoin falling from $41,000 to $29,000 in early 2021. However, a rebound led to the formation of a fifth (bullish) impulse wave, pushing the price of Bitcoin to its former all-time high. 

What’s Next For Bitcoin Price?

At the time of writing, Bitcoin is trading at $63,275 and up by 6% in the past 24 hours. Since the launch of Spot Bitcoin ETFs in the US, Grayscale’s GBTC recorded its first day of inflow, totaling $63 million on May 3. Investors are hopeful and speculating how this might kickstart a new bull run for the cryptocurrency.

According to an analyst, Bitcoin has successfully defended a correction below the 21-day exponential moving average (EMA). The next step is crossing above resistance around $63,488. 

Bitcoin price chart from Tradingview.com

Crypto Expert Arthur Hayes Says Bitcoin Has Found Its Local Bottom – But Can It Hold This Level?

Arthur Hayes, the co-founder and former CEO of BitMEX, recently shared his thoughts on the current Bitcoin price action. He stated that the flagship crypto has hit a local low and predicted what its future trajectory will look like. 

Hayes Says Bitcoin Has Bottomed 

In a recent blog post, Hayes mentioned that Bitcoin hit a local low when it dropped to around $58,600 earlier this week. As such, he doesn’t foresee the flagship crypto dropping below that price range again anytime soon.

Instead, he predicts that Bitcoin will rally above $60,000 (which it already did) and “then range-bound price action between $60,000 and $70,000 until August.”

Hayes also suggested that Bitcoin’s recent decline was due to several factors, including the Fed rate decision, the Bitcoin halving sell-the-news event, and the slowdown in the demand for US Spot Bitcoin ETFs.

He also used the opportunity to touch on the recent Fed and Treasury policy announcements, which he believes will significantly impact crypto.

Hayes claimed those announcements meant the government would likely resort to money printing soon enough. He believes the potential injection of liquidity into the US economy will “dampen negative price movement” in the crypto market. As such, he expects that prices will “bottom, chop, and begin a slow grind higher.”

Hayes’ projections are similar to crypto expert Michaël van de Poppe, who recently predicted that Bitcoin will likely consolidate for a few months. Interestingly, Van de Poppe also alluded to the Fed’s recent policies, noting that a Quantitative Easing is close, which would be bullish for Bitcoin. 

However, Hayes sounded apprehensive of the long-term effects of the recent monetary announcements, noting that they had an inflationary nature.

Therefore, although more money is expected to flow into the crypto market with the Fed’s decision, it could cause inflation to skyrocket. This would eventually lead to higher interest rates, negatively affecting risk assets like Bitcoin. 

Arthur Hayes’ Trading Strategy Going Forward

The MEXC co-founder said he would buy Solana and “doggie coins for momentum trading positions.” For long-term “shitcoin positions,” he mentioned that he would increase his allocations in Pendle while identifying other tokens that he considers undervalued. Basically, he plans to use this month to increase his exposure. 

Once he had done that, he remarked that he would wait for the market to “appreciate the inflationary nature of the recent US monetary policy announcements.”

Meanwhile, as to what doggie coins Hayes might be accumulating, Dogwifhat (WIF) is likely one of them, considering he once mentioned that he would load up on WIF as Bitcoin bottoms out. 

Featured image from Pexels, chart from TradingView

Fantom Revival: Crypto Analyst Predicts A Jump To $1.2 For FTM Price

Fantom (FTM) had initially reclaimed the $1 level back in March and expectations were that the coin would rise to $2. But that was before the market crash sent prices spiraling, and Fantom lost almost 50% of its value during this time. However, all hope is not lost of for the coin, as one crypto analyst expects a return of the bullish momentum as long as certain conditions are met.

Fantom Searching For Support

Crypto analyst MyCryptoParadise took to TradingView to share their analysis on the Fantom price and how it could see a recovery. After the price fell to $0.56, the altcoin began to look for support, which would serve as a bounce-off point, and the analyst revealed that the altcoin is actually getting closer to this support.

For now, the support lies at $0.5679, which is the point that bulls need to hold to confirm a bullish breakout. Following a rejection at the $0.79 resistance, this point has become even more important to hold, as the FTM price searches for “renewed momentum.”

“Should FTM successfully find support and bounce from this level, it could potentially form a double bottom pattern, with the neckline acting as resistance around the 0.798 mark,” the crypto analyst said, highlighting the importance of finding support.

In the event of a breakout, the analyst expects at least a 100% move from here. The first major level to break it the $1 level, and then after that, the crypto analyst sees the price going as high as $1.2 as long as the trend is confirmed.

FTM price chart from Tradingview.com (Fantom)

FTM Could Break Down Further

On the flip side of this, the crypto analyst also identifies a scenario where the Fantom price could continue to break down. In the event that the altcoin is unable to find support above $0.56 and breaks through it instead, the bloodbath could continue.

The bearish continuation which the analyst sees in a situation like this will send the price below $0.5 eventually. The support for the FTM price then lies at the next Bullish OB area, which the crypto analyst identifies to be around $0.449.

💎 Reclaiming the support at 0.568 would be crucial for FTM to maintain its bullish momentum,” the analyst said. “Should FTM fail to bounce even after reaching the Bullish OB area, it would signal a bullish invalidation, indicating a continuation of the bearish trend.”

Presently, the Fantom price is trending above support at $0.6641. However, it is down 3% in the last day with 10% losses in the last week.

Fantom price chart from Tradingview.com

Crypto Expert Turns Bullish On Bitcoin, Predicts Quantitative Easing Will Begin Soon

Crypto expert Michaël van de Poppe has made a bullish case for Bitcoin as he alluded to macroeconomic factors that could soon play out in the flagship crypto’s favor. In line with this, he urged Bitcoin investors to take action with a parabolic surge on the horizon. 

An Imminent Quantitative Easing Would Be Good For Bitcoin

Van de Poppe suggested in an X (formerly Twitter) post that Bitcoin will rise on the back of a Quantitative Easing (QE), which he anticipates is “close.” He noted that the Fed has already started to “unwind Treasury buybacks and is reducing QT [Quantitative Tightening].” He claims this is happening because the economic data has worsened, which puts the US at risk of a recession. 

Therefore, the Fed seeks to avoid this recession by buying back long-term government bonds and injecting liquidity into the financial system. As the crypto expert predicts, this could be good since it will force the Fed to take a more dovish stance and possibly lower interest rates, boosting investors’ confidence to go all in on risk assets like Bitcoin. 

Van de Popper further predicts that this Quantitative Easing will become evident in the data released in the coming months. In line with this, he advised investors to long Bitcoin. It is worth noting that Bitcoin dropped to as low as $57,000 ahead of the latest FOMC meeting, with many investors seeming to have anticipated a hawkish stance from the Fed. 

However, as the crypto expert noted, the rates remain unchanged, and Fed Chair Jerome Powell raised the possibility of a rate cut as early as June. Given Bitcoin’s price recovery since then, this development looks to have already revived a bullish sentiment among investors. 

What To Expect Going Forward

In another X post, Van de Popper revealed his expectations for the crypto market going forward. He stated that Bitcoin will consolidate and go sideways (possibly ahead of the QE which will boost its price in the coming months. Meanwhile, he also expects Altcoins to “heavily outperform and rotation kicks in.”

The crypto expert had previously echoed a similar sentiment when he stated that he expects altcoins to bounce in their Bitcoin pairs while Bitcoin faces a period of consolidation that he doesn’t expect to change in the “coming months.” 

Back then, he also mentioned that there would be a narrative shift to Ethereum, and he reaffirmed this belief in a more recent X post, stating that he expects a lot from the second-largest crypto token by market cap.  

At the time of writing, Bitcoin is trading at around $59,100, up over 2% in the last 24 hours, according to data from CoinMarketCap. 

Bitcoin price chart from Tradingview.com

Crypto Pundit Lists 4 Altcoins To Buy Once The Bitcoin Price Bottoms

Crypto analyst DonAlt has listed four altcoins he will buy once he believes that Bitcoin’s price has bottomed. The analyst further provided insights into why he is particularly bullish on these altcoins. 

Ethereum Is Number One On The Altcoins List

DonAlt mentioned in an X (formerly Twitter) post that he will buy “ETH, DOGE, LTC, and maybe PEPE” whenever he believes BTC has bottomed. In a video posted on his YouTube channel, he gave insights into why he was bullish on these crypto tokens, especially Ethereum.

The crypto analyst mentioned that Ethereum is now low enough for him to be comfortable with buying. He also suggested that the crypto token was likely a good buy at this price level, stating that it is currently having a good price action (especially on the weekly chart) with Bitcoin struggling. 

DonAlt added that Ethereum will likely experience a good breakout as Bitcoin struggles and that its underperformance could be over soon. However, DonAlt hasn’t bought Ethereum yet. He revealed that he will bet on Ethereum if Bitcoin reclaims $62,000

The analyst further suggested that Bitcoin reclaiming this level would determine whether or not the bottom was in. To support his stance, he noted that many altcoins are struggling to hold their support levels due to Bitcoin’s breakdown. However, if Bitcoin were to reclaim $62,000, the rest of the market would likely pick up, too. 

Meanwhile, DonAlt remarked that Ethereum could move to $4,000 if it manages to close above $3,000 on its weekly chart. He further stated that this is the most bullish he has been on the second-largest crypto token in years. 

Why Dogecoin (DOGE) And Pepe (PEPE)

DonAlt didn’t give an exact reason why he was looking to buy Litecoin other than the fact that it is an old coin. However, he gave insights into why he was bullish on the other two altcoins, Dogecoin and Pepe

According to him, the foremost meme coin is still likely to reach $1 if Bitcoin hasn’t topped out, which presents an opportunity to make a lot of money. Interestingly, he had previously claimed that Dogecoin was a better investment than Bitcoin. He also revealed that he is waiting for Dogecoin to drop to around $0.11 before buying, although he is still comfortable with buying around $0.15 if it doesn’t. 

Meanwhile, as to why he is bullish on Pepe, he suggested that the meme coin was a good buy because of its recent performance. He went as far as comparing it to Dogwifhat (WIF) and claimed that he would pick Pepe over it because Pepe is on a “non-joke-like chain” (Ethereum), unlike WIF, which is a “meme on a meme chain” (Solana).

Ethereum price chart from Tradingview.com (Altcoins)