Analyst Who Predicted Solana’s 1,100% Move Reveals Where The Altcoin Is Headed Next

Crypto analyst Javon Marks has provided insights into the future trajectory of Solana (SOL) after it hit a 1,100% return. The analyst is known to have called the crypto token’s previous high correctly, which is one reason his latest prediction is worth keeping an eye on.  

Solana Could Rise To As High As $453

Marks mentioned in an X (formerly Twitter) post that despite its recent pullback, Solana’s price may be getting ready for another price rally. He noted that a move of over 54% may already be in the pipeline and that such a price move could open up room for another run of over 93%, which would send Solana to $453. 

Related Reading: Cardano Ready For 15x Move, Crypto Analyst Reveals The Major Drivers

Solana

Marks predicted last year that Solana would climb above $200, which it eventually did this year, peaking at a year-to-date (YTD) high of $202. Although the crypto token has dropped significantly from that price level, Marks’ recent prediction confirms that Solana’s run isn’t done yet and will still surpass its current all-time high (ATH) of $260.

Solana rising to $453 looks more feasible considering that crypto analysts like Altcoin Sherpa have predicted that the crypto token could rise above $500 by year-end. Crypto analyst Hansolar also predicted that Solana could climb to $600 in this market cycle. Meanwhile, Crypto YouTuber Jake Gagain predicted that Solana will rise to $750, although he mentioned that it will likely happen in 2025. 

SOL Could Become The Third-Largest Crypto Token

Solana’s rise to as high as $500 could lead to the crypto token becoming the third largest crypto asset by market cap, only behind Bitcoin and Ethereum. This is possible, as a rise to $500 is almost double Solana’s current ATH. Crypto analyst Chris O also previously predicted that this would likely happen as he predicted Solana and ADA would battle for the position. 

Meanwhile, asset manager Franklin Templeton also sounded confident in Solana’s potential to become the third-largest cryptocurrency. In a recent analysis, the asset manager highlighted the factors that could lead to this development. One is Solana’s technology, which they think will be perfect for the sectors that will drive the next wave of crypto adoption. 

Franklin Templeton also alluded to the upcoming airdrops on the Solana network, which could bring more liquidity into the ecosystem and possibly cause a surge in Solana’s price, just like when the Jito and Pyth airdrops occurred. The asset manager also noted that meme coin activity on the network isn’t slowing, which could contribute to Solana’s rise to becoming the third-largest cryptocurrency. 

Solana has become the foremost network for trading meme coins, which has led to an influx of new investors into the ecosystem. Therefore, a sustained network expansion will likely reflect positively on Solana’s price sooner or later. 

At the time of writing, Solana is trading at around $144, up in the last 24 hours, according to data from CoinMarketCap. 

Solana price chart from Tradingview.com

Theta Network Breakout Imminent: Why A 100% Rise Is Possible From Here

While the focus has mainly been on Bitcoin and Ethereum through the downtrend, other smaller altcoins such as Theta Network with much more potential have been flying under the radar. However, crypto investors are no longer ignoring these altcoins and have begun to call out the opportunities in these cryptocurrencies.

Theta Network Is Looking At A Breakout

Crypto analyst CobraVanguard has called out an interesting formation in the THETA chart that suggests that a massive breakout might be on the horizon. In the analysis which was posted on the TradingView website, the analyst points out that a bull flag is currently being formed.

This bull flag pattern started with the most recent decline below the $2 price level after a period of brief dips and recoveries. Interestingly, since this bull flag pattern is still only forming, it does not mean that the breakout will happen immediately.

CobraVanguard’s chart shows that there will be more uncertain movements in the THETA price, coupled with the possibility of the price actually falling below $1.9. At the same time, the crypto analyst points out that the price is currently bouncing from the middle line around $1.99.

Theta Network price chart from Tradingview.com

However, once the formation is complete, then the breakout can happen. The upper end of the target presented by CobraVanguard shows that the THETA price can rise as high as $3.7. This would mean an almost 100% increase in price from its current level.

Holding Up Well Amid Uncertainty

2024 has been a rather eventful year for Theta Network. The network’s native token, THETA, had begun the year trending below $1. However, within the month of March alone, it saw an over 250% increase, going from $1.1 to over $3.7 before correcting back downward.

Since then, the THETA price has lost around 40% of its value. But this is only due to the negative headwinds that can be attributed to the decline in the Bitcoin price. The altcoin has moved upward in the market since then, rising over a $2 billion market cap to become the 51st-largest cryptocurrency in the space.

Amid the broader market downturn, THETA is still seeing positive metrics, especially when it comes to its volume. According to data from CoinMarketCap, the daily trading volume of the altcoin has jumped 13% in the last day alone, suggesting that interest is returning to the cryptocurrency.

At the time of writing, the THETA price is seeing small daily gains of 1.47% to trade at $2.02. However, on the weekly and monthly timeframes, the altcoin has performed poorly, dropping 13.73% and 12.97%, respectively.

Theta Network price chart from Tradingview.com

Analyst Points Out Level To Beat If Bitcoin Is To Reach $76,000

Crypto analyst Ali Martinez has highlighted what needs to happen for Bitcoin to climb to $76,000. If that doesn’t happen, he noted that the flagship crypto risks dropping significantly to levels not seen since the start of the year. 

How Bitcoin Could Rise To $76,000

Martinez mentioned in an X (formerly Twitter) post that Bitcoin will likely rise to $76,610 if it can reclaim $64,290 as support. However, if it fails to climb above $64,290, the crypto analyst added that Bitcoin might retest support at $51,970. Martinez drew this conclusion based on MVRV (Market Value To Realized Value) extreme deviation pricing bands, which showed $51,970 as the all-time mean. 

Bitcoin has recently maintained a tepid price movement and isn’t showing any sign that it can reclaim $64,290 as support for now. Instead, the flagship crypto looks likelier to retest the $51,970 price level, seeing as it is looking to break down below $60,000. However, despite Bitcoin looking to have a bearish outlook, crypto analyst Mikybull Crypto maintains that Bitcoin’s price action is bearish. 

In an X (formerly Twitter) post, he mentioned that BTC is having a “simple retest to weary the impatient trader.” “Nothing bearish as bears seem to amplify it,” he added. The analyst had previously predicted that Bitcoin could climb to $73,000 once it clears the $67,000 price level. 

BTC May Soon Resume Its Upward Trajectory

Meanwhile, crypto analyst Rekt Capital suggested that Bitcoin may soon be out of the clear, revealing that the Post-halving “Danger Zone” officially ends on May 13. The analyst had previously explained that this Danger Zone is the downside wick that Bitcoin experienced approximately 21 days after the Halving in 2016. 

In another X post, the analyst revealed that Bitcoin had repeated the “2016 history perfectly, offering a downside wick below the bottom of its current Re-Accumulation range within a three-week window after the halving.” Therefore, with this retracement out of the way, the flagship crypto looks primed for an upward trend. 

However, this move might not happen so soon since Rekt Capital mentioned the Reaccumulation period, which usually occurs after the Bitcoin halving. The crypto analyst noted that this period usually lasts up to five months. He added that this time could be different since this re-accumulation would develop around a new all-time high (ATH) area. 

While it is uncertain when this price rally might come, Rekt Capital suggested that Bitcoin might not drop below the $60,000 price level again. He claimed that a weekly close above $60,600 for Bitcoin “would continue to solidify this price level as a base of the Re-Accumulation Range. 

At the time of writing, BTC is trading at around $61,100, up in the last 24 hours, according to data from CoinMarketCap. 

Bitcoin price chart from Tradingview.com

Is The Bitcoin Bottom In? Buy The Dip Sentiment Erodes Amid Drop Toward $60,000

Bitcoin has been sliding down since it reached its all-time high in March. This has largely led to a buy-the-dip sentiment among crypto traders, with many believing the correction would end as soon as it ended and Bitcoin would surge again to new all-time highs. 

According to crypto analytics platform Santiment, the thrill of scooping up ‘cheap’ Bitcoin appears to be fading as the consolidation drags on around the $60,000 price mark. As Santiment noted, this fading buy-the-dip mentality could actually be a signal that Bitcoin is nearing a bottom, according to price history. 

Is The Bitcoin Bottom In?

Bitcoin tumbled from $63,000 to $60,000 on Friday, extending its run of range trading in the past few weeks. As noted by Santiment, traders are becoming less enthusiastic about buying the dip according to social media interactions.

While this might be worrying for some investors, Bitcoin’s unique price movement over the years has prompted Santiment to note this is generally a good sign that the bottom is nearing.

To explain this further, the sentiment usually turns quite negative when Bitcoin crashes from all-time highs. But historically, the point at which “buy the dip” talk on social media starts to fade is often a sign the bottom is near than most people will think.

The fading “buy the dip” talk suggests the weak and scared bears have sold and the bulls are starting to position themselves. 

Unfortunately, there’s no way to know for sure if prices have bottomed out until after the fact. However, key support levels on the Bitcoin chart haven’t broken down and fundamentals haven’t changed. If Bitcoin continues to hold above $60,000, this could signal the bottom is in.

BTC Risk Signal Hits Lower High – Woo

At the same time, the bullish Spot Bitcoin ETF narrative driving increasing mainstream adoption is still in place, meaning the crypto could reverse into a full bullish action very soon.

Other key factors also point to Bitcoin nearing its bottom. As noted by crypto analyst Willy Woo, Bitcoin’s risk signal recently printed a lower high, which is a formation that frequently paves the way for a bullish trend.

At the time of writing, Bitcoin is trading at $61,000 and is down by 4.2% in the past seven days. Although Bitcoin might have formed its bottom, this lull action could continue into the next few months until the crunching supply of the halving gets factored into its price. 

Remarkably, some new whale addresses are silently accumulating Bitcoins. On-chain data from Whale Alerts shows the recent movement of 1,999 BTC into new private addresses.

Featured image from Pexels, chart from TradingView

US Mega Banks JP Morgan And Wells Fargo Unveil Bitcoin Exposure As BTC Drops To $60,000

JP Morgan and Wells Fargo, two of the largest banks in the United States, have announced their investments into Spot Bitcoin ETFs, unveiling their exposure to BTC, the world’s largest cryptocurrency. This significant development comes amidst the persistent downturn in the crypto market, resulting in BTC’s price dipping slightly above $60,000. 

US Financial Banks Expose Spot Bitcoin ETF Holdings

American financial services companies, Wells Fargo and JP Morgan, have revealed their exposure to BTC by disclosing their adoption of Spot Bitcoin ETFs in a recent filing. This decision to invest in BTC ETFs marks a notable change from the banks’ previous cautious approach to cryptocurrencies. 

Wells Fargo revealed in its new filing to the United States Securities and Exchange Commission (SEC) that it currently holds 2,245 shares of Grayscale Bitcoin Trust (GBTC), valued at $121,207, which it has since converted into an ETF. Additionally, the American bank holds 37 shares of the ProShares Bitcoin Strategy ETF (BITO), valued at $1,195. 

On the other hand, JP Morgan, which holds about $2.9 trillion in Assets Under Management (AUM), has revealed its total Spot BTC ETF holdings in an SEC filing. The bank reported that it had purchased about $760,000 worth of shares of BlackRock’s iShares Bitcoin Trust (IBIT), Fidelity’s Wise Origin Bitcoin Fund (FBTC), Grayscale Bitcoin Trust (GBTC), Bitwise Bitcoin ETF, and ProShares Bitcoin Strategy ETF (BITO). 

Moreover, JP Morgan also owns about 25,021 shares valued at $47,000 in cryptocurrency ATM provider, Bitcoin Depot. The investment company also unveiled its exposure to Spot BTC ETFs just hours after Wells Fargo’s announcement.

Despite the regulatory uncertainty and the market’s continuous volatility, institutional interest in cryptocurrencies, particularly BTC, has been growing rapidly. Bloomberg senior analyst, Eric Balchunas also forecasted that more financial services companies would likely follow JP Morgan and Wells Fargo’s footsteps to unveil holdings in Spot Bitcoin ETFs as market makers or Authorized Participants (APs). 

BTC Price sUFFERS More Declines

Despite the increasing interest from traditional financial institutions seeking exposure to BTC, the price of the cryptocurrency has shown a surprising lack of bullish momentum. Since its halving event on April 20, BTC has been trading sideways, witnessing continuous declines that have pushed its price down to around $57,000 previously. 

The cryptocurrency, which recorded an all-time high above $73,000 in March, has seen a 14.20% drop over the past month. Additionally, Bitcoin gave up a large portion of its gains before the halving and is currently trading at $60,494, according to CoinMarketCap. 

Blockchain analytics platform, Santiment, revealed that the ongoing lack of interest in BTC and the broader market sentiments could be a strong sign that the cryptocurrency is getting close to its bottom

Bitcoin price chart from Tradingview.com

Cardano Ready For 15x Move, Crypto Analyst Reveals The Major Drivers

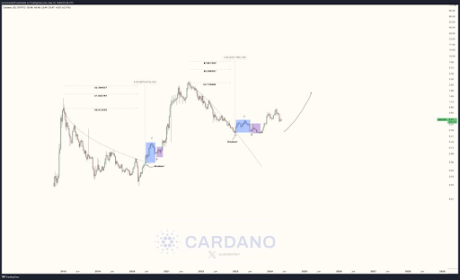
Cardano (ADA) looks primed to make that move to the upside, with crypto analyst Javon Marks revealing what could make the crypto token see a 15x increase in its price. Marks’ analysis comes amidst recent price predictions, which paint a bullish outlook for Cardano. 

How Cardano Could See A 15x Increase In Its Price

Marks mentioned in an X (formerly Twitter) post that ADA has shown “major progress since breaking the resisting trend.” The crypto analyst also noted that the crypto token attempted to move over 200% toward the first target at $2.77709 and claimed that the recent pullback Cardano faced could strengthen it to achieve an even more parabolic rise.  

Cardano

This development is why Marks believes Cardano could rise to as high as $7.80 from its current price, representing a 1,500% increase for the crypto token. A rise to that level looks more feasible, considering that crypto analyst Altcoin Daily also recently predicted that Cardano will rise to $9 in this bull run.

Meanwhile, crypto analyst Ali Martinez made an ultra-bullish case for Cardano, noting that the crypto token was currently mirroring its price action from 2019, when it made a price gain of over 4,000%. While Martinez acknowledged that history might not repeat itself, he suggested that Cardano could still make an impressive move similar to 2019. 

For Cardano to experience such parabolic moves, the crypto token needs to see a reversal in its current downtrend. Crypto analyst Trend Rider hinted that could happen soon, noting that ADA was still holding its support level. According to him, if Cardano can hold on to this support for 1 to 2 weeks, the bears will tire, and the crypto token will bounce from its current price level. 

Analyzing Cardano’s Bull Run

Dan Gambardello, the founder of Crypto Capital Venture, again suggested that Cardano’s price action in this bull run will likely mirror Ethereum’s in the last bull run. He noted that the former is currently around the level that Ethereum was at around the 2020 Bitcoin halving. As such, he expects Cardano to enjoy a similar success to the one Ethereum enjoyed in the last bull run. 

The crypto analyst also assured that Cardano was still on track for its bull run, stating that it was also down over 90% from its all-time high (ATH) months after Bitcoin halved in the last bull run. As such, he still expects Cardano to make a run soon enough, just like it did in 2021. 

The crypto analyst hinted that Cardano’s bull run would likely begin during the Altcoin Season. However, he wasn’t sure when this Altcoin season would likely start since Bitcoin hit a new ATH before the halving (which has never happened before). He added that this Altcoin season might not come until December. For now, the analyst noted that patience is the name of the game. 

Cardano price chart from Tradingview.com (Crypto analyst)

Ex-Twitter CEO Jack Dorsey Says Bitcoin Will Reach $1 Million, Here’s When

Jack Dorsey, the former CEO of X (formerly Twitter) has predicted when Bitcoin will reach $1 million. The tech entrepreneur is a familiar figure in the crypto space and is known to be heavily invested in the flagship crypto. 

When Bitcoin Will Hit $1 Million

In an interview with Pirate Wires, Dorsey mentioned that BTC could hit $1 million in 2030 and beyond. In addition to predicting Bitcoin’s future trajectory, Dorsey took time to appreciate the Bitcoin ecosystem. He remarked that besides its history, “the most amazing thing about Bitcoin” is how those who work on it, earn from it or invest in it all contribute to making the ecosystem, which in turn causes Bitcoin’s price to go up. 

Dorsey further claimed that Bitcoin is a “fascinating ecosystem and movement” and that he has learned a lot from it. Based on his assertion, the tech entrepreneur is undoubtedly one of those contributing to the growth of the Bitcoin ecosystem. Dorsey and his digital payments company, Block, already hold over 8,000 BTC. 

His company also recently announced plans to begin investing 10% of its monthly Bitcoin-related gross profits in buying more BTC. This investment plan could lead to the company investing as much as $24 million in BTC one year from now. It is also worth mentioning that Dorsey has been actively looking to build in the Bitcoin ecosystem. 

It was previously reported that the former Twitter CEO was planning on building a decentralized exchange (DEX) for Bitcoin. More recently, Dorsey’s Block announced that they had completed a BTC mining system they had been working on since April 2023. 

BTC Hitting $1 Million Could Be This Year 

The CEO of Jan3 and Bitcoiner Samson Mow shares a contrary opinion with Dorsey. He predicted before now that Bitcoin could reach $1 million before the end of this year. Mow alluded to the increasing demand for Bitcoin as why he holds such a belief. The crypto founder suggested that this prediction would likely be attained next year if it didn’t happen this year.

Crypto analyst PlanB also believes that next year is a more feasible timeline for BTC to reach this price level. He stated that $1 million could be the market top for BTC in this bull run based on the Bitcoin stock-to-flow (STF) indicator, which hinted at $500,000 being the average price for BTC in this market cycle. 

Other crypto analysts have given more conservative price predictions for this bull run. CryptoQuant’s CEO Ki Young Ju recently predicted that BTC could hit $265,000. Meanwhile, Anthony Scaramucci, the founder of SkyBridge Capital, predicted that BTC could peak at $170,000 in this market cycle. 

At the time of writing, Bitcoin is trading at around $60,800, down over 3% in the last 24 hours, according to data from CoinMarketCap.

Bitcoin price chart from Tradingview.com (Jack Dorsey)

Crypto Analyst Says XRP Price Can Break Out From Falling Pennant, But Can It Reach $1?

The XRP price, like the rest of the crypto industry, continues to struggle against the bearish winds that have taken over. This has seen its price consistently decline in spite of bulls’ best efforts to prop it up. However, it seems all hope is not lost for the altcoin as expectations are that it will recover soon enough. More specifically, crypto analyst WalterMoon is particularly bullish on the XRP price, noting that it is possible that it will break out of its current pennant.

Analyzing The XRP Price Movement

To try and pinpoint where the XRP price is headed, the crypto analyst first analyzed the movement of the altcoin over the last few weeks. This analysis showed a consistent breakout trend, albeit short-lived, that suggests that the altcoin could be getting ready to mount another one soon.

One of these breakout trends took place last month in May when the price had entered a failing channel. Eventually, the XRP price was able to muster enough momentum, even after breaking below its support line below $0.5 and then made a run for $0.52.

Again, this is seen later in the month when the price once again fell into a falling channel. This decline saw it fall below support. But like the previous time, it was able to move upward inside this falling channel and eventually broke out of the channel.

XRP price chart from Tradingview.com

This trend was recorded a number of times in the month of May, showing XRP’s strength in the market right now. However, the altcoin has fallen inside another falling channel once again, but can it maintain its breakout trend from last month?

Gathering Support Inside A Pennant

Crypto analyst WalterMoon has identified the XRP price inside a falling channel and as it continues to decline inside this pennant, the price has taken hit after hit. But given the performance from the last month, Moon believes there is still upside to come for XRP.

According to the analyst, there is a possibility that the altcoin can exit its current pennant by bouncing off the support at $0.533. In this case, it could send the price as high as $0.54, like it did the previous times. “Now, I think that Ripple can bounce up from support line to $0.5330, thereby exiting from pennant,” the analyst said.

Despite the bullish outlook, WalterMoon’s target is still conservative for all intents and purposes. The target still remains above the $0.54 level, which, unfortunately, doesn’t show much expectation for the XRP price to cross $1.

XRP price chart from Tradingview.com

Crypto Analyst Sets $10 Price Target For Cardano As Volume Jumps 90%

The stars may be finally aligning for Cardano (ADA) and its holders, as the crypto token recently experienced a significant reversal and a jump in its trading volume. Interestingly, this development coincides with an ultra-bullish prediction that a crypto analyst made for the crypto token. 

Crypto Analyst Predicts Cardano To Rise To $9

Crypto analyst Altcoin Daily revealed in an X (formerly Twitter) post that $9 is their peak price target for Cardano in this bull run. The analyst joins other crypto analysts who have made ultra-bullish predictions for Cardano despite how low the crypto token is currently trading. Before now, Dan Gambardello, the founder of Crypto Capital Venture, had predicted that Cardano could rise to as high as $11 in this bull run.

Related Reading: CryptoQuant CEO Predicts Where Bitcoin Price Is Headed, Is $265,000 Too Ambitious?

Meanwhile, crypto expert Jason Appleton predicted that Cardano will rise to as high as $32 in this bull run. Specifically, he mentioned that this will happen at the peak of this market cycle. Altcoin Daily’s prediction comes amidst Cardano’s 90% jump in trading volume. This suggests that more investors are accumulating the crypto token ahead of this parabolic rise. 

Cardano’s price already reacted positively to this development, with the crypto token seeing a reversal from its downtrend. Crypto analyst Trend Rider suggested that this reversal might begin an upward trend for Cardano as he noted that the crypto token was currently holding its support level very well. 

The analyst also revealed that the bears were currently trying to push the crypto token further down, but he claimed that they would get tired once Cardano could hold this support for 1 to 2 more weeks. Once that happens, Carano will bounce from its current price level, Trend Rider remarked. 

Making A Bull Case For ADA

Crypto analyst Ali Martinez recently made a bullish case for Cardano. He mentioned in an X post that the crypto token seems ready for a parabolic bull run. Martinez alluded to Cardano’s historical trend and explained why the 50% price drop the crypto token experienced this past month might be a good buying opportunity. 

Martinez claimed that Cardano consolidated within a parallel channel in 2019, signaling an end to the bear market. Following that “stagnant phase,” ADA is said to have broken out of the channel with a 75% surge and then experienced a 56% correction, setting the stage for its 4,095% price gain in that bull run. 

Related Reading: Bitcoin Whales Lose Interest, Is This A Precursor For A Crash To $50,000?

Martinez further noted that a similar situation looks to be playing out again as Cardano has consolidated within a parallel channel, marking an end to the bear market. ADA then broke out of this channel with a 72% price surge following this period of stagnation. Now, Cardano has experienced a 50% price correction, just like in 2019, which Martinez remarked could be setting the stage for “an impressive bull run ahead.”

Cardano price chart from Tradingview.com

Bitcoin Short Term NUPL Value Turns Negative, What This Means For Price

Crypto analyst Onchained recently provided valuable insights into an important metric that can be used to gauge the future trajectory of Bitcoin. The analyst suggested there was no cause to worry at the moment but highlighted what to watch out for to know the right time to exit the market. 

Bitcoin Short-Term Holders NUPL Turns Negative

In a blog post, the analyst noted that the NUPL (Net Unrealized Profit/Loss) for Bitcoin’s short-term holders recently turned negative. The analyst added that this signals fear among this category of investors, which is very much likely given Bitcoin’s current price action. The last time this trend occurred was shortly after the Spot Bitcoin ETFs were approved, with Bitcoin dropping from $49,000 to $38,000 following that occurrence. 

Related Reading: What Triggered The 6,350% Spike In XRP Long Liquidations Compared To Shorts?

Bitcoin

While the short-term holders’ NUPL turning red again suggests that a significant price decline may be on the horizon, the analyst remarked that this price level may simply represent a significant support line. The real cause for concern might be when the NUPL for mid-term holders also turns negative. “It could indicate widespread market fear and serve as a crucial risk management indicator for exiting the market,” the analyst claimed. 

It is worth noting that the short-term holder’s NUPL being negative means they are currently seeing an unrealized loss in their investments. This could trigger a wave of sell-offs among these investors, mainly because of fear that Bitcoin’s price could further dip. However, based on the analyst’s analysis, this might not significantly lower Bitcoin’s price. 

Instead, market speculators should be more worried about the PUNL of mid-term holders (those who have been holding Bitcoin for 3 to 6 months). The PUNL also turning negative will “suggest widespread pessimism or negative sentiment.” This could lead to massive selling pressure on Bitcoin’s price as this category of investors might also offload their holdings out of fear.  

The Worst May Already Be Over

Crypto analyst Ali Martinez had previously shared a similar analysis to Onchained’s, noting that Bitcoin short-term holder’s (STH) realized price was at $59,800. The analyst warned back then that Bitcoin dropping below this level could trigger “notable Bitcoin price corrections.” Following his prediction, Bitcoin fell below $59,800, dropping to as low as $57,000. 

Related Reading: Crypto Analyst Says Ethereum Price Will Drop To $2,500, Here’s Why

However, the flagship crypto has since then recovered nicely above $60,000. Although Bitcoin is still showing signs of a bearish outlook, its quick recovery above $60,000 suggests that the worst might be over, and all the crypto token needs right now is a catalyst to spark a continuation of its bull run. 

Arthur Hayes, BitMEX’s co-founder and former CEO, also confirmed this belief, noting that Bitcoin has already found its local bottom. However, he predicted that Bitcoin will likely have a “range-bound price action between $60,000 and $70,000 until August.”

Bitcoin price chart from Tradingview.com

Ethereum Foundation Moves 1,000 ETH – Is The Top In?

The Ethereum Foundation, a non-profit organization that supports the Ethereum ecosystem, recently transferred a significant amount of ETH. Given what this transaction could imply, it has drawn the crypto community’s attention, which is already speculating about whether the market top might be in. 

Ethereum Foundation Moves 1,000 ETH

On-chain analytics platform SpotOnChain revealed in an X (formerly Twitter) post that the Ethereum Foundation transferred 1,000 ETH ($3 million) to a middle multi-signature wallet (0xbc9) on May 8. This development is more concerning as SpotOnChain revealed that the Foundation has made other transactions since the start of 2024.

According to the platform, the Ethereum Foundation has sold 1,766 ETH for 4.81 million DAI at an average price of $2,725 for each ETH. These transactions are said to have occurred in “several small batches via the same multi-signature wallet. Interestingly, SpotOnChain noted that these transactions often occur ahead of a price drop.  

It is worth mentioning that the Ethereum Foundation already has a reputation for selling at the top, suggesting that their selling ahead of a drop might not be a coincidence. In 2022, NewsBTC reported that Ethereum dropped by 40% after the Foundation sold off 20,000 ETH. Meanwhile, in 2021, ETH experienced a downtrend for months after the organization sold off 35,000 ETH. 

Ethereum

Journalist Colin Wu also revealed back then that Ethereum’s founder, Vitalik Buterin, had persuaded the foundation to “sell 70,000 ETH at the top of 2018 to support the work of developers.” Wu further claimed that the Foundation’s sell-off is a “normal operation, but it also means that the Foundation thought that bear market was coming.”

Therefore, from Wu’s revelation, one can deduce that the Ethereum Foundation could have an idea of when the market top is, which prompts them to always make these sales before ETH makes a significant decline

An ETH Decline May Already Be On The Horizon

A crypto analyst known as Shin Forex recently predicted that Ethereum could soon drop to as low as $2,500. The analyst explained that there has been a slowdown in liquidity flowing into the Ethereum ecosystem. This could affect ETH’s price since it suggests a lack of interest in the token among investors. 

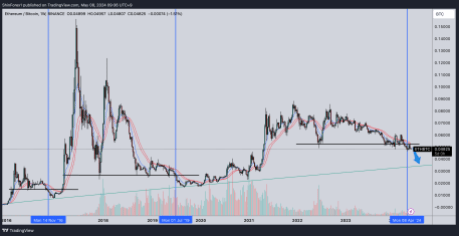
From a technical analysis perspective, Shin Forex also revealed that the ETH/BTC pair has now broken below its support of 0.05. Ethereum is said to have experienced a significant crash when this happened in the market cycles in 2016 and 2019. As such, the analyst does not doubt that ETH will likely spiral down again, with the crypto token dropping to as low as $2,500. 

At the time of writing, Ethereum is trading at around $3,000, according to data from CoinMarketCap. 

Ethereum price chart from Tradingview.com (Crypto analyst)

Crypto Analyst Says Ethereum Price Will Drop To $2,500, Here’s Why

The Ethereum price has been closing mirroring the performance of Bitcoin recently and since the Bitcoin price has been on a downtrend, the ETH price has followed. However, Ethereum on its own seems to possess more bearish fundamentals compared to Bitcoin, leading crypto analysts to believe that the second-largest cryptocurrency by market cap will fall further from here.

Ethereum Poised To Crash Further

A crypto analyst known as Shin Forex took to the TradingView website to share an interesting analysis of the Ethereum price. The analysis, which focused on the ETH/BTC chart, unveiled some concerning developments in the ETH price.

The analyst explained that during this time, the liquidity in Ethereum has been dwindling. Instead of flowing toward altcoins like ETH, it is instead flowing toward Bitcoin. This suggests growing disinterest in Ethereum from investors and as liquidity flows to Bitcoin, Ethereum has nothing propping it up at this time.

Furthermore, the crypto analyst explains that the ETH/BTC pair has now broken below its support of 0.05. Now, this drop below its support level is important given what has happened each time that it broke. Shin Forex points back to the last two market cycles, one in 2016 and one in 2019, of the ETH/BTC breaking below its support.

Both times that this has happened, a crash in the price has followed, before it can rally again. The crypto analyst does not expect this time to be any different and believes that ETH/BTC will fall below 0.04. If this happens, it will send Ethereum spiraling and the analyst has set a price target of around $2,500 for this.

Can ETH Price Survive The Crash?

In the short term, the Ethereum price doesn’t look to good, especially as the altcoin is currently trending downward inside its current channel, according to the crypto analyst. However, zooming out to the larger timeframe can help give an inkling of how the ETH price could perform after the crash.

Looking at Shin Forex’s chart of the last two times that a formation like this occurred, it has also set a precedent for money to flow back into Ethereum. In November 2016, the price had crashed but in a few months, there was a massive recovery as ETH/BTC rose to a new all-time high.

Ethereum

A similar thing happened the next time in 2019, with the crash coming ahead of a market rally, albeit a bit slower at this time. So, if this trend holds, then the ETH crash is inevitable. However, a recovery is expected that will likely kickstart the beginning of another massive rally.

For now, bears continue to dominate the Ethereum market and have successfully dragged the price down below $3,000. It is trading at. $2,975 at the time of this writing, with a small 0.36% decline in the last day, according to Coinmarketcap.

Ethereum price chart from Tradingview.com

CryptoQuant CEO Predicts Where Bitcoin Price Is Headed, Is $265,000 Too Ambitious?

Ki Young Ju, CEO of cryptocurrency analysis firm CryptoQuant, has given an ultra-bullish prediction for Bitcoin. The crypto founder alluded to certain factors that could spark the flagship crypto’s rise to such heights. 

Bitcoin Could Rise To As High As $265,000

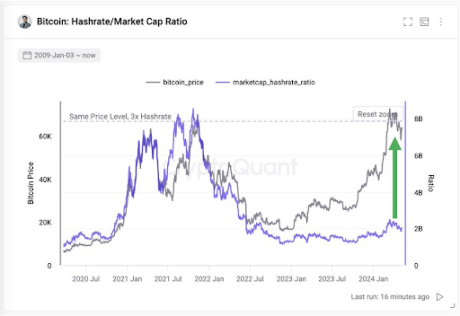
Young Ju mentioned in an X (formerly Twitter) post that “Bitcoin’s network fundamentals could support a market cap three times its current size compared to the last cyclical top.” He added that this development could help BTC rise to $265,000. The fundamental that the crypto founder was alluding to was the Hashrate/Market Cap ratio.


Bitcoin

The accompanying chart that Young Ju shared showed that Bitcoin’s hash rate is currently more than three times what it was at the last market cycle top. Meanwhile, BTC is still at the price level it was during that period. As such, the CryptoQuant CEO believes that Bitcoin could also see a 3x increase in its price, just like the Hash rate. 

Young Ju’s prediction provides a much-needed bullish outlook for Bitcoin, especially given the flagship crypto’s recent decline and talk that Bitcoin may have already attained the market top for this cycle. Tom Lee, co-founder of research firm Fundstrat, also recently shared his bullish sentiment towards BTC, stating that the crypto token will still reach $150,000 this year. 

Meanwhile, similarly to Young Ju’s prediction, crypto analyst MacronautBTC had previously stated that Bitcoin could rise to $237,000. The crypto analyst made this “conservative” calculation based on BTC’s demand outpacing its supply in the long run, especially with the halving further reducing Miners’ supply. 

A Rise To $265,000 Not Ambitious

Young Ju’s prediction of $265,000 for Bitcoin is far from ambitious when considering that Samson Mow, the CEO of JAN3, predicted that Bitcoin could rise to as high as $1 million this year. He explained that this unprecedented rise was possible due to the impressive demand that Bitcoin was currently enjoying. 

Pseudonymous crypto analyst PlanB also echoed a similar sentiment, stating that BTC hitting $1 million is possible, although he suggested that could happen in 2025 rather than this year. He made this prediction based on the Bitcoin stock-to-flow (STF) indicator, which hints at $500,000 being the average price level for Bitcoin in this market cycle. 

As such, the analyst believes that $1 million could be the market top for this bull run. Meanwhile, PlanB mentioned that Bitcoin hitting $100,000 this year was “inevitable.”

At the time of writing, Bitcoin is trading at around $61,700, down over 1% in the last 24 hours, according to data from CoinMarketCap. 

Bitcoin price chart from Tradingview.com (CryptoQuant CEO)

What Triggered The 6,350% Spike In XRP Long Liquidations Compared To Shorts?

The bulls have continued to take a beating in the market, and XRP bulls, in particular, were recently in the spotlight as $1.27 million was liquidated from their long positions. This 6,350% spike in long liquidations is likely due to XRP’s recent price action, highlighting the general sentiment in its ecosystem. 

$1.27 Million In Longs Get Liquidated

Data from Coinglass shows that $1.27 million in long positions have been liquidated in the last 24 hours. This is massive in comparison to the $19,220 liquidated in short positions during this period. This occurrence was likely due to the 3.85% drop in XRP’s price, as the crypto token dropped to as low as $0.51 in the last 24 hours. 

XRP’s price decline during this period is believed to have been caused by the sharp correction in Bitcoin’s price, with the flagship crypto dropping below $62,000 again. However, there also seems to be a bearish sentiment in the XRP ecosystem, as data in the XRP derivatives market shows that trading volume has dropped by over 26%. 

Meanwhile, options trading volume has also dropped by over 46%. These figures suggest that XRP investors are choosing to remain on the sidelines, seeing as the bears look to have the upper hand at the moment. However, the bright spot is that there has been an uptick in open interest, which means some bulls are still willing to bet on the crypto token. 

These bulls might have a good reason to gamble on the crypto token, seeing as crypto analysts are predicting significant moves for XRP. Specifically, crypto analyst Jonathan Carter recently predicted that XRP could rise to $0.93 and further to $1.68. There is also the feeling that a rally is long overdue for XRP and could be anytime soon. 

When The XRP Rally Could Come

An XRP rally could be on the horizon with the legal battle between the Securities and Exchange Commission (SEC) and Ripple almost coming to an end, with a ruling expected soon enough. Crypto analyst JackTheRippler predicted that the crypto token could rise to as high as $100 once this case ends. 

While this price level is undoubtedly ambitious, XRP could still make a significant move to the upside, considering that it also enjoyed an upward trend on the back of Judge Analisa Torres’ ruling that the crypto token wasn’t a security. 

At the time of writing, XRP is trading at around $0.51, down in the last 24 hours, according to data from CoinMarketCap. 

XRP price chart from Tradingview.com

Bitcoin Whales Lose Interest, Is This A Precursor For A Crash To $50,000?

Movement and accumulation from crypto whales are two of the catalysts for Bitcoin price increases. Although major whales are still buying the dip, on-chain data indicates a general waning accumulation momentum which suggests their conviction might actually be waning. 

According to IntoTheBlock, an on-chain analytics firm, Bitcoin whale accumulation volumes have declined substantially in each buying cycle over the past month. This decline in whale accumulation could be worrying for investors, especially as the price of Bitcoin is now trying to hold above $60,000.

Whale Appetite For Bitcoin Dips According To On-Chain Data

Whales, or large investors holding over 1,000 BTC, have accumulated strongly since the beginning of the year, especially during market dips. This accumulation has largely helped to keep Bitcoin in bullish sentiment and prevented huge price declines. However, IntoTheBlock recently revealed an interesting pattern between these whale wallets in each accumulation phase. 

The largest accumulation occurred between March 5 and March 7, when these wallets acquired over 120,000 BTC. Every succeeding price dip has, however, seen less accumulation than the one before it. Particularly, Bitcoin’s recent dip to $56,000 failed to attract notable whale accumulation. This drop in buying and selling activity indicates whales may have lost some interest or appetite for accumulating more Bitcoin in the short term.

Precursor For A Crash To $50,000?

The waning conviction among Bitcoin whales has raised the question of whether Bitcoin could reverse back into a full bearish momentum. These concerns are particularly valid, considering some analysts are of the notion that Bitcoin might’ve reached its peak in this cycle. 

As IntoTheBlock noted, prices have increased shortly following every accumulation this year. While the lower whale buying activity could stall price increases in the short term, it is not a sure sign that Bitcoin is headed for a major price crash. However, if the trend continues for several more months, it could signal lower demand and a weakening bull market.

According to the “In/Out Of Money Metric”, there is still a strong resistance volume between $59,000 and $61,000. A drop below this range again would push 552,220 addresses into losses. In fact, while a drop to his level would be painful for many holders, most crypto analysts remain optimistic about Bitcoin’s long-term prospects. 

At the time of writing, Bitcoin is trading at $61,488. The crypto recently rebounded around $57,500 and is up by 7.4% in the past seven days. According to analyst Marco Johanning, $57,000 is an important support level for Bitcoin. He noted that while a break below $57,000 could lead to further declines into $52,000, the crypto market is still very bullish for Bitcoin.

Bitcoin price chart from Tradingview.com

Cardano Entry Of A Lifetime: Analyst Predicts 5,600% Rally To $25

Cardano is currently in a downtrend, continuing to show bearish tendencies as its price trends below $0.5. However, where many have seen an altcoin that does not have many prospects, crypto analyst FieryTrading believes that the digital asset is giving investors an opportunity to get in for cheap.

Cardano Can Break Out Of Parallel Channel

In an analysis on the TradingView website, crypto analyst FieryTrading alludes to Cardano’s ability to break out and go on a massive bull run. The analysis draws from a previous analysis where the analyst had pointed out that the Cardano price had entered a parallel channel.

This parallel channel emerged with the last cycle’s top going into the current cycle top with a line drawn from the last cycle’s bottom when the lockdown had sent crypto prices crashing. Despite the crypto analyst first pointing out this parallel channel back in 2023, they believe that it continues to remain valid, especially as the price continues to rtend low.

Back then, the crypto analyst had predicted that the ADA price, if it were to break out of this parallel channel, could rise as high as as $35. This bullish expectation continues with the most recent analysis, albeit with a price adjustment.

In the Wednesday analysis, FieryTrading notes that There is still the possibility for the altcoin’s price to reach the top of the channel. In this case, the price would fully complete the move toward $30. However, the crypto analyst’s chart carries a $25 target, which would be a 5,600% rally from its current level.

Cardano price chart from TradingView.com

ADA Bears Maintain Control

Despite the bullish outlook maintained by the crypto analyst, Cardano has succumbed to the bears. The price has dropped as low as $0.44 in the last day, indicating a 1.38% decline. On a wider timeframe, the ADA price looks even worse, with an almost 28% drop in one month.

However, despite this trend, the analyst still believes that investing in Cardano right now is a risk worth taking. FieryTrading refers to it as “the entry of a lifetime” that could guarantee good returns. Moreover, the analyst gives it a R/R (risk/reward) ratio of 116, which is a good number.

For now, the ADA price is still struggling to hold up in the market. This is not helped by the decline in market sentiment, leading to a nasty 22% drop in its daily trading volume, according to data from Coinmarketcap.

Cardano price chart from Tradingview.com

Crypto Analyst Predicts 350% Surge For Shiba Inu – Here’s The Target

Crypto analyst Crypto Dona has predicted a 350% price surge for Shiba Inu (SHIB). He suggested that the meme coin will unlikely go higher than that in this bull run. 

Shiba Inu To Rise To $0.00011

Crypto Dona revealed in an X (formerly Twitter) post that his price target for Shiba Inu is $0.00011 and that he doesn’t see the meme coin going higher. A rise to that level represents a 350% price surge for the meme coin, which will undoubtedly appeal to Shiba Inu investors.

Related Reading: Here’s How This Ethereum Whale Made $16 Million From A Single Trade

Crypto Dona joins a host of other crypto analysts who predict that Shiba Inu could shed another zero from its current price level and rise to $0.0001. However, some of these analysts have given a way higher price prediction than Crypto Dona’s. One is Javon Marks, who predicts that Shiba Inu could rise to as high as $0.0001553.

Crypto analysts like Armando Pantoja and Ali Martinez have also made much higher predictions, predicting that Shiba Inu could rise to $0.001 and $0.011, respectively. Forecasts like these have undoubtedly raised the expectations for SHIB in this bull run, with community members optimistic that the meme coin could flip Dogecoin (DOGE) in this market cycle. 

Shiba Inu’s lead developer, Shytoshi Kusama, is also confident about the meme coin’s potential in this market cycle. He suggested that the meme coin is in a good position to lead this season. He alluded to Shiba Inu’s technology, vision, plan, and community as some of the reasons he holds this belief. 

The First Step Is Hitting A New All-Time High (ATH)

While Shiba Inu undoubtedly looks primed to make big moves in this bull run, the first step will be for the meme coin to rise above its current all-time high of $0.00008845, as it is currently 70% down from that price level. Shiba Inu’s Marketing Lucie has earlier predicted that the meme coin could hit a new ATH before or shortly after the Bitcoin Halving.

Related Reading: Can Ethereum Reclaim $4,000? Fragile Fundamentals Threaten To Send ETH Crashing

Crypto analyst and trader Xanrox also hinted that SHIB may hit a new ATH of $0.00008854 by July. Shiba Inu rising to a new ATH by then could set the pace for it to hit other bullish price predictions that crypto analysts have made for the meme coin. Meanwhile, it is also worth mentioning that Shiba could soon come close to its current ATH with Ali Martinez highlighting a bull flag on Shiba Inu’s chart which he belives could send the meme coin to $0.000072323. 

At the time of writing, Shiba Inu is trading at around $0.0000227, down over 4% in the last 24 hours, according to data from CoinMarketCap. 

Shiba Inu price chart from Tradingview.com

Fundstrat CEO Predicts When Bitcoin Price Will Reach $150,000 And $500,000

Thomas Jong Lee, the Chief Executive Officer (CEO) of Fundstrat, an independent financial research boutique, has maintained a bullish stance on Bitcoin. The financial analyst has predicted that the world’s largest cryptocurrency could surge massively, doubling its current price to reach $150,000 during the 2024 crypto market cycle. 

Bitcoin Could Go Parabolic In 2024

During a recent interview on Squawk Box, CNBC on May 7, Lee doubled down on his previous Bitcoin forecast, expressing strong confidence that the pioneering cryptocurrency would experience a dramatic surge before the end of 2024. He predicts that Bitcoin, currently priced at $62,371, according to CoinMarketCap, will exceed previous all-time highs and reach $150,000. 

Related Reading: Can Ethereum Reclaim $4,000? Fragile Fundamentals Threaten To Send ETH Crashing

The Fundstrat CEO disclosed earlier in April in an interview with CNBC Television, that “Bitcoin would definitely make new all-time highs this year,” predicting that the cryptocurrency could surge to $150,000 in 2024, and $500,000 long term. 

He highlighted that the strong demand for BTC has been fueling its price increase. Furthermore, the integration of the Rune Protocol, a new token standard for issuing fungible tokens on the Bitcoin network, has also bolstered the blockchain’s network. 

Lee’s ambitious forecast of Bitcoin comes at a time when the market has been experiencing significant volatility and periods of fluctuations. Bitcoin previously surged to an all-time high above $73,000 in March, propelled by the hype and demand for Spot Bitcoin ETFs.

However, after Bitcoin halving on April 20, which many analysts and investors believed would trigger another price rally, BTC witnessed a dramatic drop, falling as low as $57,000 at some point in May. 

Despite the upheaval in the broader crypto market, Lee remains optimistic about Bitcoin’s long-term value. His unwavering confidence in the cryptocurrency’s robust price fundamentals is reflected in his expectations of a potential price surge to or even exceeding half a million in the coming years. 

Factors Point To Upward Momentum After FED Rate Cut

While Lee made his bullish projections about Bitcoin, he also discussed the present inflationary situation and economic conditions of the United States. According to the Fundstrat CEO, inflation in the US is set to cool off dramatically, potentially triggering an upward momentum for Bitcoin if this happens. 

Related Reading: Here’s How This Ethereum Whale Made $16 Million From A Single Trade

The CEO disclosed that the Federal Reserve (FED) currently has more leeway to cut rates, citing their impacts on the country’s banking balance sheet. Although he refrained from specifying a precise timeline for the drop in the US inflation rate, Lee indicated that it could potentially occur by the second half of 2024. 

Overall, the Fundstrat CEO has maintained an optimistic outlook for inflationary pressures in the US, with Bitcoin typically serving as a hedge against inflation and a store of value during these periods of economic uncertainty. 

Bitcoin price chart from Tradingview.com

Bitcoin Suffers Massive Outflows Amid Crypto Market Uncertainty, Tops $284 Million

The recent unimpressive price action of Bitcoin is playing out in the minds of institutional investors, with recent data highlighting their bearish sentiment. This has led to a wave of massive outflows from  Bitcoin investment products, which could negatively impact the flagship crypto. 

Bitcoin Investment Products Record $284 Million Of Outflows

CoinShares revealed in a blog post that Bitcoin investment funds recorded an outflow of $284 million last week. Most of these outflows are said to have come from the US Spot Bitcoin ETFs, which saw outflows of $156 million last week. CoinShares noted that last week was the first time these funds recorded such a measurable amount of outflows. 

Related Reading: Can Ethereum Reclaim $4,000? Fragile Fundamentals Threaten To Send ETH Crashing

These US Spot Bitcoin ETFs indeed had a week to forget last week, as even BlackRock’s iShares Bitcoin Trust (IBIT) recorded its first day of outflows since launch, with almost $37 million exiting the fund. 

CoinShares suggested that the magnitude of outflows was likely due to Bitcoin dropping below $62,000, which they estimate is the average purchase price of these ETFs since launch. Therefore, they claim that Bitcoin’s decline may have triggered automatic sell orders. 

Before now, institutional investors had already shown mixed feelings towards these funds thanks to Bitcoin’s recent price action. As such, it makes sense that Bitcoin dropping below $60,000 made them panic sell instead of holding their positions. 

Despite this development, CoinShares noted that the Spot Bitcoin and Ethereum ETFs in Hong Kong which launched last week, were a bright spot, recording $307 million in inflows in the first week of trading. The launch of these funds could prove timely, with Bitcoin needing a catalyst to continue its upward trend. 

Interestingly, CoinShares revealed that Bitcoin was the only crypto asset to record outflows. On its part, Ethereum broke its seven-week streak of recording outflows, with $30 million flowing into Ethereum investment products. Other altcoins like Avalanche, Cardano, and Polkadot also saw inflows. 

Spot Bitcoin ETFs Still Not In The Clear

With Grayscale’s GBTC recording its first day of net inflows last week, there was the feeling that such development could spark a turnaround in the outflows that the Spot Bitcoin ETFs have been recording. However, that hasn’t been the case. On May 7, these funds recorded a net outflow of $15.7 million. 

Related Reading: Here’s How This Ethereum Whale Made $16 Million From A Single Trade

GBTC was again the primary culprit, with the fund seeing a net outflow of $28.6 million. These outflows have continued to affect Bitcoin’s price negatively, given the amount of selling pressure it is piling on the flagship crypto. 

At the time of writing, Bitcoin is trading at around $62,300, down over 2% in the last 24 hours, according to data from CoinMarketCap. 

Bitcoin price chart from Tradingview.com

Can Ethereum Reclaim $4,000? Fragile Fundamentals Threaten To Send ETH Crashing

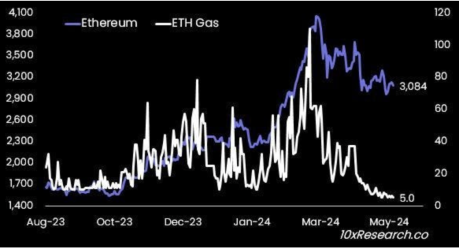
Ethereum has put on a disappointing performance for its investors over the last few weeks, leading to concerns on whether the second-largest cryptocurrency by market cap has lost its shine. The cryptocurrency continues to skirt around the $3,100 level, not making any significant breaks upward. This points to weak fundamentals that could trigger a price decline.

Ethereum Fails To Make Meaningful Moves

Markus Thielen, Head of Research at 10x Research, has pointed out some worrying developments with the Ethereum price. In a new report shared with NewsBTC, he explains that despite Ethereum remaining highly correlated to Bitcoin with an R-Square of 95%, it continues to perform poorly while the latter has made new all-time highs.

Thielen points back to ETH’s performance in the last bull market, which was closely tied to new sectors popping out of the network, such as decentralized finance (DeFi) and non-fungible tokens (NFTs). This caused demand to skyrocket, and in turn, the price followed as users gobbled up ETH for the high gas fee required to transact on the blockchain.

However, Ethereum has failed to maintain this momentum, which can be attributed to its inability to bring the upgrades that users needed in time. Thielen explains that the Dencun upgrade which helped solved the high gas fee issues had come three years too late because by 2024 when the upgrade arrived, users had moved on to Layer 2 networks. Also, during this time, other Layer 1 networks have seen a rise in users and Solana is one example of this.

Ethereum fees

The researcher further explained that the weak fundamentals of ETH are now not only affecting its price but has had a spillover effect to Bitcoin. “Ethereum’s weak fundamentals are becoming a roadblock for Bitcoin as they prevent broad fiat inflow into the crypto ecosystem,” Thielen stated.

Better To Short ETH

Thielen’s analysis of Ethereum also spreads to the drop in stablecoin usage on the network. Back in 2021, Ethereum had dominated stablecoin transactions such as USDT and USDC. However, it seems like, with other things, the high fees have driven users towards other networks. Blockchains such as Tron (TRX) are now dominating stablecoin transactions, leaving ETH in the dust.

Additionally, there is also the fact that ETH’s issuance is turning inflationary once again. After the London Hard Fork, also known as EIP-1559, was completed in 2021, the network saw its issuance turn deflationary for the first time as ETH burned quickly surpassed ETH being brought into circulation.

However, this has now changed in the past months as there have been more ETH issued than those burned, Thielen notes. To put this in perspective, a total of 74,000 ETH were issued compared to only 43,000 ETH burned. This inflation, coupled with the fact that staking rewards have now dropped to 3%, below the 5.1% offered by Treasury Yields, Ethereum has had a hard time maintaining bullish sentiment.

Given these developments, the researcher believes it is better to be bearish on Ethereum right now. “Right now, we would be more comfortable holding a short position in ETH than a long one in BTC as Ethereum’s fundamentals are fragile, which is not yet reflected in ETH prices,” Thielen concludes.

Ethereum price chart from Tradingview.com