Cardano (ADA) is moving lower below the $0.500 resistance zone. ADA could gain bearish momentum and decline if it stays below the 100 SMA (H4).
- ADA price is slowly moving lower from the $0.520 zone.
- The price is trading below $0.500 and the 100 simple moving average (4 hours).
- There is a key bearish trend line forming with resistance at $0.4740 on the 4-hour chart of the ADA/USD pair (data source from Kraken).
- The pair could attempt a fresh increase if the bulls remain active above the $0.4280 support.
Cardano Price Faces Key Hurdles
In the past few days, Cardano saw a steady decline from the $0.520 resistance zone, like Bitcoin and Ethereum. ADA price declined below the $0.500 and $0.4950 levels to enter a bearish zone.
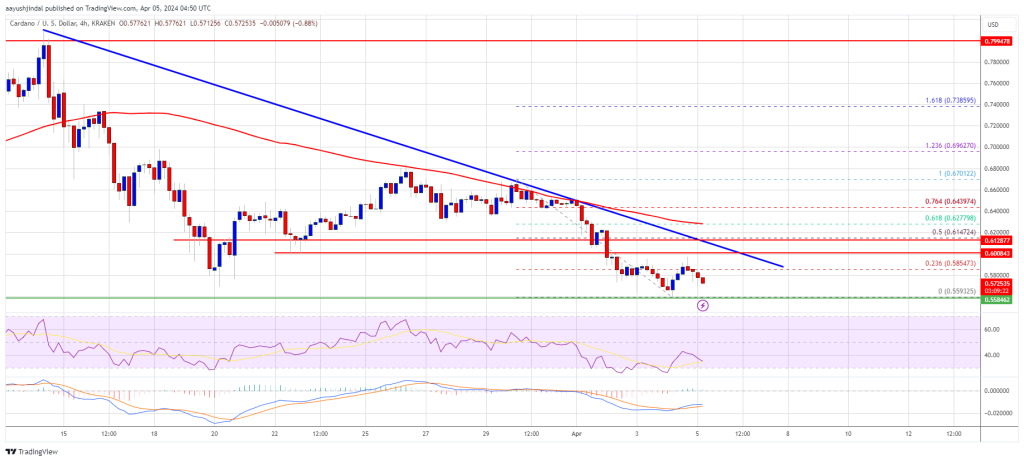
There was a move below the 50% Fib retracement level of the upward move from the $0.4000 swing low to the $0.5201 high. It even declined below $0.4650 and tested $0.450. The price is now trading below $0.500 and the 100 simple moving average (4 hours).
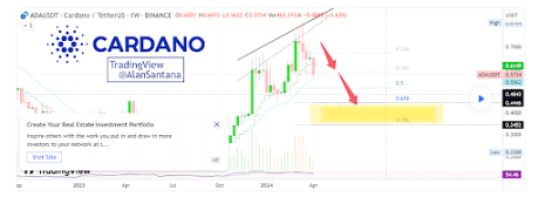
There is also a key bearish trend line forming with resistance at $0.4740 on the 4-hour chart of the ADA/USD pair. The bulls seem to be active near the $0.450 zone and the 61.8% Fib retracement level of the upward move from the $0.4000 swing low to the $0.5201 high.
On the upside, immediate resistance is near the $0.4740 zone, the 100 simple moving average (4 hours), and the trend line. The first resistance is near $0.4920. The next key resistance might be $0.500. If there is a close above the $0.50 resistance, the price could start a strong rally.
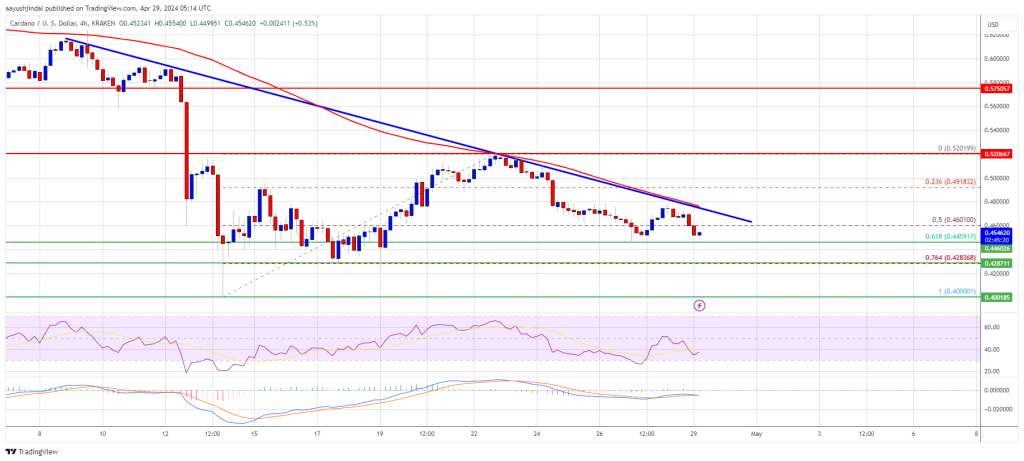
Source: ADAUSD on TradingView.com
In the stated case, the price could rise toward the $0.5250 region. Any more gains might call for a move toward $0.5650.
More Losses in ADA?
If Cardano’s price fails to climb above the $0.4740 resistance level and the 100 simple moving average (4 hours), it could continue to move down. Immediate support on the downside is near the $0.450 level.
The next major support is near the $0.4280 level. A downside break below the $0.4280 level could open the doors for a test of $0.40. The next major support is near the $0.3880 level.
Technical Indicators
4 hours MACD – The MACD for ADA/USD is gaining momentum in the bearish zone.
4 hours RSI (Relative Strength Index) – The RSI for ADA/USD is now below the 50 level.
Major Support Levels – $0.4500, $0.4280, and $0.4000.
Major Resistance Levels – $0.4740, $0.5000, and $0.5200.