A plausible explanation has emerged for why the Cardano (ADA) price has dropped below the psychological price level of $0.7. The crypto token saw a sharp correction from its monthly peak of $0.8, recorded on March 14, and has since failed to recover such a height.
Cardano Whales Responsible For Price Decline
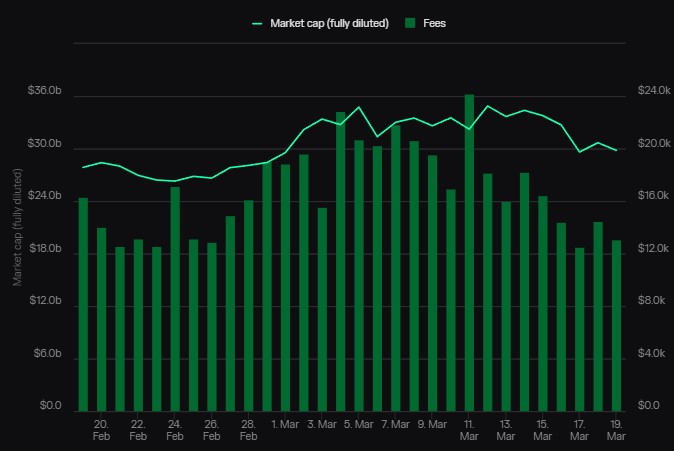
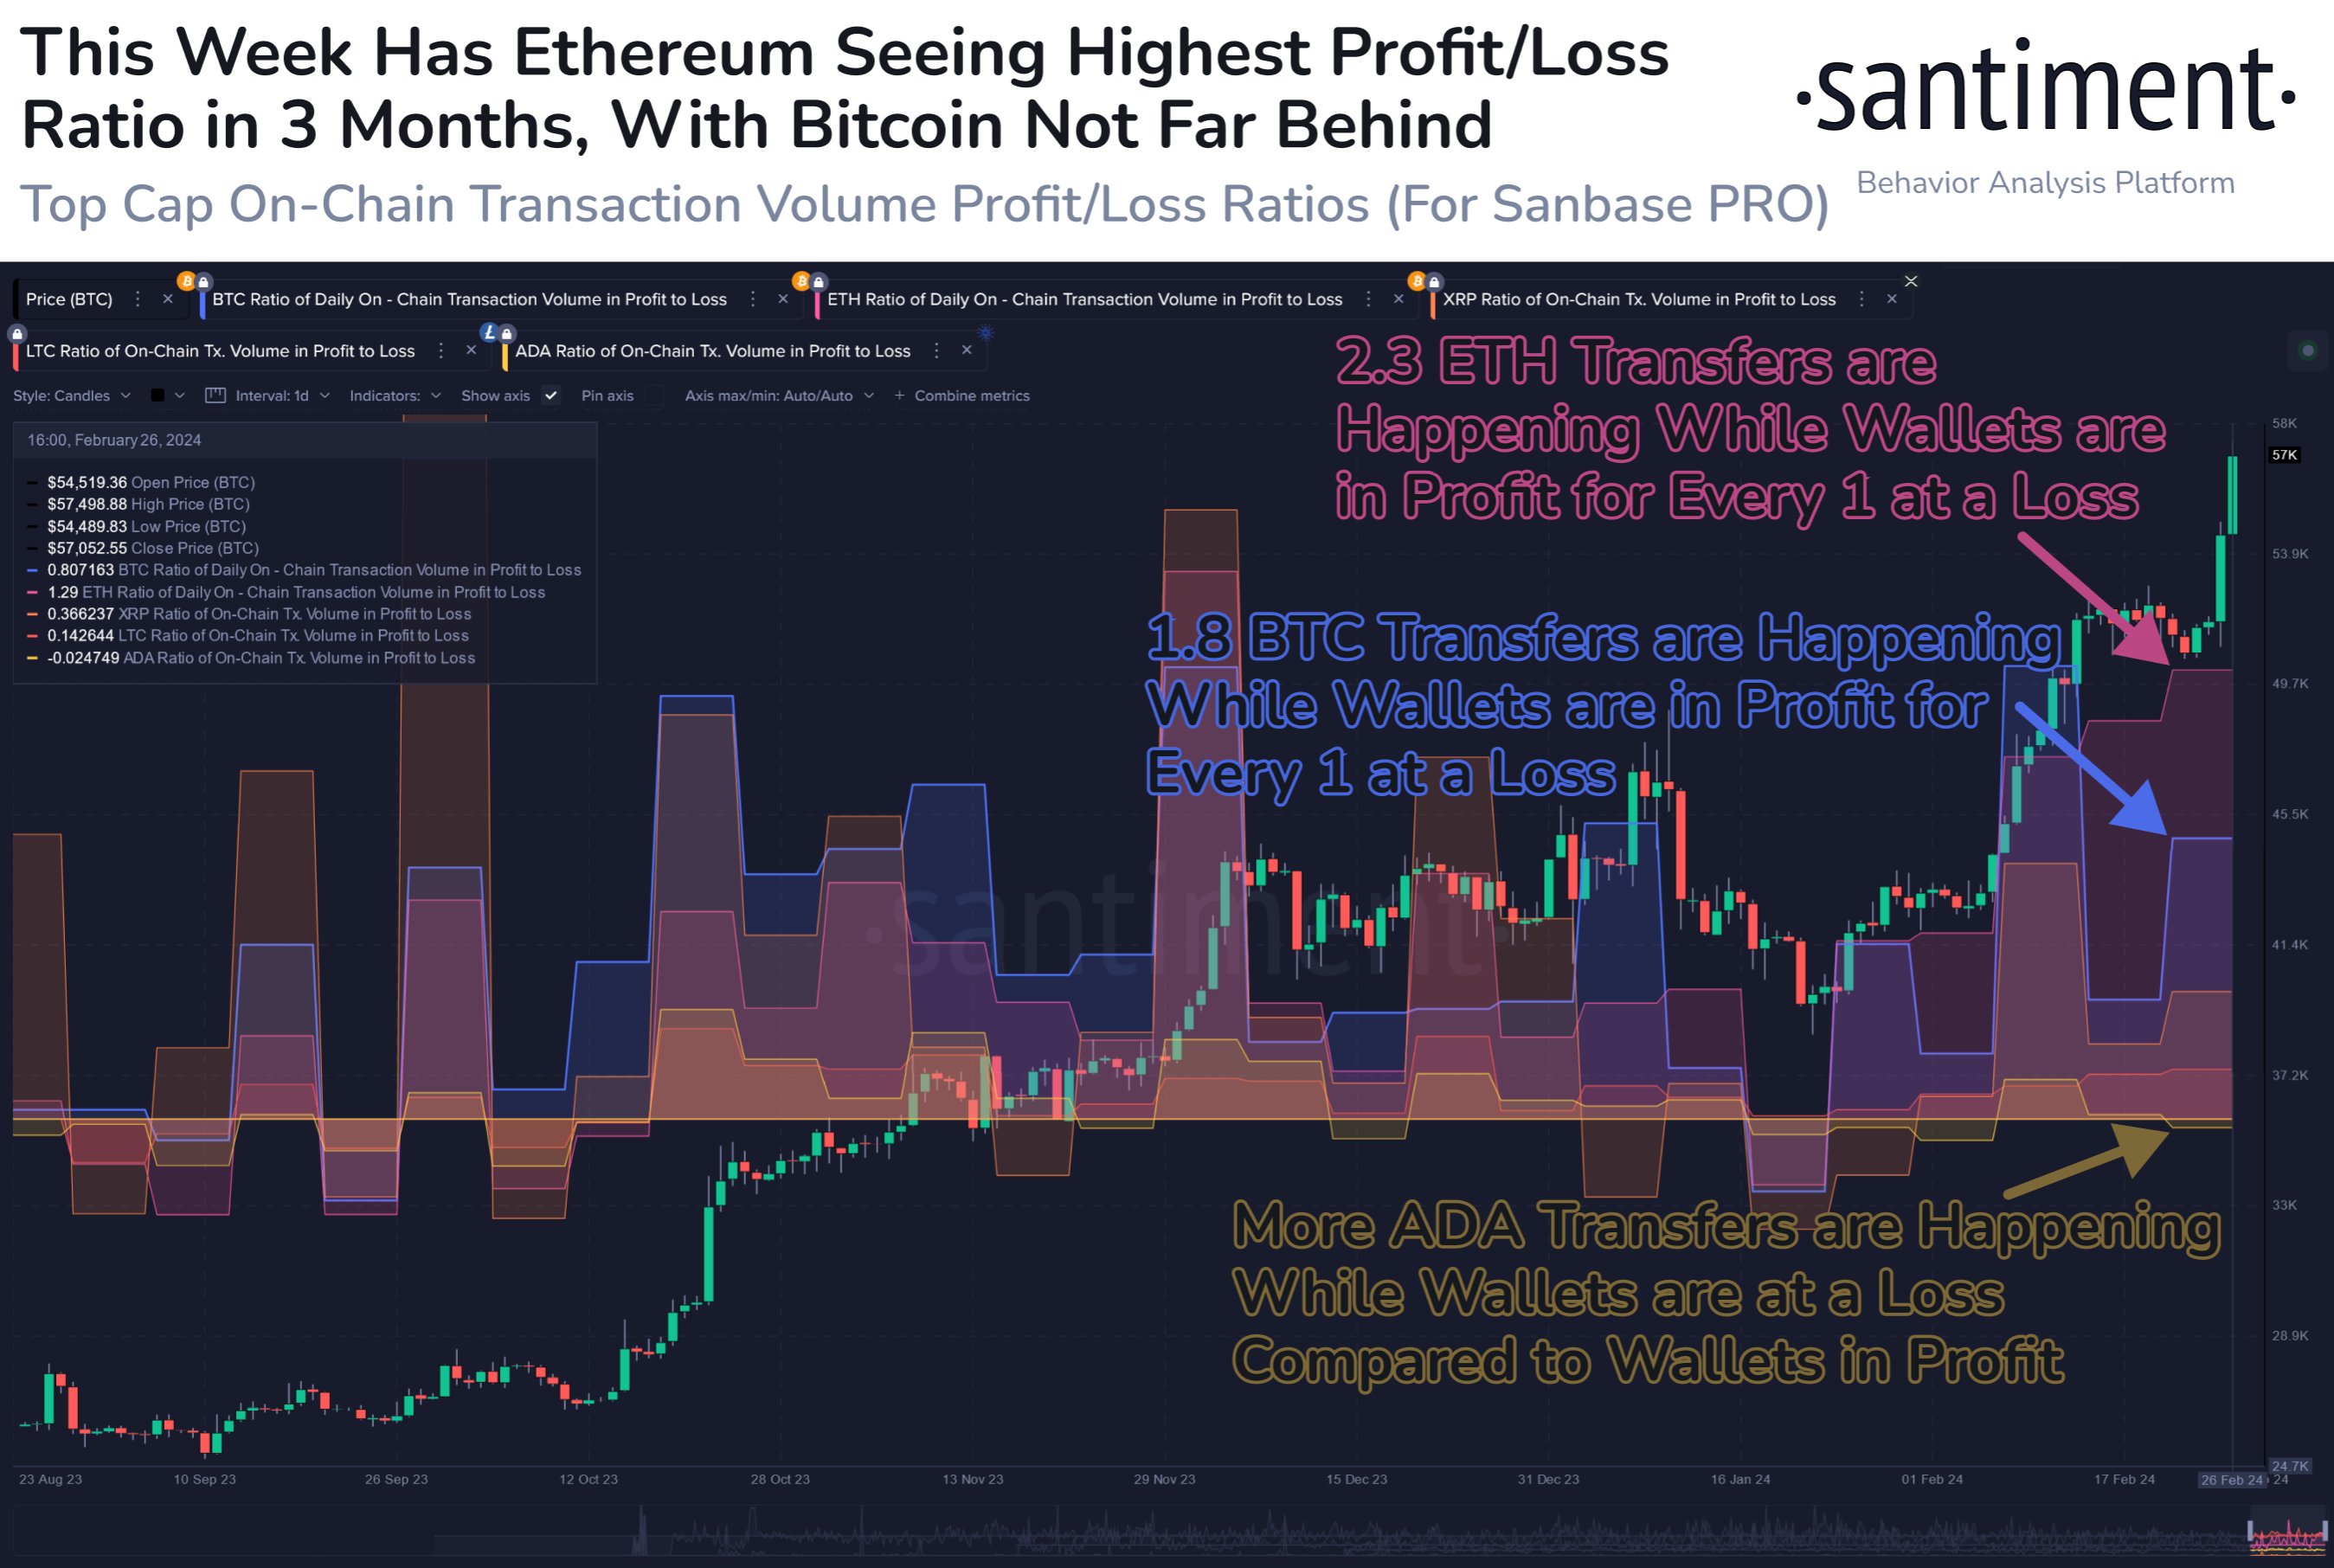
Data from the crypto analytics platform Santiment shows that the whale transaction count ($100,000 and above) on the network has reduced since March 14. That period was when Cardano hit a high of $0.8, which suggests that ADA whales began to take profits from then and have slowly exited their positions since then.
Crypto whales are known to have a massive impact on the market, and prices usually drop as soon as these traders begin to offload their holdings. Moreover, this wave of profit-taking isn’t peculiar only to the ADA ecosystem; these past few weeks have been marred by investors taking profits from different crypto tokens in which they were invested.
The flagship crypto, Bitcoin, was also not spared. Investors decided to take profits after weeks of seeing BTC make a parabolic run on its way to a new all-time high (ATH) of $73,750. Meanwhile, long-term ADA holders also looked to have used the opportunity to take some profits, as data from Santiment shows that a considerable amount of dormant ADA tokens were also transacted during that period.
Specifically, March 20 was a busy day for these long-term holders as 200 million ADA tokens (which had been dormant for a year) moved on that day.
Time For ADA To Run To $1
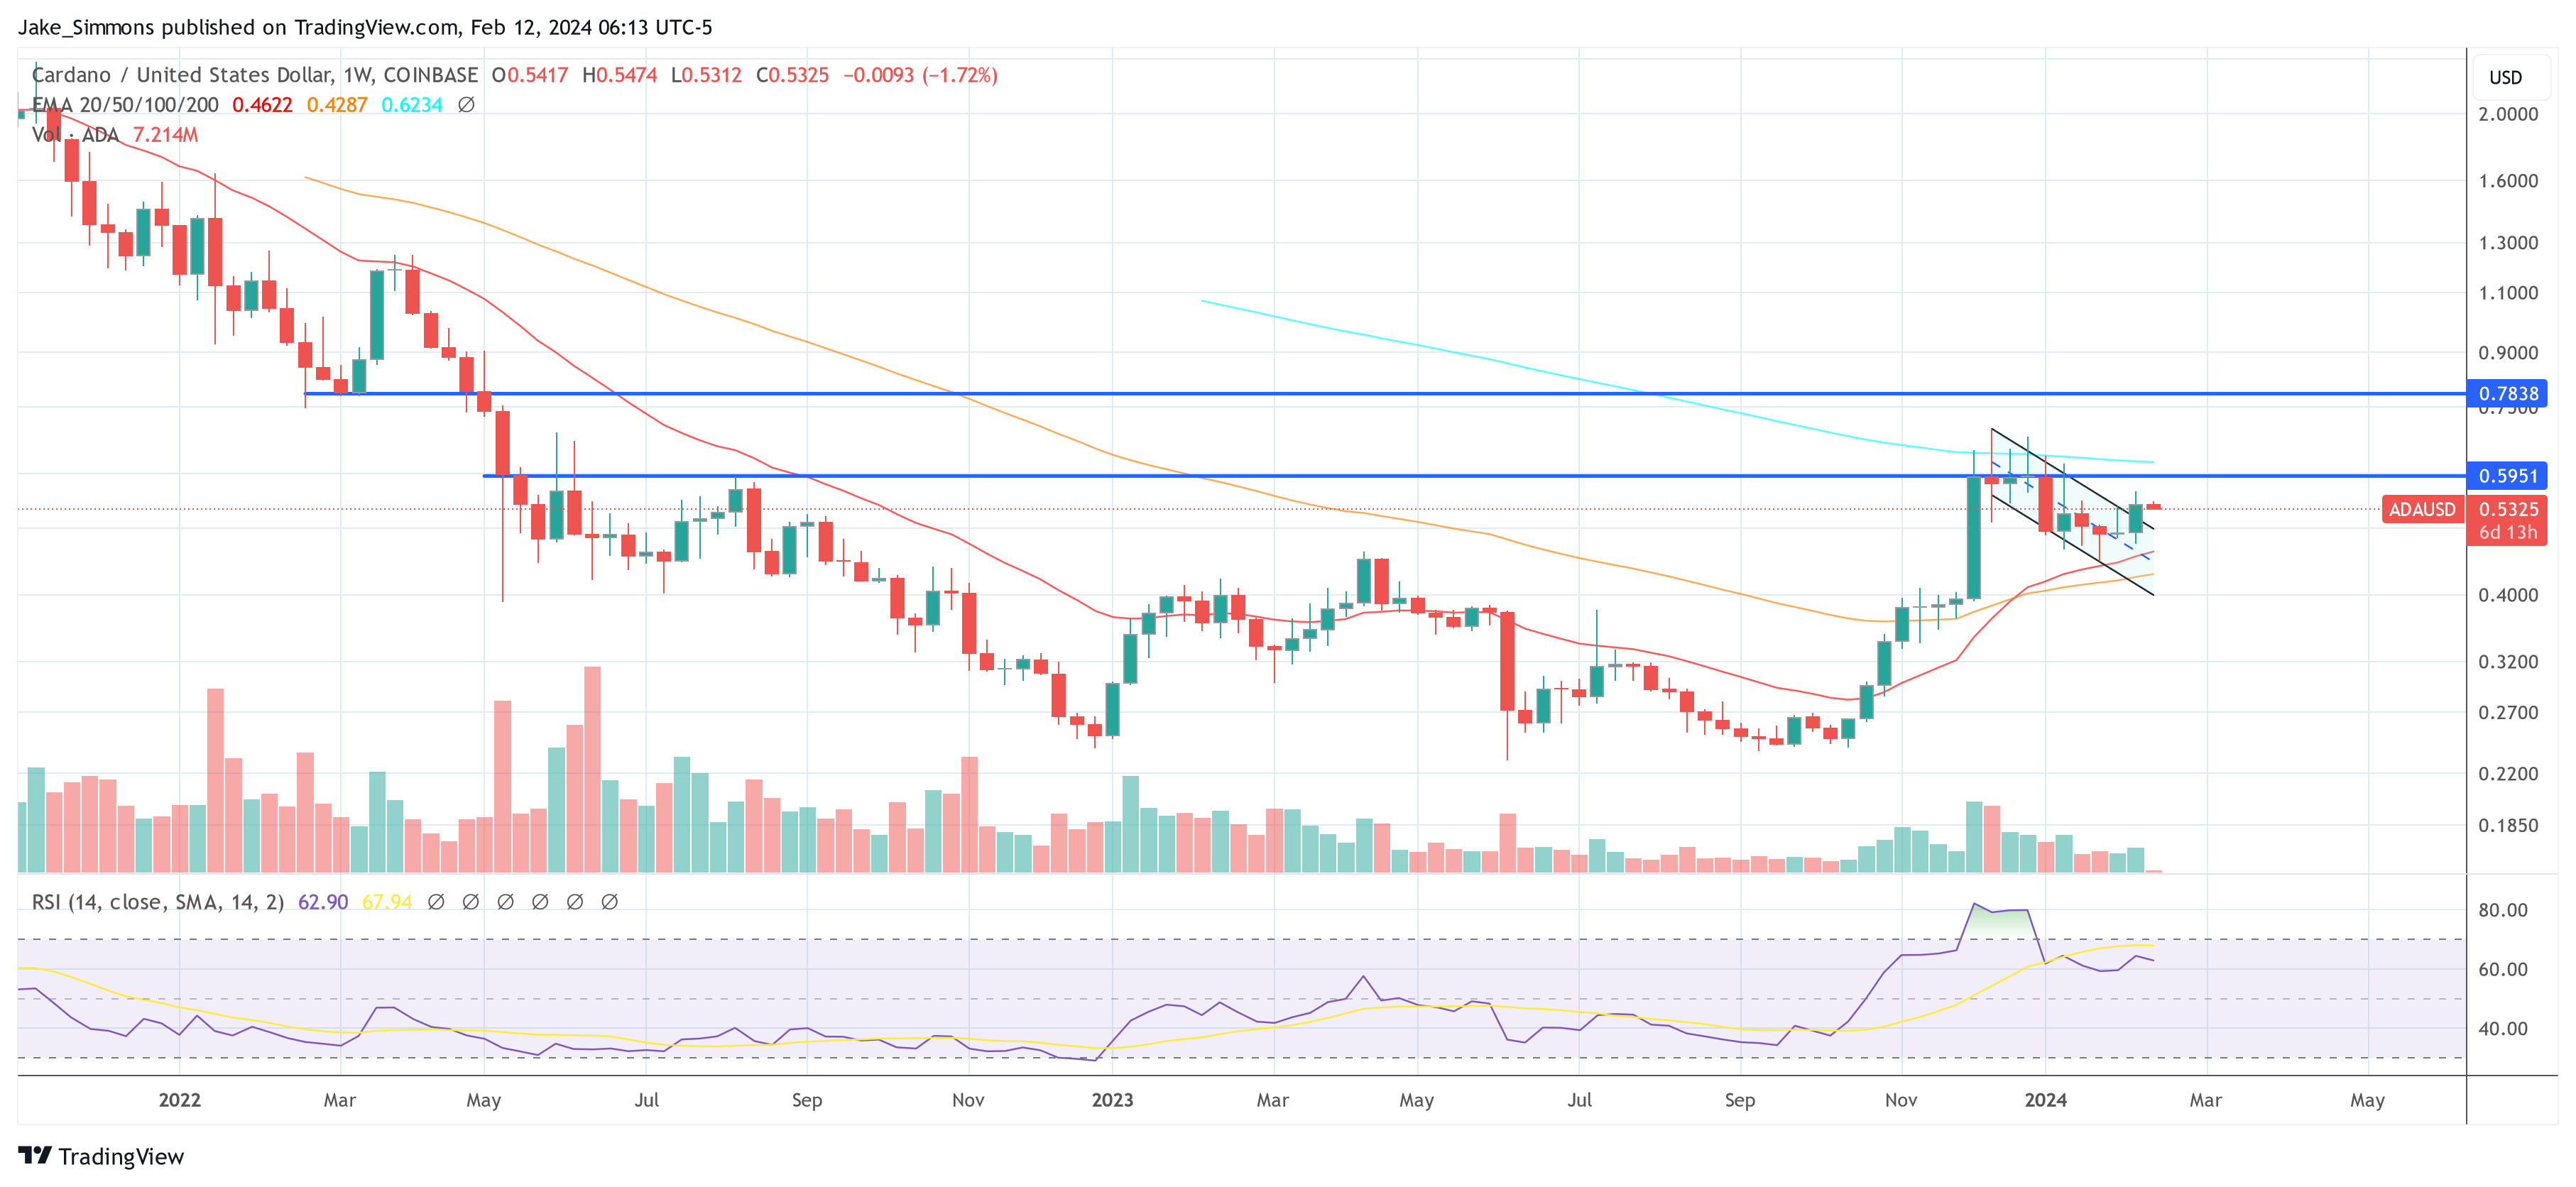
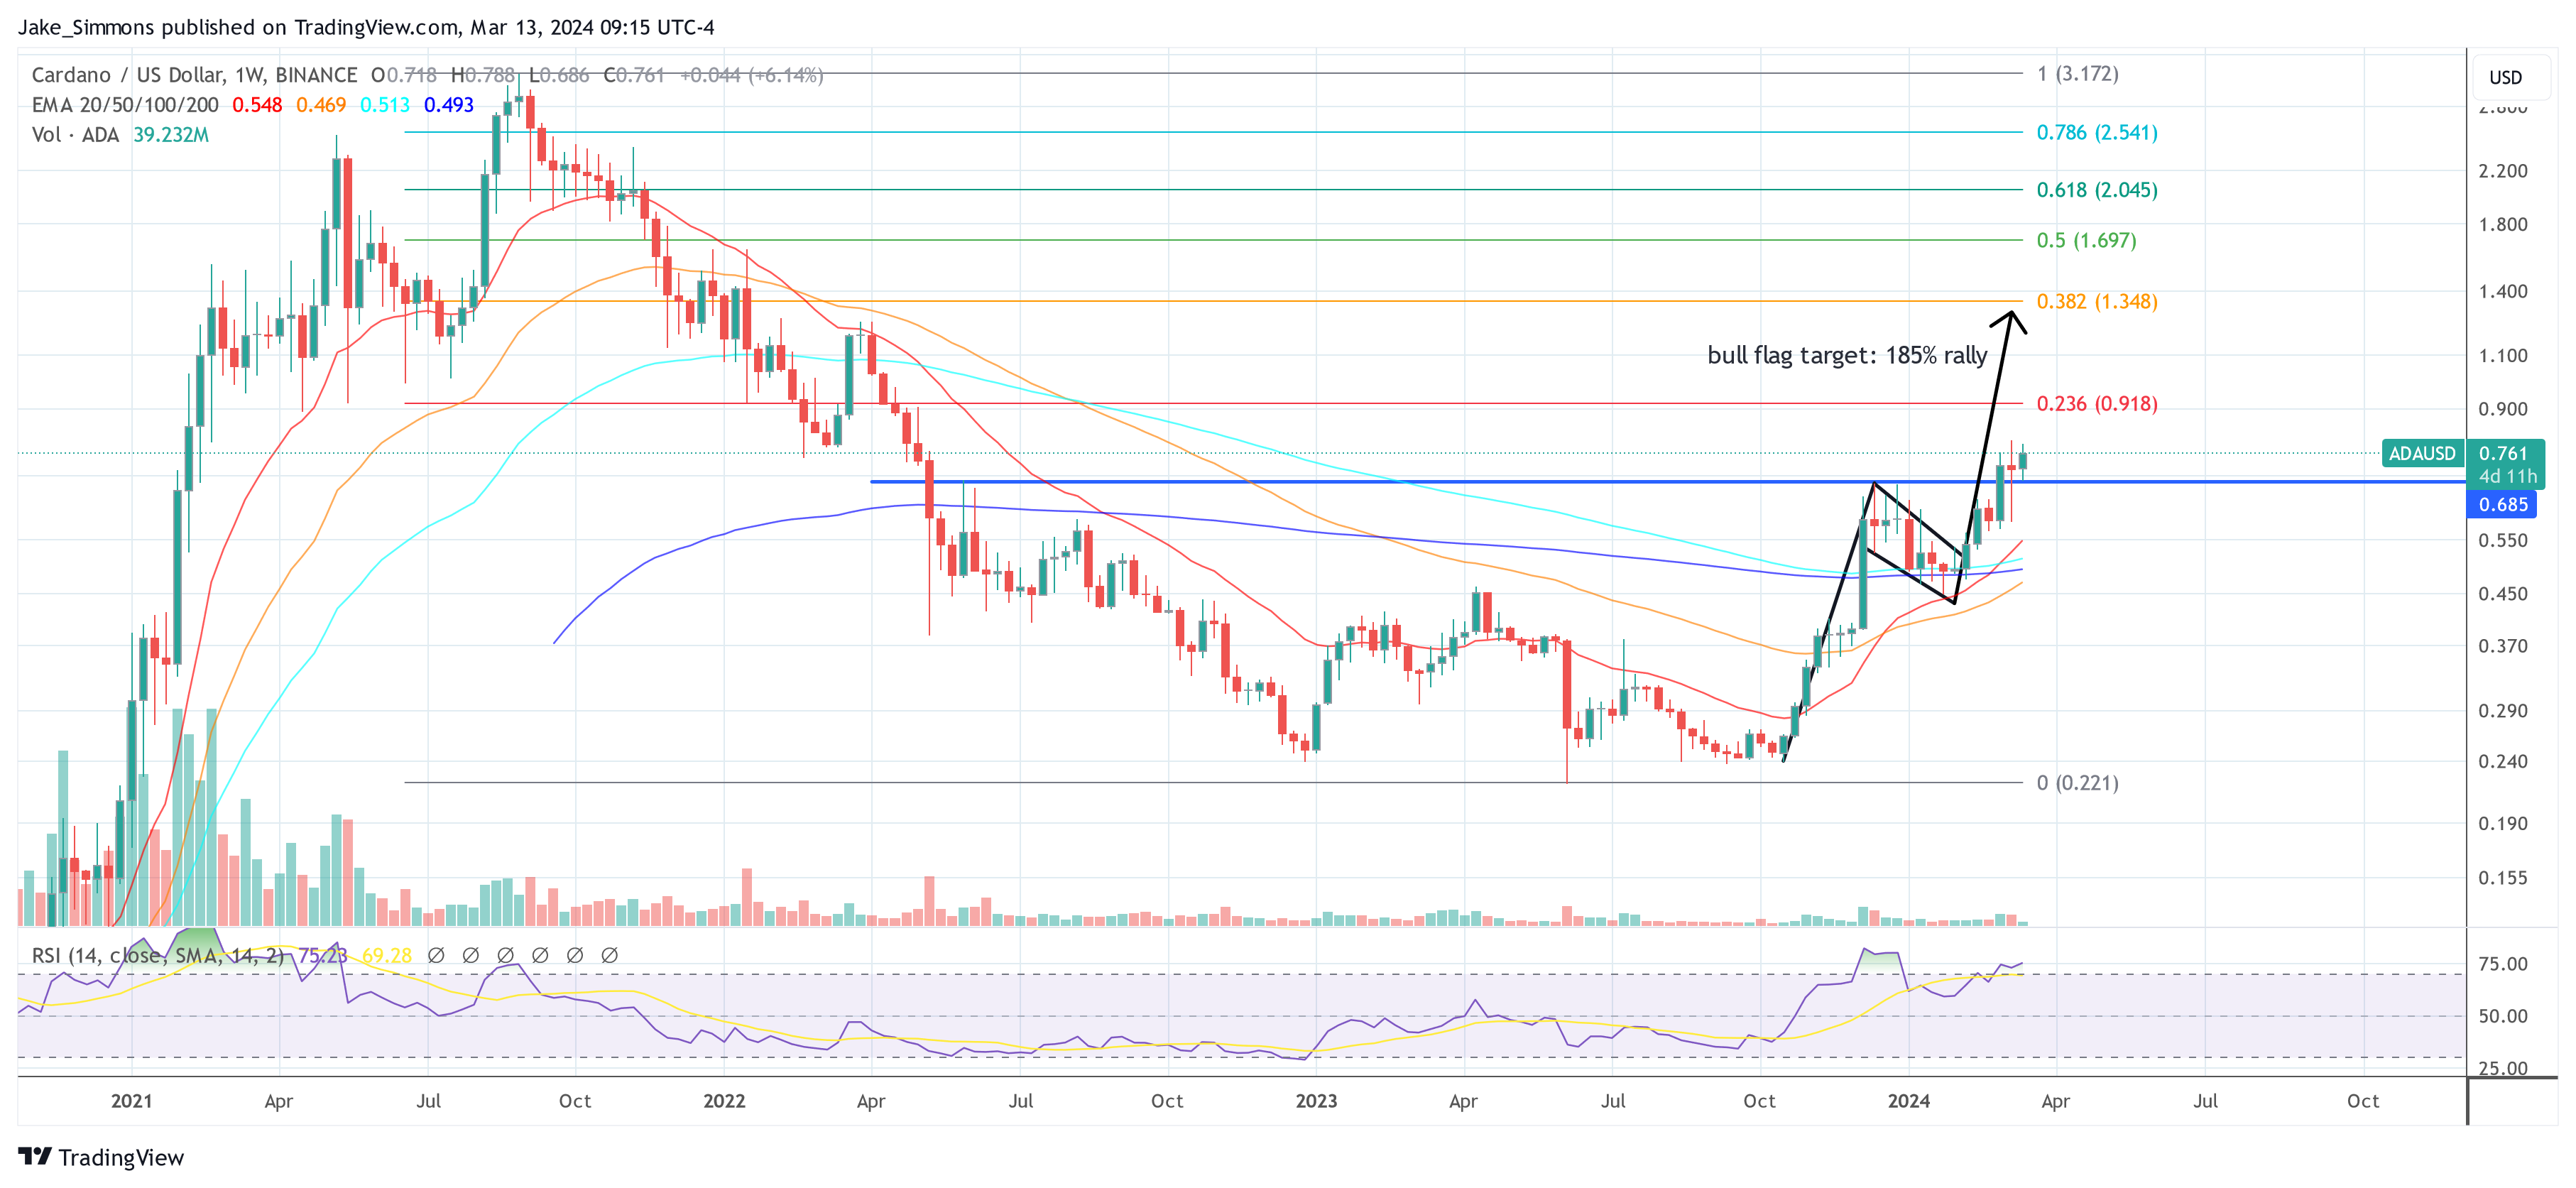
Like the broader crypto market, Cardano looks to be recovering from this recent wave of profit-taking, although at a slower pace. For its next leg up, there is the belief that the crypto token could finally break the $1 resistance. Crypto analyst Dan Gambardello recently predicted that ADA could rise to between $1.4 and $1.5 if it can break out from the $0.8 price range.
ADA whales are likely to soon return to the fold with whale transctions higher than $100,00 expected to pick up soon enough. A spike in these trasaction count would suggest that these investors are taking advantage of ADA’s current decline to accumulate more of the crypto token. That is something that could contribute to a rise in ADA’s price depending on how bullish these investors are on ADA going forward.
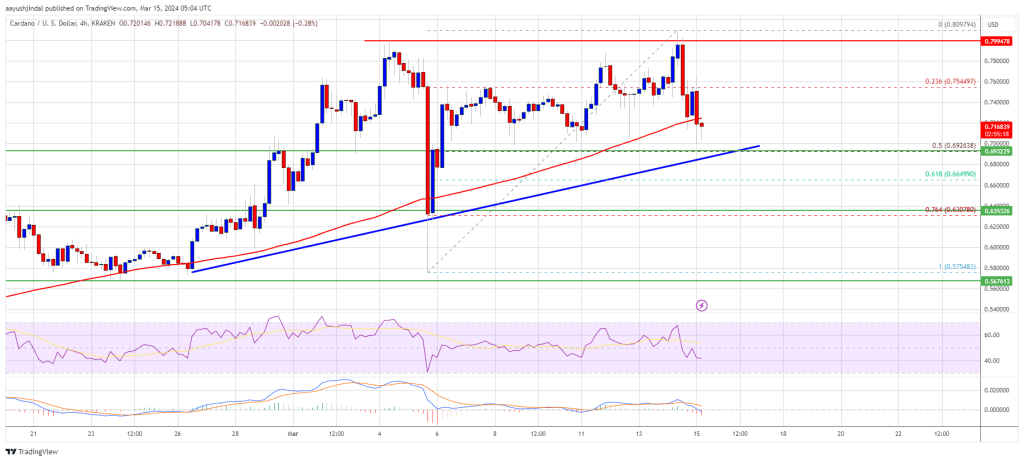
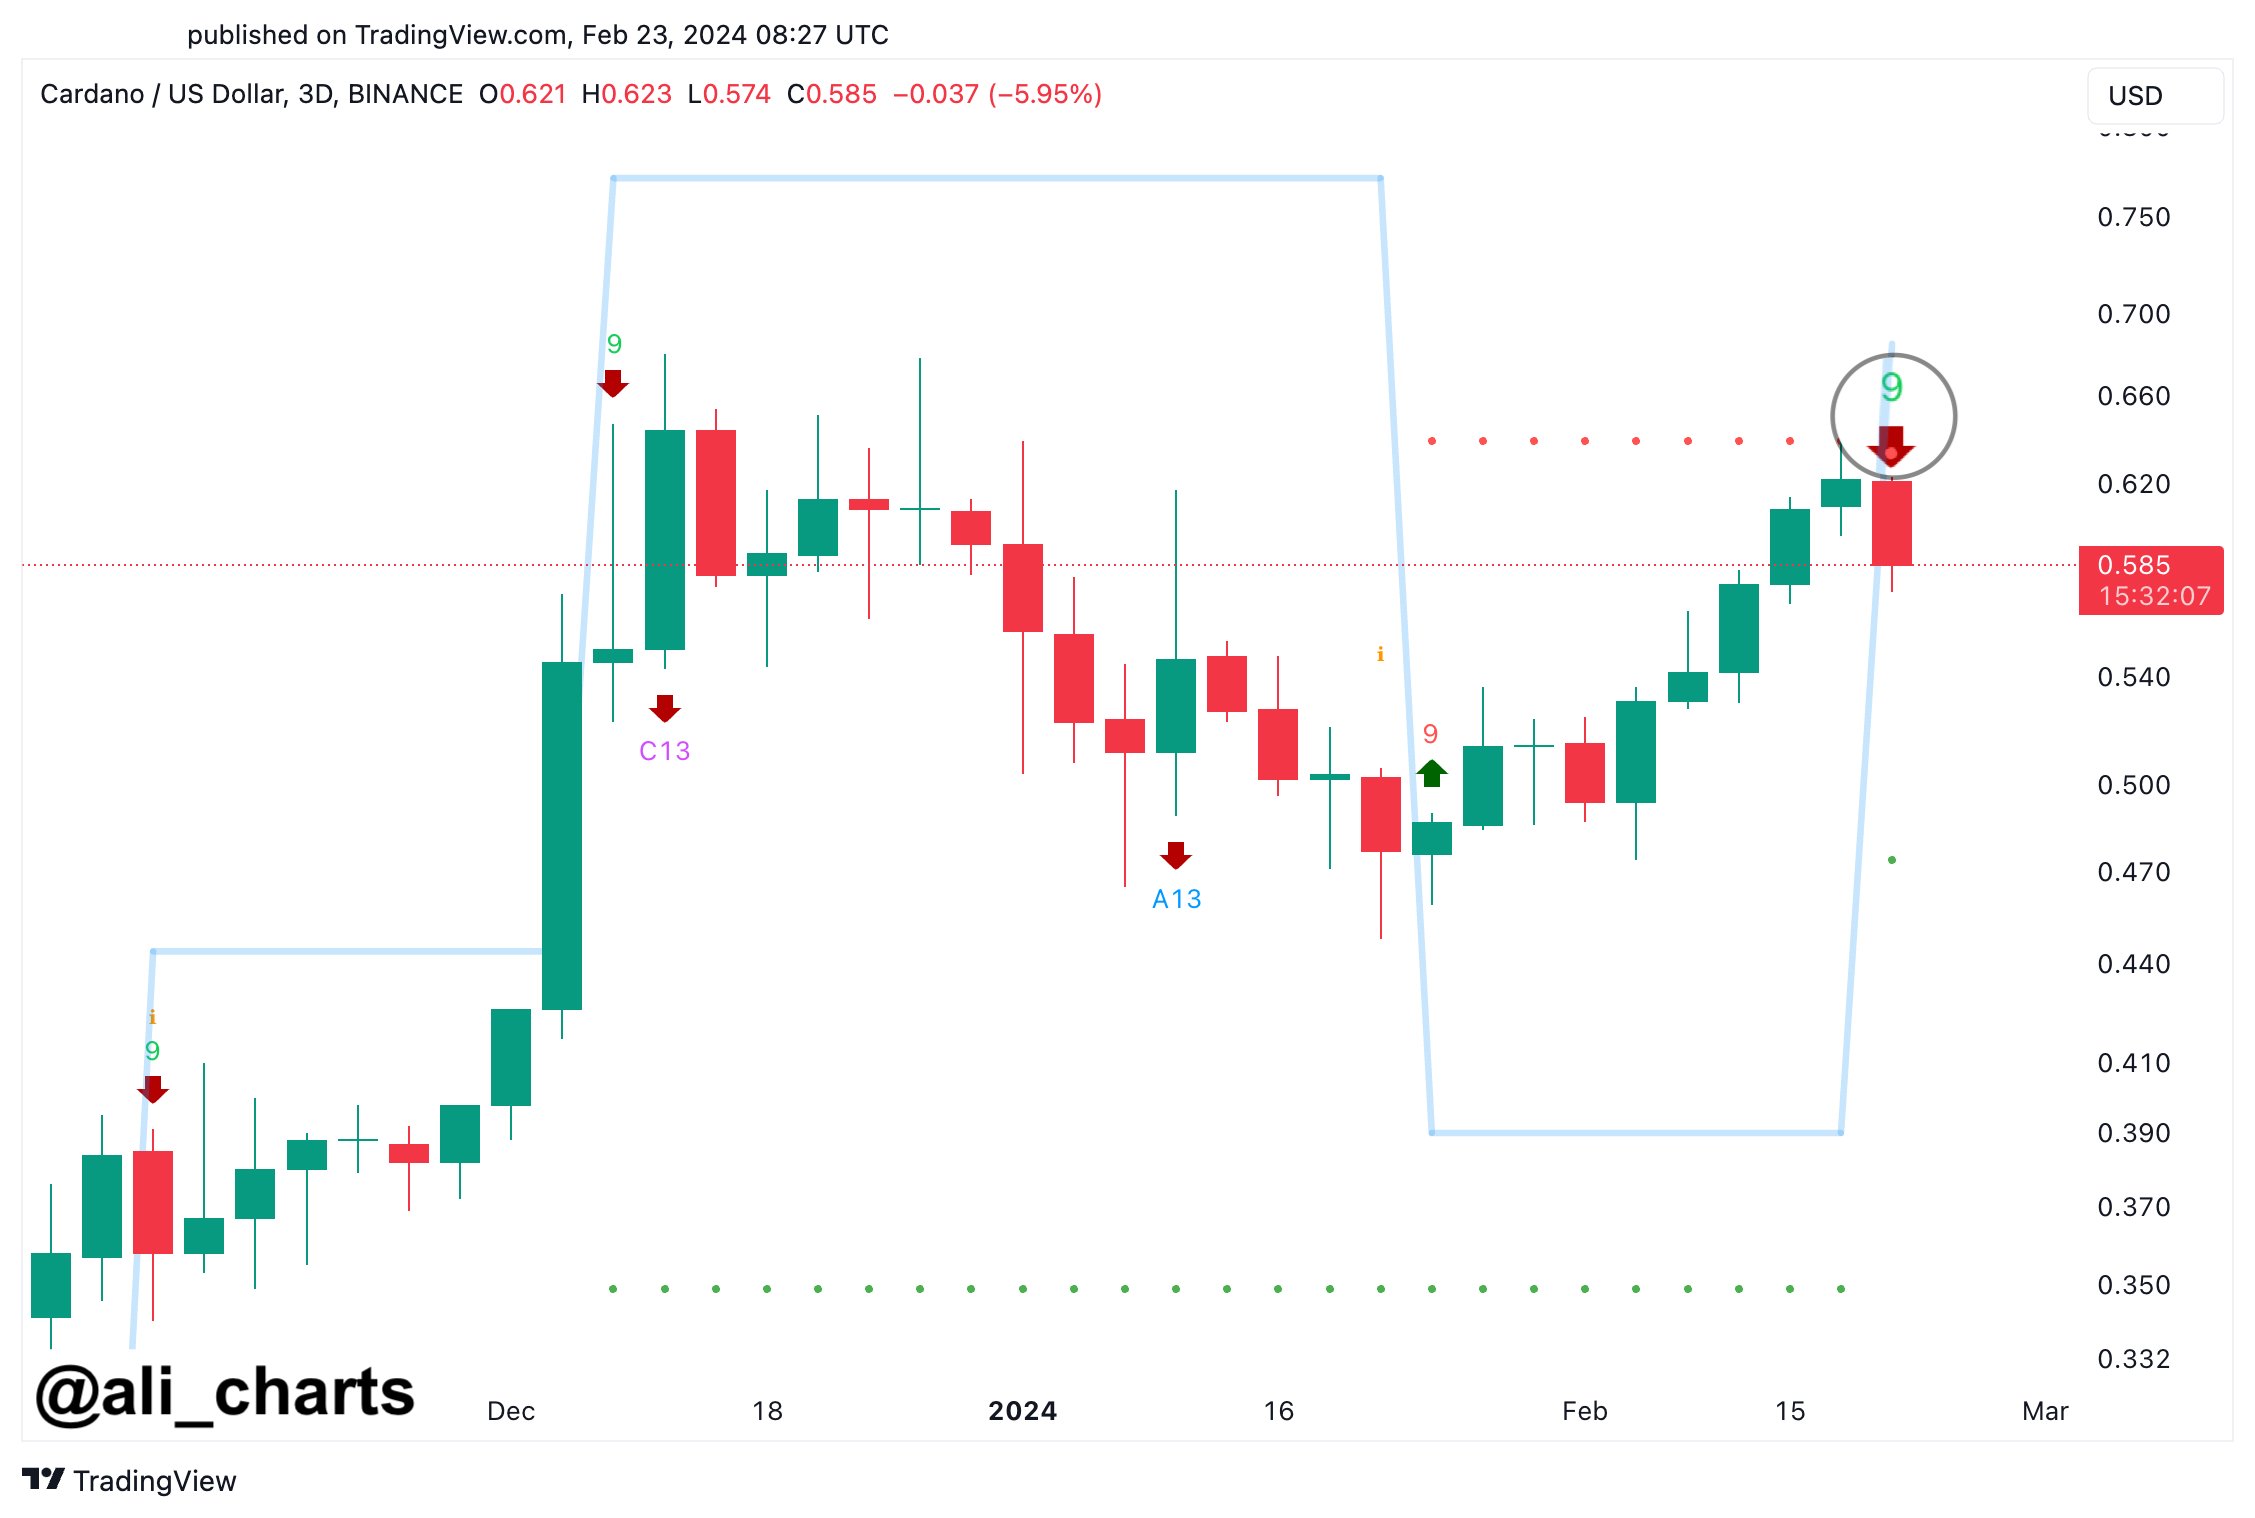
At the time of writing, ADA is trading at around $0.6513, down almost 4% in the last 24 hours according to data from CoinMarketCap.
 &
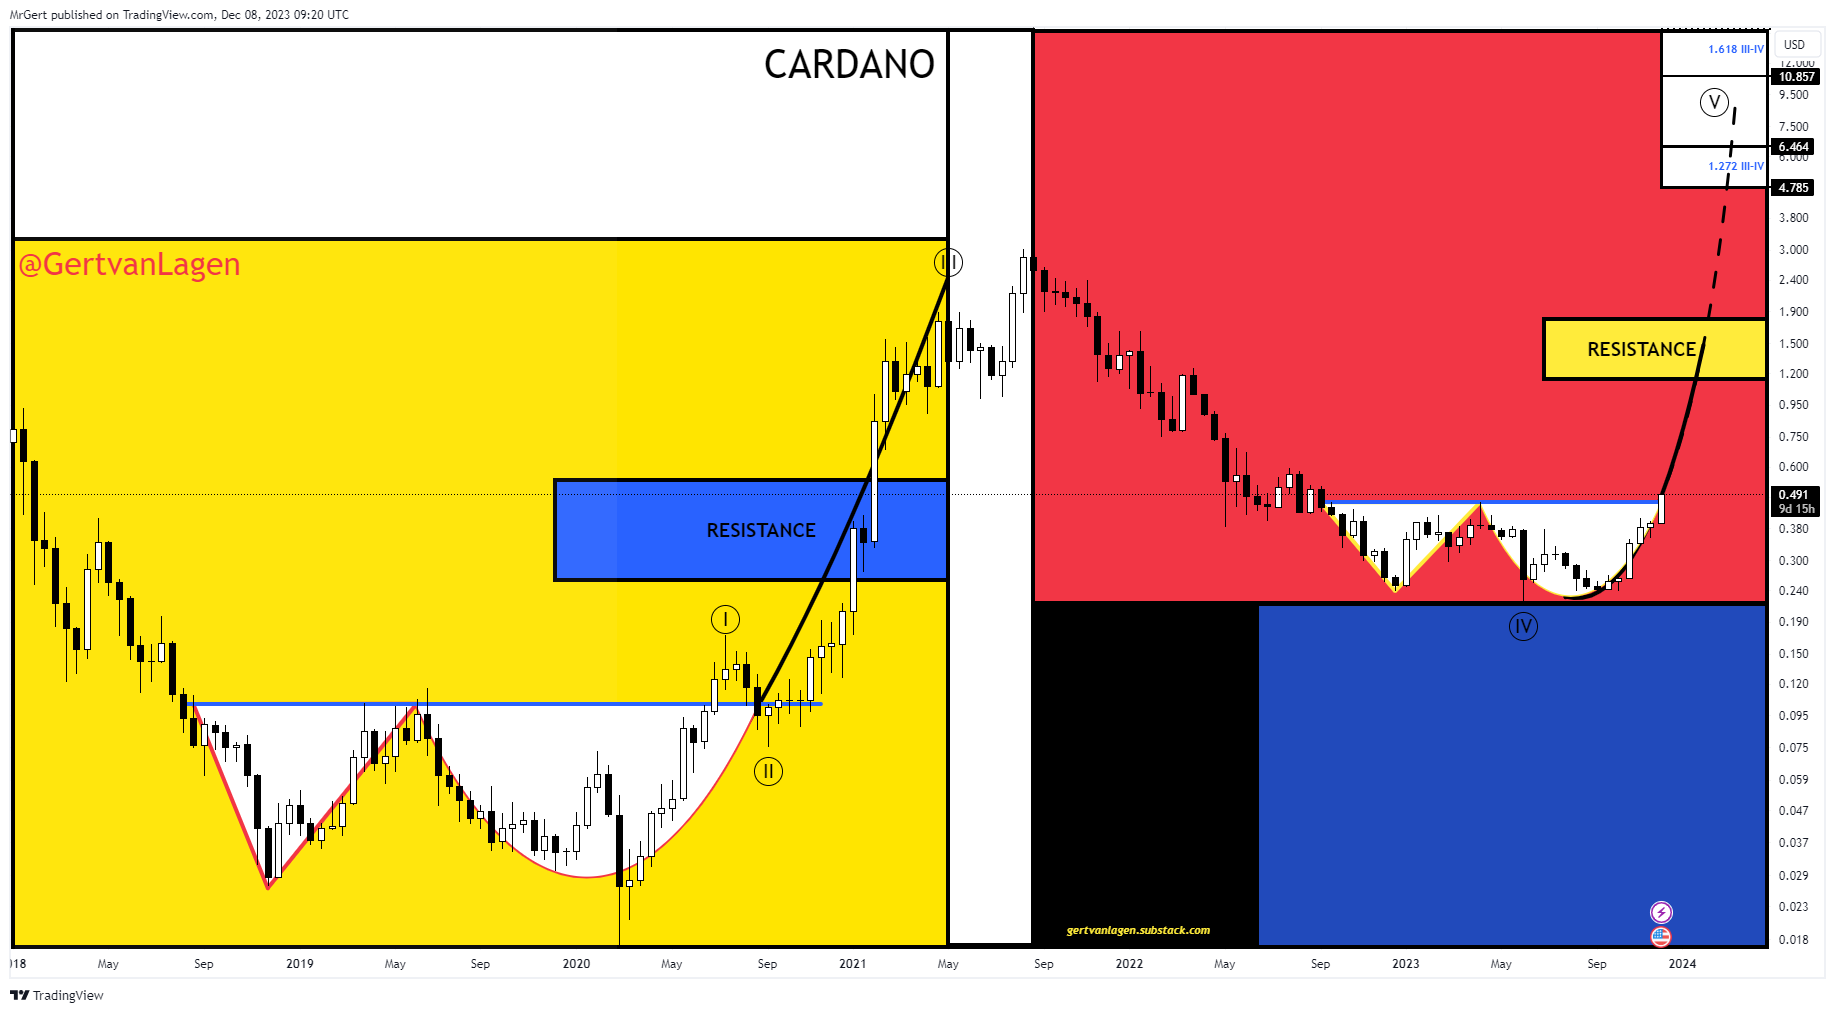
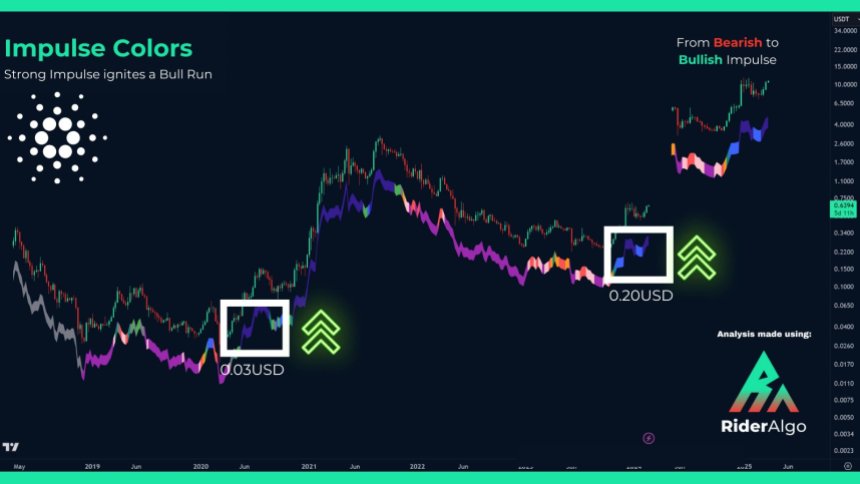
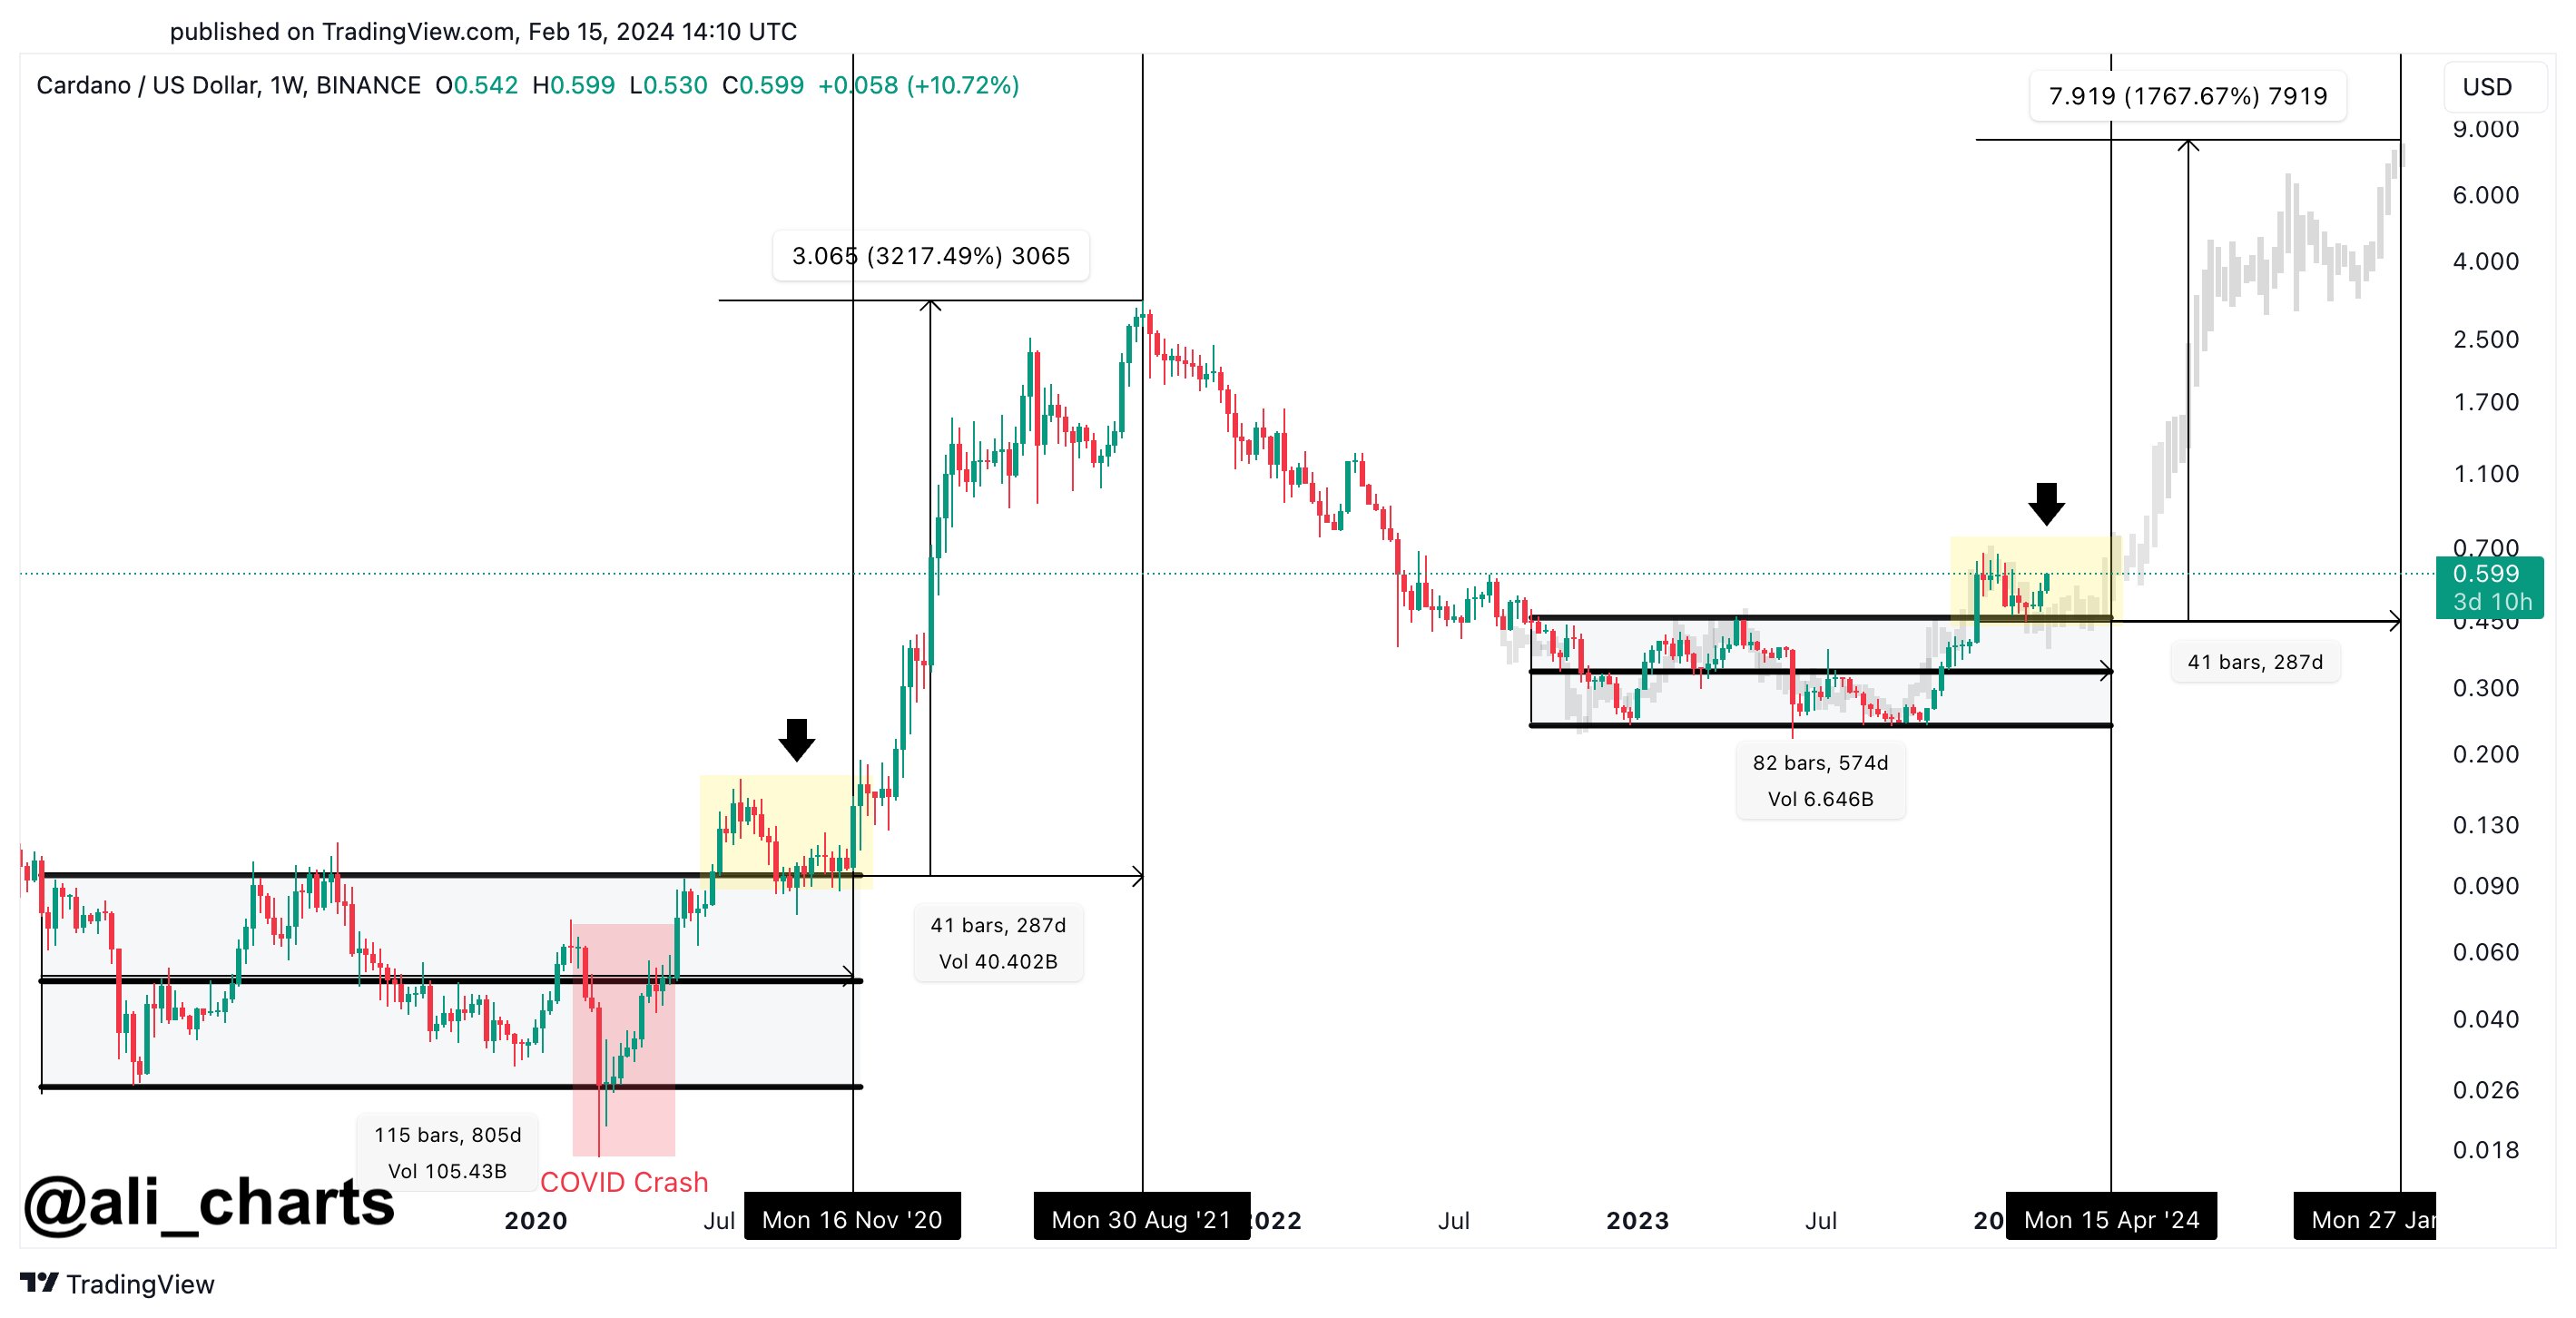
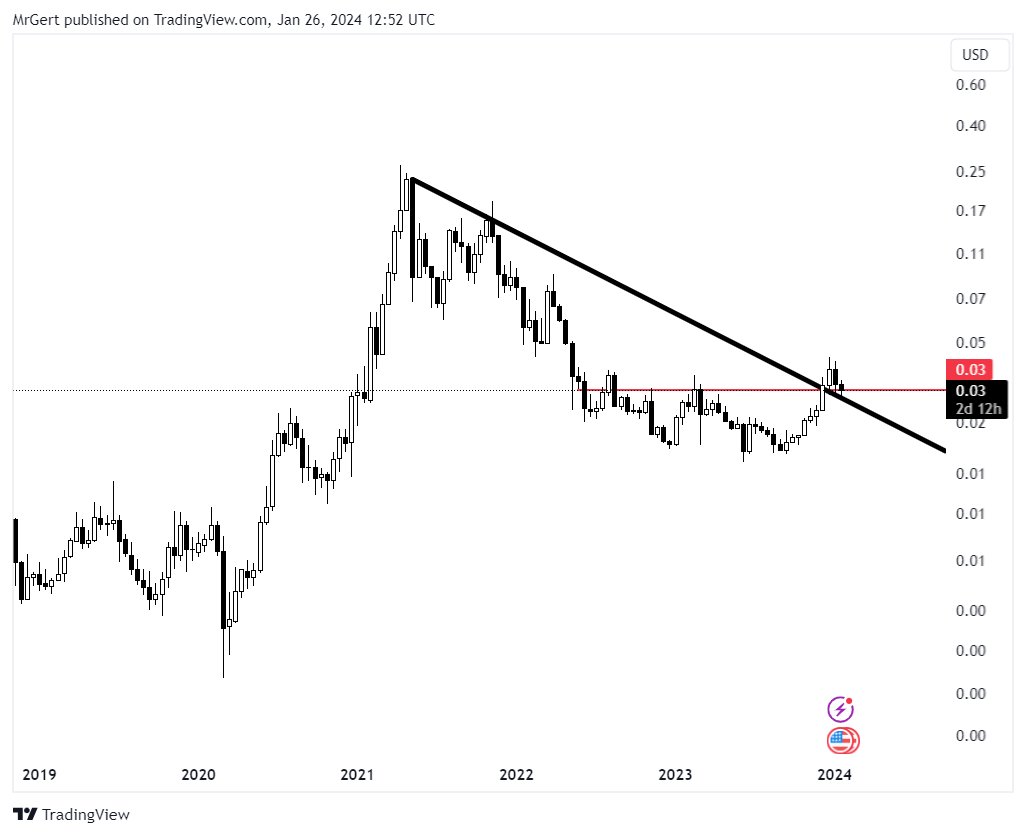
&  . Price has broken through the blue neckline and is on its way to the key resistance zone before ATH: $1.2-1.8. Conservative extension targets: $5-15. Invalidation EW-count: $0.17.”