When Will Bitcoin Bull Run Begin? This Could Be The Metric To Watch

A pattern in the supply of the Bitcoin long-term holders could provide some hints about when the next bull run might begin in earnest.

Bitcoin HODLer Balance Has Followed A Specific Pattern In Previous Cycles

According to the market intelligence platform IntoTheBlock, the supply of the BTC HODLers is “an excellent indicator for measuring market cycles.” The “HODLers” or long-term holders (LTHs) refer to the Bitcoin investors who have held onto their coins since at least a year ago without having sold or transferred them on the blockchain.

The LTHs are the resolute hands in the market, which rarely sell their coins even when a profitable opportunity has presented itself or a deep price crash has occurred.

One way to track the behavior of these diamond hands is through the combined amount of balance they carry in their wallets. The chart below shows this Bitcoin metric trend over the past few years.

Bitcoin Long-Term Holder Supply

As displayed in the above graph, the Bitcoin supply held by the HODLers has been showing some growth over the past couple of years, suggesting that the LTHs have been accumulating.

This rise in the indicator has also continued through the latest rally, implying that the LTHs aren’t yet ready to start taking their profits. Something to note is that when the metric goes up, it doesn’t mean buying is happening in the present.

The indicator naturally has a 1-year lag associated with it, as coins must mature for that long before they can be included in the cohort. However, this only applies to buying as the holders moving their coins to sell instantly reset the age back to zero and, hence, remove them from the group.

In the chart, the analytics firm has highlighted a pattern that the Bitcoin LTH supply has observed during the leadup to past bull runs. It would appear that the HODLers have shown accumulation in such periods.

On the other hand, the start of selling from this cohort coincided with the beginning of the bull rally in proper. So far, the HODLers have only been accumulating recently, implying that the market may be in the pre-bull run phase.

If the historical pattern indeed holds for the current cycle as well, then the HODLer supply could be one to watch, as a significant downtrend in it could turn out to be a signal that the bull run has begun once more.

BTC Price

Bitcoin had plunged towards the $41,700 mark yesterday, but the asset has already seen some sharp recovery as its price is now trading around the $43,000 level.

Bitcoin Price Chart

Bitcoin Bulls Gear Up: 200-Day SMA Rise And Historical Trend Signal $50,000 Price Target

In a surprising turn of events, Bitcoin (BTC) has once again defied expectations by reaching a new yearly high, igniting speculation about whether it can break the $40,000 milestone. 

After a brief consolidation phase, the leading cryptocurrency has regained its bullish momentum, soaring to a peak of $38,000 before retracing to its current trading level of $36,400. As the market eagerly awaits the next move, experts and analysts weigh in on Bitcoin’s potential to sustain its upward trajectory.

BTC’s Golden Cross Signals Potential Surge To $50,000

The Birb Nest team provides valuable insights into the short-term scenarios for Bitcoin. From a fundamental perspective, the anticipation of ETFs (Exchange-Traded Funds) and the upcoming halving event contribute to the current drive and support the bullish sentiment in the market. 

Moreover, from a technical standpoint, Bitcoin’s recent breakthrough of $32,000 has its sights set on the key psychological level of $40,000, bolstered by the presence of the Golden Cross and a rising 200-day simple moving average (SMA).

The Golden Cross, a bullish technical pattern formed when a short-term moving average crosses above a long-term moving average, has played a significant role in Bitcoin’s recent surge. 

Combined with the rising 200-day SMA, which indicates a strengthening long-term trend, these indicators reinforce the ongoing uptrend and provide a strong foundation for Bitcoin’s potential upward movement.

According to the Birb Nest team’s analysis, Bitcoin’s price action suggests an imminent increase in volatility, as indicated by the bullish Fear & Greed Index registering at 68.

After experiencing a 27% jump in October, surpassing the historical average, November historically exhibits robust gains of over 40%, potentially propelling Bitcoin toward $50,000. 

Notably, the second half of the month tends to be more bullish, heightening the anticipation for further price appreciation.

Expert Identifies Pivotal Resistance For Bitcoin

According to a recent post on X (formerly Twitter) by the crypto expert Michael Van De Poppe, $38,000 to $40,000 represents a critical resistance zone for Bitcoin. 

This means that price levels within this range will likely face significant selling pressure and challenge Bitcoin’s upward momentum. Van De Poppe warns against expecting an immediate breakout above this resistance level, suggesting that consolidation beneath it is a more probable scenario.

Bitcoin

Van De Poppe emphasizes the importance of consolidation beneath the resistance zone. Van De Poppe suggests that such consolidation provides a healthy base for Bitcoin’s price to gather strength before attempting a breakthrough. 

By stabilizing within this range, Bitcoin builds a stronger foundation to support a potential bullish move in the future.

Regardless of the forecast, the cryptocurrency’s upcoming price action remains to be seen if it will be accompanied by consolidation and a subsequent breakout or if Bitcoin is inclined to test lower support levels before embarking on another bullish move.

Featured image from Shutterstock, chart from TradingView.com 

Stanford MBA Explains Why Next Bitcoin Cycle Could Be “Bigger”

A Stanford MBA has explained why the current Bitcoin cycle was different from the others, and why the next one could end up being bigger.

This Bitcoin Cycle Faced Obstacles That May Not Be There Next Time

A “cycle” for Bitcoin refers to the period between two consecutive halvings. The halvings, events where the rewards miners receive for solving blocks on the network are permanently slashed in half, are chosen as the start and end points for the cycles due to the immense significance they hold for the cryptocurrency.

The rewards miners earn are essentially the only way new supply can be introduced into circulation, so since halvings cut these in half, the production rate of the asset itself gets tightened.

Because of basic supply-demand dynamics, Bitcoin’s post-halving scarcity increases the asset’s valuation. It’s not a coincidence that the bull markets have always followed these special events.

The halvings occur roughly every four years, with the next one being scheduled for next year. As BTC transitions towards a new cycle, Jesse Myers, a Stanford MBA, has released a new post that looks back at this cycle so far and compares it with the previous cycles.

At first sight, one difference becomes immediately clear: the structure of the top during this past bull market wasn’t anything like what the previous cycles displayed.

Bitcoin Halving Cycles

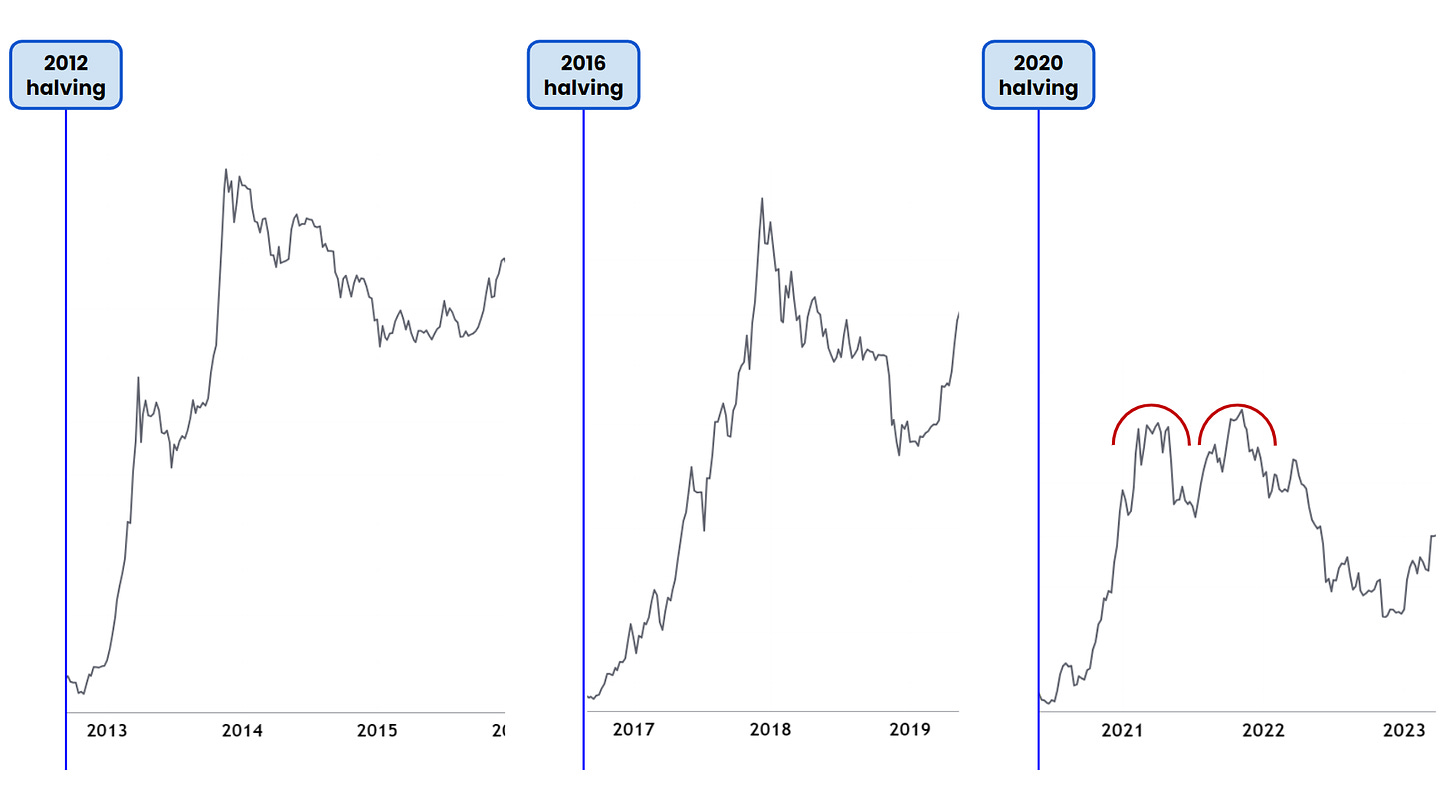
“Instead of a parabolic advance culminating in a blow-off top, we got a bi-modal rounded top spread out over six months,” notes Myers. So, why did the BTC price behave differently during this bull market?

Well, there are mainly four factors at play here. The first and undoubtedly the biggest one would be COVID-19 and the US government’s response to it. The onset of the virus and the black swan crash that came with it just preceded the cycle, meaning that the cycle kicked off in anomalous conditions.

During the cycle itself, the Fed was giving out stimulus checks as a way to mitigate the economic impacts of COVID. “That Quantitative Easing (QE) undoubtedly helped fuel the 2021 Bitcoin bull market,” explains the Stanford MBA.

The problem came, however, when the Fed changed its policy and switched to Quantitative Tightening (QT). Interestingly, this switch appears to be what marked the Bitcoin top in November 2021.

In the middle of all this, another factor was also at play: the May 2021 China ban on Bitcoin mining. Back then, China was the biggest hub of cryptocurrency mining, so the ban naturally delivered a significant shock to the sector.

The resulting selling pressure crashed the market, leading to the bull rally prematurely halting. It wasn’t until three months later that bullish winds once again returned for the asset.

While these factors have been quite influential for BTC, it’s apparent that they are unlikely to repeat, meaning they shouldn’t have any presence in the next cycle.

On the contrary, the other two factors that made this cycle different are likely to appear in the next cycle as well. This previous bull market was the first one where investors widely used leveraged futures trading. Probably, leverage would again come into play in the next bull market.

Lastly, there is the fact that platforms like FTX issue a lot of “paper Bitcoin.” Supply equivalent to 25% of the mined BTC that year was owned by FTX’s customers, but this BTC didn’t exist; it was only there on “paper.” The analyst believes that such fudging will likely be present during the upcoming cycle.

While there had been some developments in this cycle that ultimately shortened the bull market, some changes can be favorable for the next cycle.

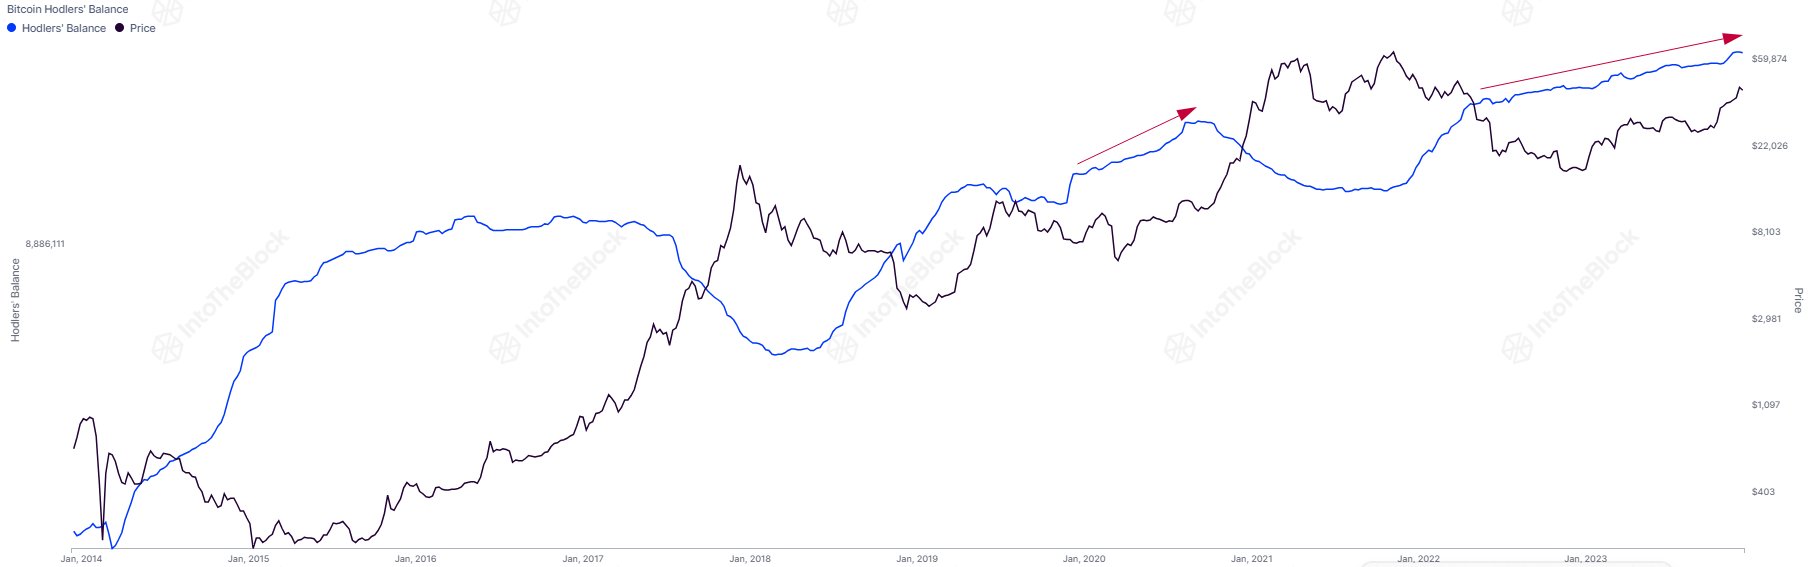
The Bitcoin supply is quickly moving off exchanges, and the HODLers getting hold of the majority of the supply has often been making the news recently. Still, there is another super exciting factor.

Bitcoin Shrimps And Fish

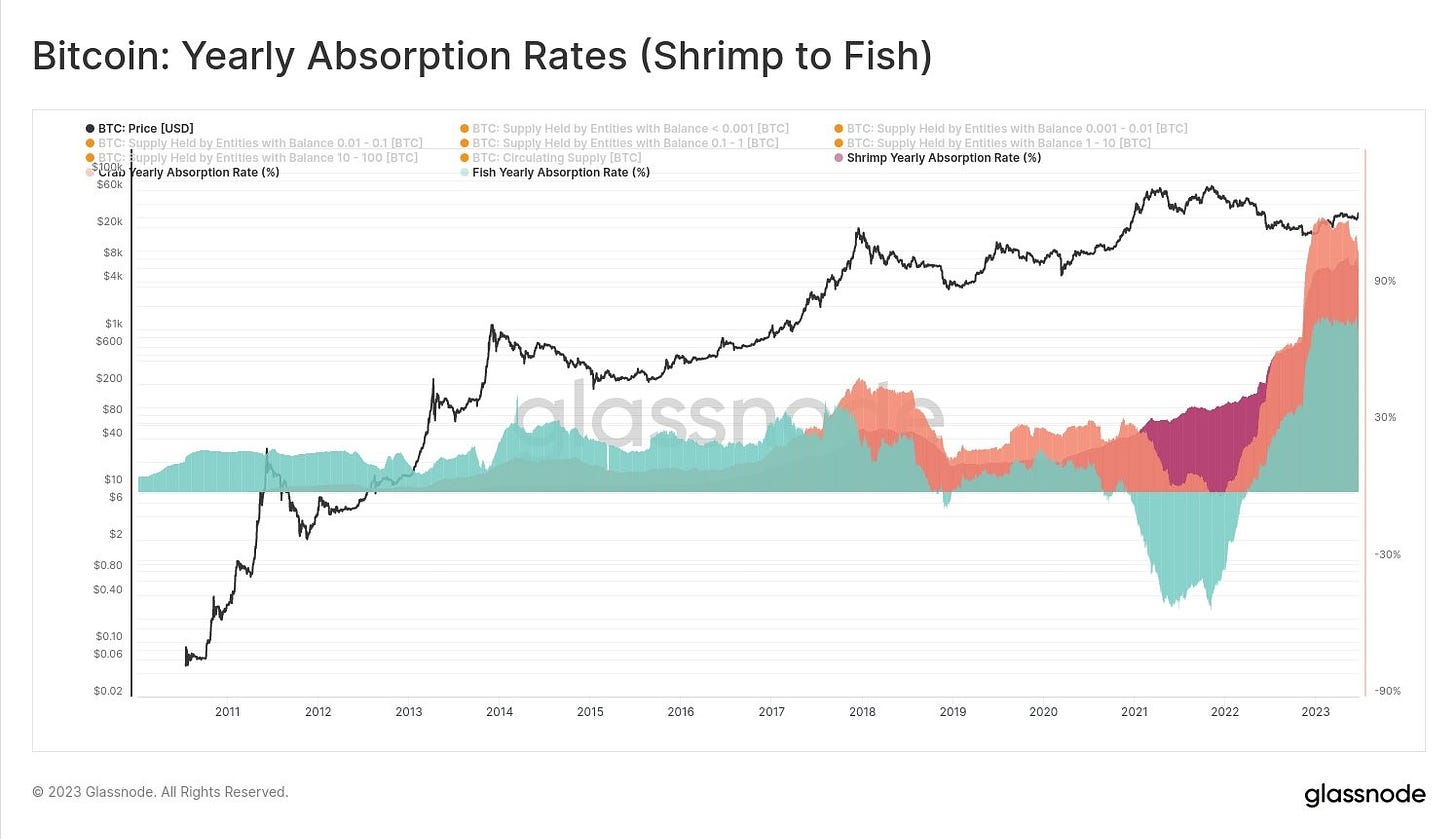
According to this chart from Glassnode, the relatively small entities on the network (holding less than 100 BTC) have been accumulating 275% of all Bitcoin being mined.

The fact that this rate is more than 100% suggests that the smaller investors are taking coins off the likes of whales. “This has never happened before. We have reached some kind of inflection point,” says Mjers.

Soon the halving will occur, and this supply shock brewing in the market will only get tighter. Perhaps the smaller investors are looking to get in before this happens.

Mjers mentions, however, that these individuals aren’t the only ones catching on; asset managers like Blackrock are also coming around and pushing to get themselves into the industry.

As mentioned before, the QT policy proved disastrous for BTC in this cycle, but a shift back towards QE may be imminent, which would naturally boost the market instead. The analyst thinks this event might coincide with the upcoming halving of the cryptocurrency.

Now, based on all these factors, these are probabilities that Mjers has assigned to the different price range predictions for the next cycle:

Bitcoin Predictions

The Stanford MBA believes that a growth of more than 8x, a multiplier higher than what the current cycle saw, is the second most probable scenario, given all the potentially positive developments.

A cycle outperforming the previous has never happened in the cryptocurrency’s history, so if this scenario happens, it would be a first.
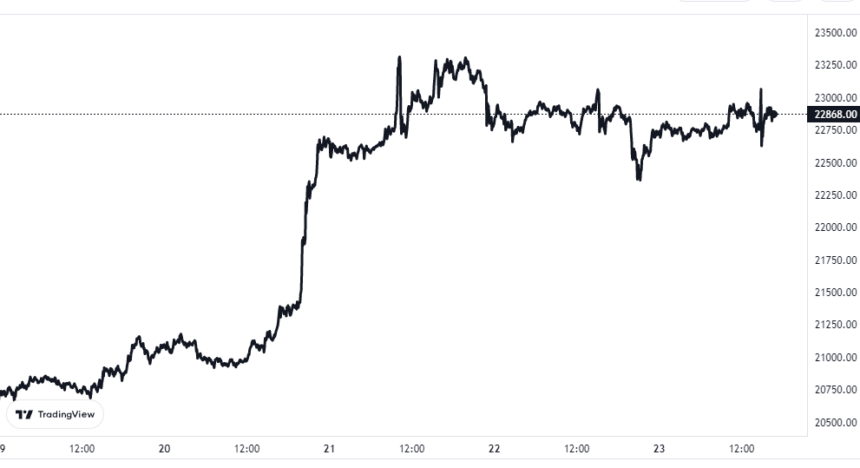
BTC Price

At the time of writing, Bitcoin is trading around $29,300, down 2% in the last week.

Bitcoin Price Chart

Bitcoin Puell Multiple Starts To Leave Bear Market Zone, Bull Rally Here?

On-chain data shows the annual rate of change in the Bitcoin Puell Multiple has exited the bear market zone, a sign that a bull rally may be here.

Bitcoin Puell Multiple 365-Day Rate Of Change Has Shot Up

As pointed out by an analyst in a CryptoQuant post, this could be one of the first indications of the return of the bull market. The “Puell Multiple” is an indicator that measures the ratio between the daily Bitcoin mining revenue (in USD) and the 365-day moving average (MA) of the same.

When the value of this metric is greater than 1, miners are making more income than the yearly average right now. On the other hand, values below the threshold imply the revenues of these chain validators is less than usual.

As miner revenues shift, these holders become more or less likely to sell BTC (depending on which way of the break-even mark the ratio has swung in), which is a factor that can affect the price of the crypto. Thus, when the Puell Multiple is greater than 1, BTC may be considered overvalued, while being lesser than this value might suggest the coin is undervalued.

The relevant indicator here is not the Puell Multiple itself but its rate of change (RoC). The RoC displays the speed at which any metric changes its value over a defined period.

In particular, the 365-day RoC of the Puell Multiple is of interest in the current discussion. Here is a chart that shows the trend in this indicator over the course of the different Bitcoin cycles:

Bitcoin Puell Multiple

In the above graph, the quant has marked the relevant zones for the Bitcoin Puell Multiple 365-day RoC. It seems like tops have taken place in the crypto price whenever the metric has touched the red line, while mid-cycle highs have been set around the orange line.

And it would appear that bear markets have lasted while the indicator has been around the green line. It also looks like transitions to and from bear markets have generally followed the dotted line historically.

Recently, as Bitcoin has sharply rallied, miner revenues have also shot up, leading to the Puell Multiple also observing a rise. As the chart displays, the 365-day RoC of the indicator has naturally seen some rapid rise in recent days.

With this spike, the metric has finally crossed above the dotted line, which could mean, if the past pattern is anything to go by, that the bear market may be coming to an end, and the crypto might have started transitioning towards a bullish trend. The analyst notes, however, that it will still take some more price action before this breakout can be fully confirmed.

BTC Price

At the time of writing, Bitcoin is trading around $22,800, up 9% in the last week.

Bitcoin Price Chart

Bitcoin Weekend Run Breaches $20,000 Mark, Dominates The Altcoins

Even if the cryptocurrency industry crashed in 2022, Bitcoin’s status as the “alpha coin” has remained remarkably stable. With a market capitalization of over $398 billion and a trading volume of $24,180,295, Bitcoin’s dominance in the last 24 hours has increased by 43%.

According to market watchers, the BTC bull market officially began in 2023 and is expected to increase in value. In addition, the United States Consumer Price Index (CPI) was issued earlier this week, showing that the U.S. dollar’s value is decreasing relative to other currencies. On the other hand, the CPI data gave the market the confidence it needed to follow inflation’s downward trend.

In the previous week, BTC dominance increased by almost 2%, returning to a multi-month high as the value breached the $20,000 level.

Bitcoin Shows Bullish Momentum

Rekt Capital says that BTC will surprise investors next week by trading above $21,000. This upswing encouraged traders and investors worldwide to re-enter the Bitcoin market and make some quick bucks.

After BTC officially surpassed $17,000 at the beginning of this week, the outlook for the asset has been more bullish than it was at the end of 2022.

On Friday evening, the price of BTC surged beyond $18,000, then $19,000, and finally pumped to $20,000. The next hours saw a rise initiated by the bulls, which ultimately pushed BTC up to near $21,000 on Sunday.

At this price, bitcoin has made up all of its ground since the FTX-Alameda Research meltdown more than two months ago. Even if it has dropped from its local peak, the price is still well above $20,000. The cryptocurrency’s market valuation is close to $400 billion, with many investors hoping for a new bull run to begin any day.

Fundstrat’s head of digital asset strategy Sean Farrell stated to Bloomberg:

Cryptoassets performed well following the soft CPI print, suggesting that crypto’s correlation to macro is not going away anytime soon

As Bitcoin Surges, Altcoins Retreat

On yesterday’s daily charts, most altcoins showed gains, but those figures are now negative. After increasing by more than 35% in a day and nearly 70% in a week, it has turned bullish and is now moving in that direction. However, it is currently sitting below that level due to the daily decline of 4.5%.

The top 10 daily cryptocurrencies that lost value are Dogecoin (DOGE), Polkadot (DOT), Litecoin (LTC), Shiba Inu (SHIB), Avalanche (AVAX), Cardano (ADA), and Polygon (MATIC).

The value of alternative cryptocurrencies like ADA and DOGE have dropped, by 0.34% and 0.08%, respectively, from their respective 24-hour highs. The value of ADA and BNB has decreased marginally over the previous day. Both coins, however, have seen substantial gains during the past week, rising by more than 21% and 11%, respectively.

Featured image from Unsplash.com, charts from TradingView.com

Bitcoin MPI Rises To Highest Value Since March 2021, Bull Rally Soon?

On-chain data suggests the Bitcoin MPI indicator has observed a rise recently, now reaching the same values as March 2021. Past pattern may hint that a bull rally could follow here.

Bitcoin MPI Seems To Be Catching Some Uptrend After Months Of Inactivity

As explained by an analyst in a CryptoQuant post, the BTC MPI metric’s current trend may suggest that a bull rally could occur soon, if historical pattern is anything to go by.

The “Miners’ Position Index” (or the MPI in short) is an indicator that’s defined as the ratio of the number of all Bitcoin miners’ outflows divided by the 365-day moving average of the same.

In simpler terms, what this metric tells us is how the miner selling behavior is right now compared to the average over the past year.

When the value of this indicator rises, it means miners are selling more BTC recently. On the other hand, the index’s value going down implies miners are turning less active as they are moving around a lower amount of coins.

Related Reading | Buying Bitcoin Might Be Good Call For The Young, Legendary Trader Peter Brandt Says

Now, here is a chart that shows the trend in the BTC MPI over the past few years:

Looks like the value of the indicator has been on the rise recently | Source: CryptoQuant

As you can see in the above graph, the quant has marked three important regions of trend for the Bitcoin MPI since 2018.

It looks like, in each of these regions the index made a U-shaped curve where the metric’s value fell as the bull period ended and rose as a new rally approached.

Related Reading | Bitcoin On Course To Hit $100K Nine Months From Now, Bitbull CEO Predicts

For many months now, the BTC MPI has been in the middle (bear) region of such a curve. But now, it looks like the indicator’s value is catching an uptrend again, and has now reached the same values as observed back in March of last year.

If the historical pattern will hold true this time as well, then the current trend formation may be leading towards the start of a new bull rally.

BTC Price

At the time of writing, Bitcoin’s price floats around $38.8k, up 0.5% in the last seven days. Over the past month, the crypto has lost 8% in value.

The below chart shows the trend in the price of the coin over the last five days.

BTC’s price seems to have been trending sideways over the last few days | Source: BTCUSD on TradingView

Since the sharp move up and down almost a week ago, there hasn’t been any significant volatility in the price of Bitcoin.

Featured image from Unsplash.com, charts from TradingView.com, CryptoQuant.com