When Will Bitcoin Downtrend End? This Signal Could Be One To Watch

An analyst has explained that a futures market signal could be one to wait for before the latest Bitcoin drawdown can finish.

Bitcoin Funding Rates Are Still In The Positive Territory

As pointed out by an analyst in a CryptoQuant Quicktake post, the BTC funding rate has been reducing recently, but it’s still at positive levels. The “funding rate” refers to an indicator that keeps track of the amount of periodic fee that futures contract holders are exchanging between each other currently.

When the value of this metric is positive, it means that the long traders are paying a premium to the short holders right now in order to hold onto their positions. Such a trend suggests that a bullish mentality is dominant in the futures market.

On the other hand, the indicator being negative implies a bearish sentiment may be shared by the majority of the traders as the shorts are outweighing the longs at the moment.

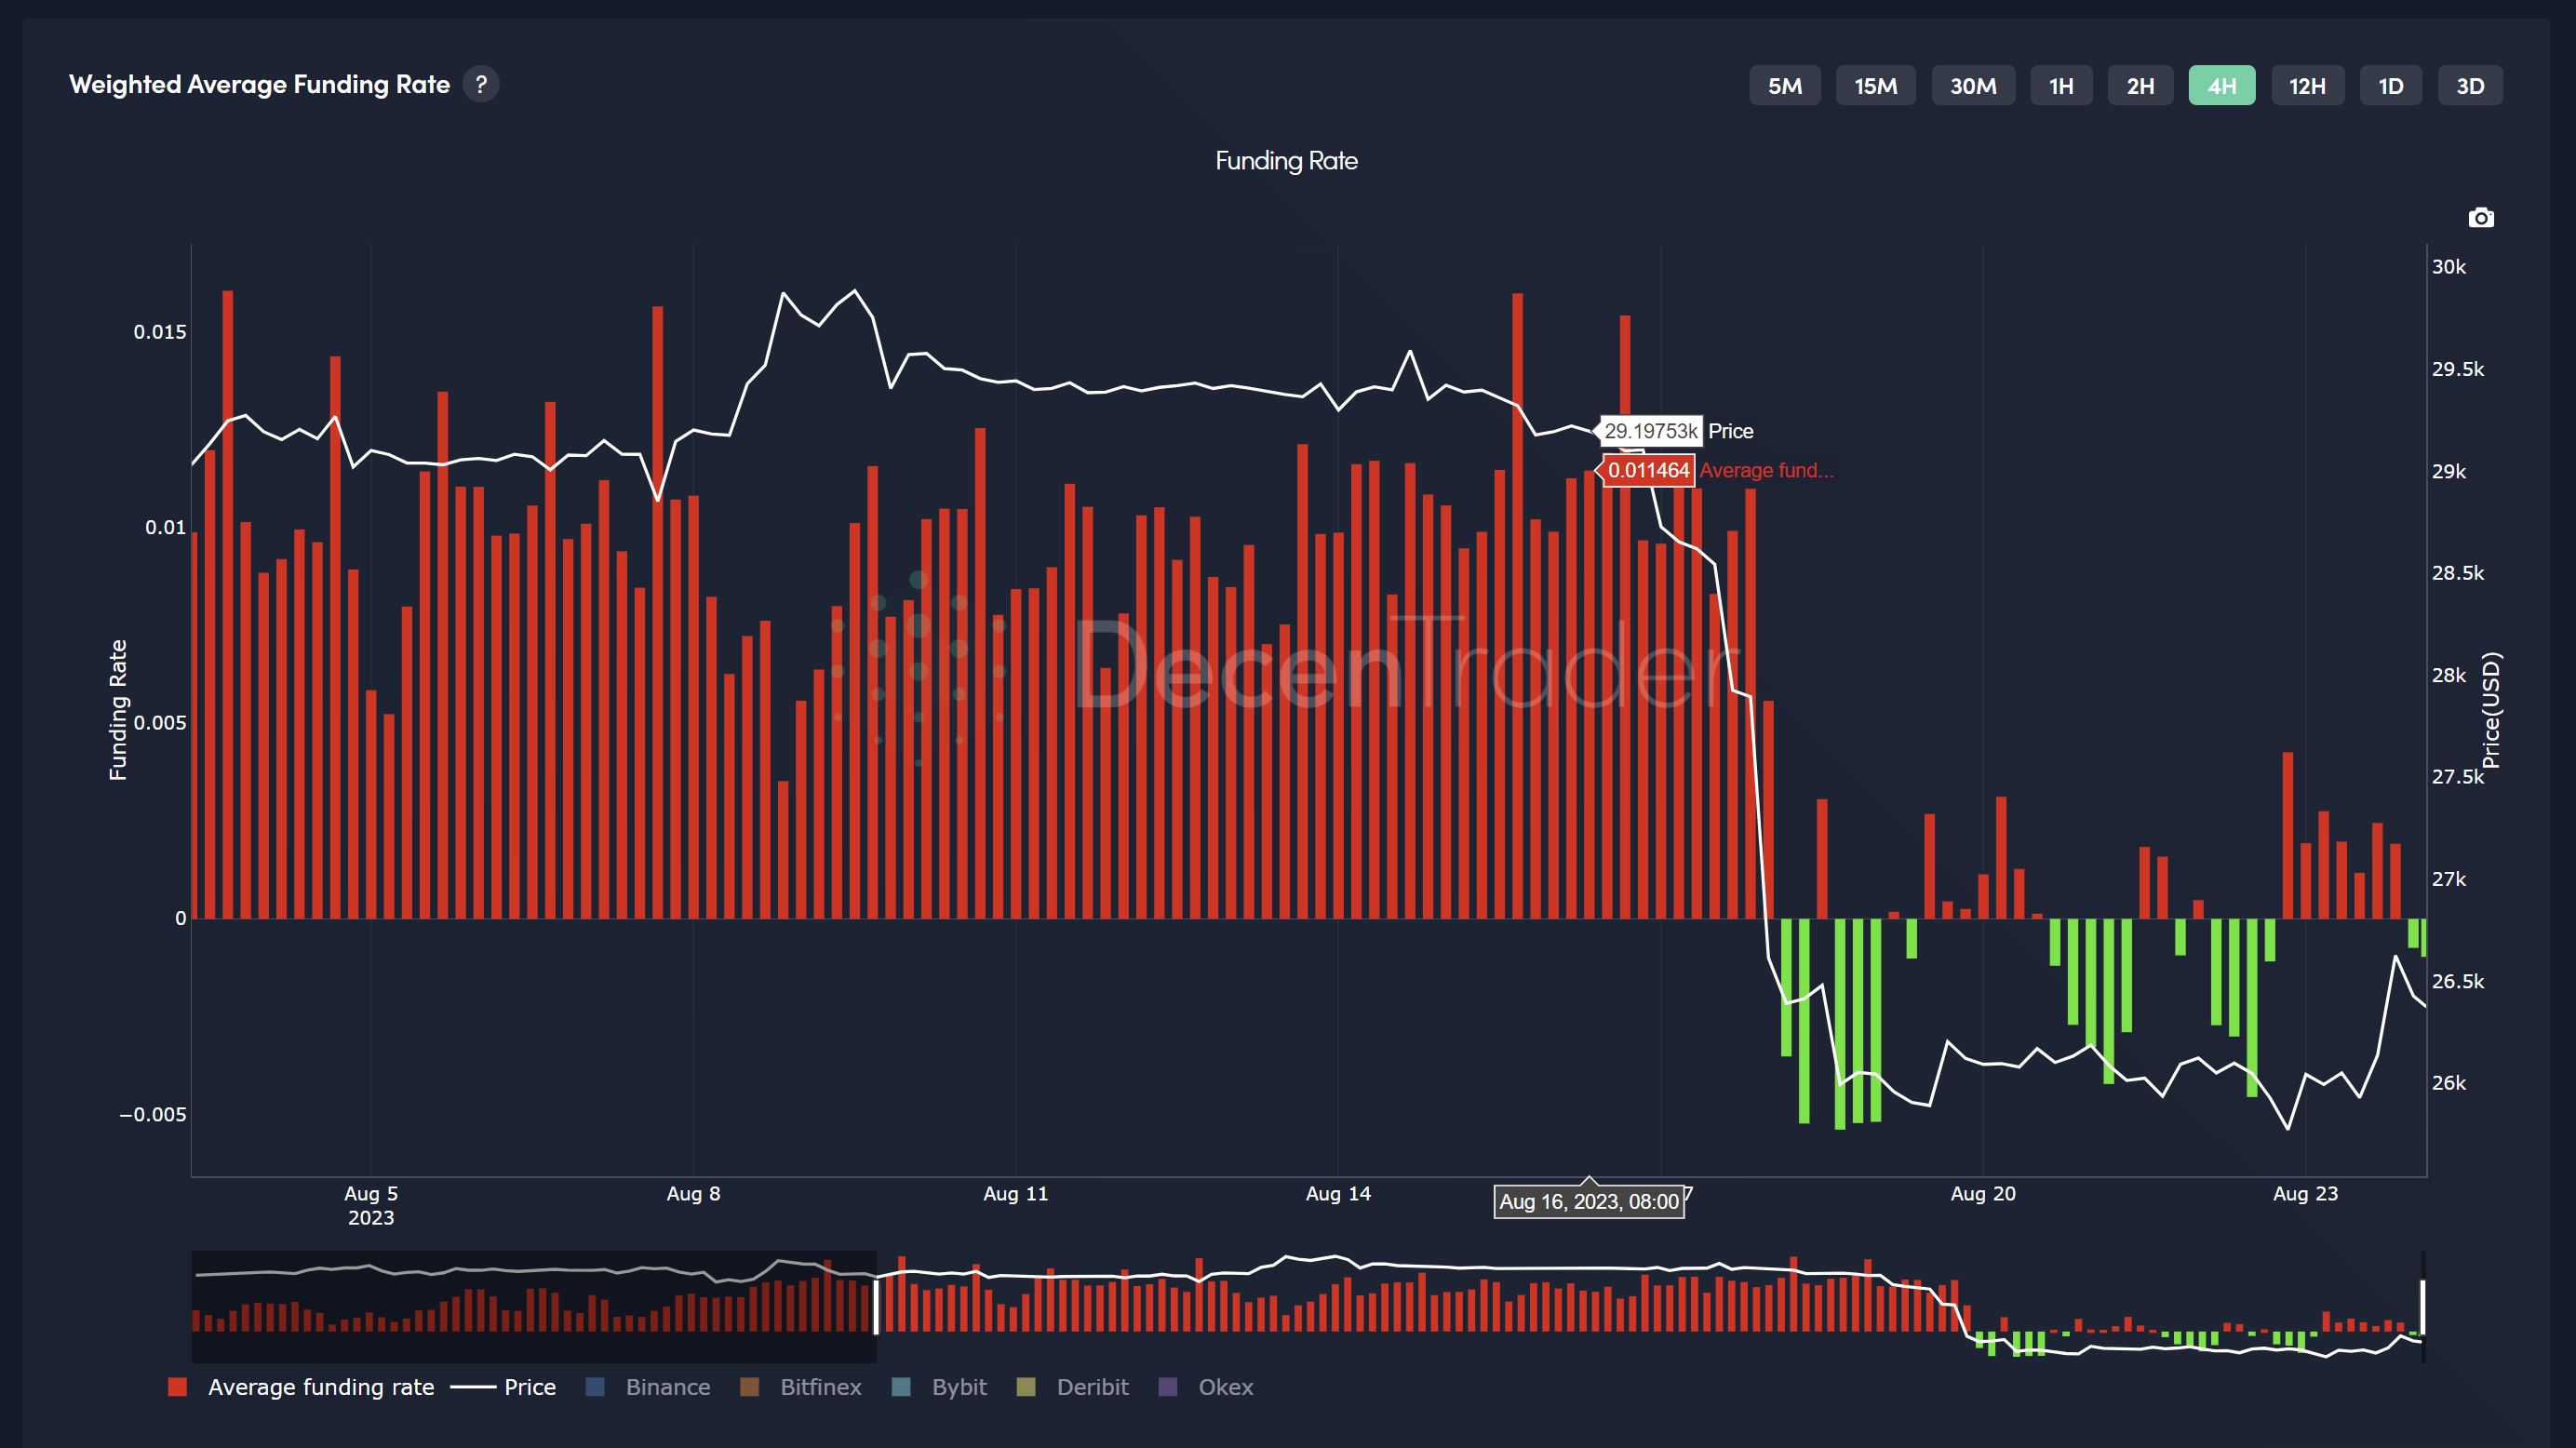
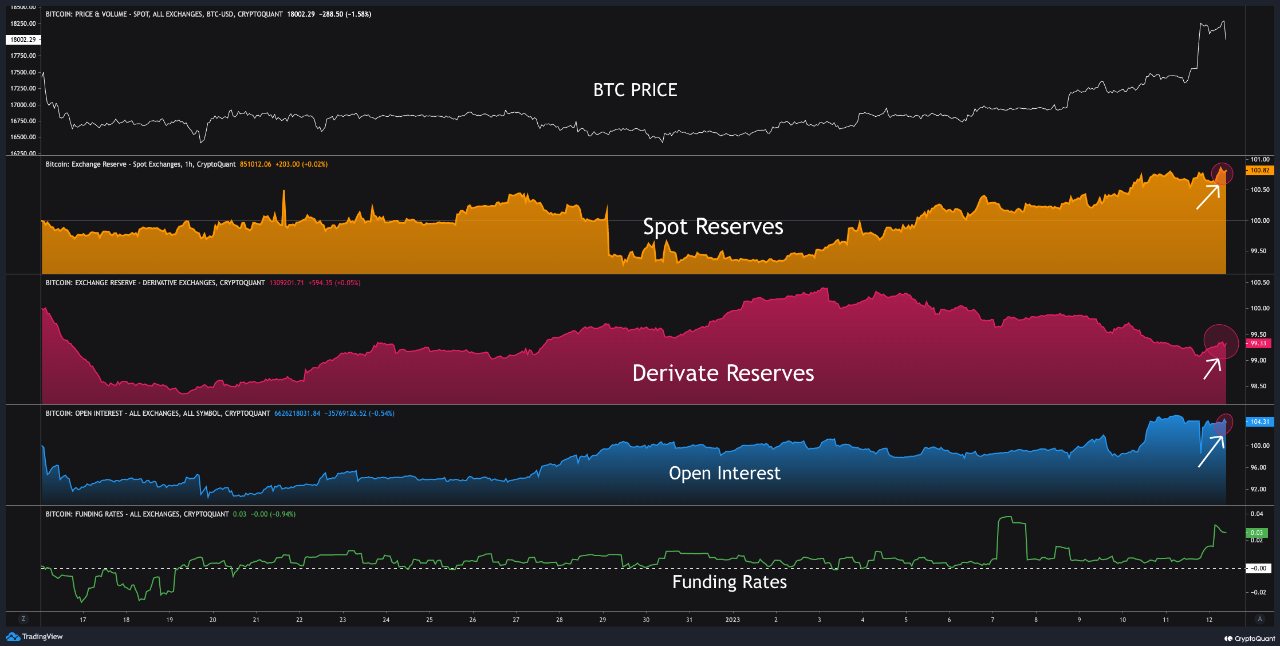
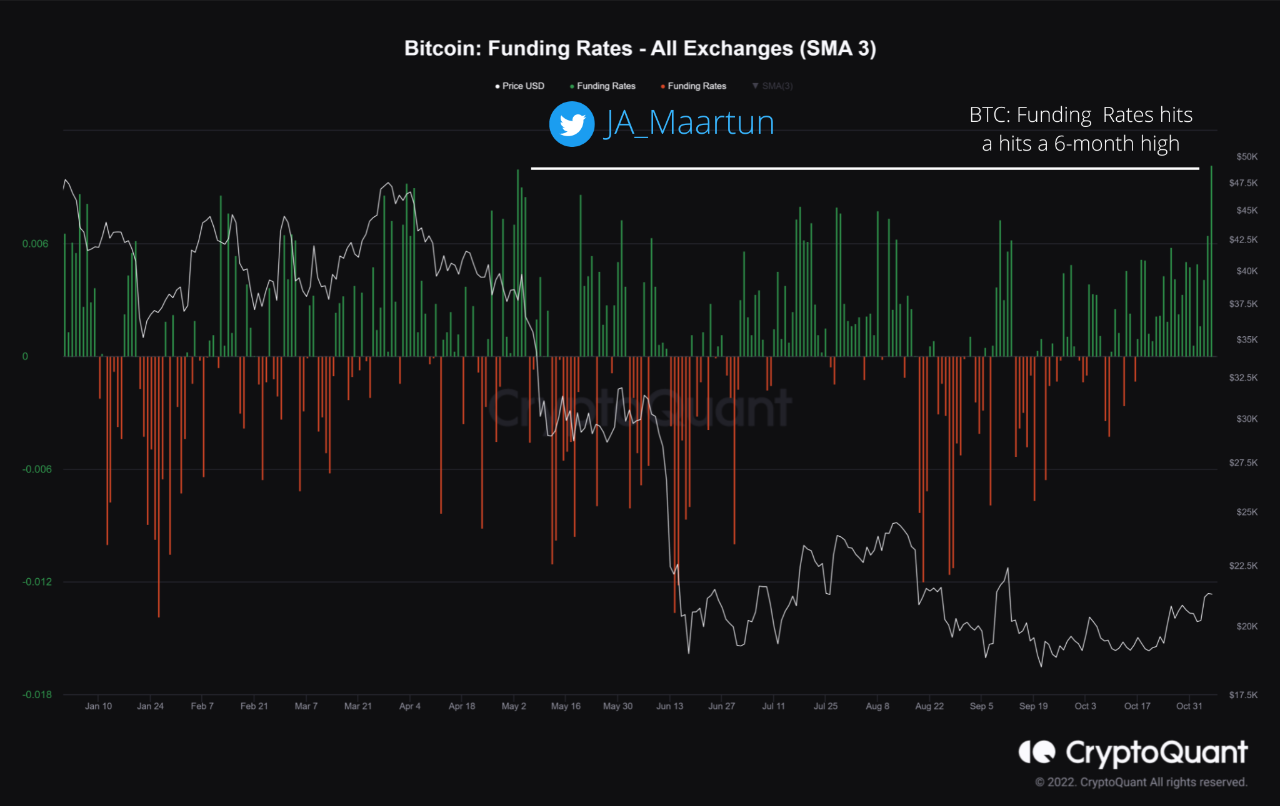
Now, here is a chart that shows the trend in the Bitcoin funding rate over the past year:

Bitcoin Funding Rates

As displayed in the above graph, the Bitcoin funding rate has been almost entirely positive since mid-October, suggesting that the longs have been the dominant force in the sector.

Around the start of the year, the metric’s value had hit especially high levels, but after all the volatile price action BTC has seen since then, the indicator has considerably cooled off.

The funding rates have still been at positive levels recently, however, implying that traders haven’t given up on their bullish sentiment just yet. This may not entirely be ideal for the asset to rebound.

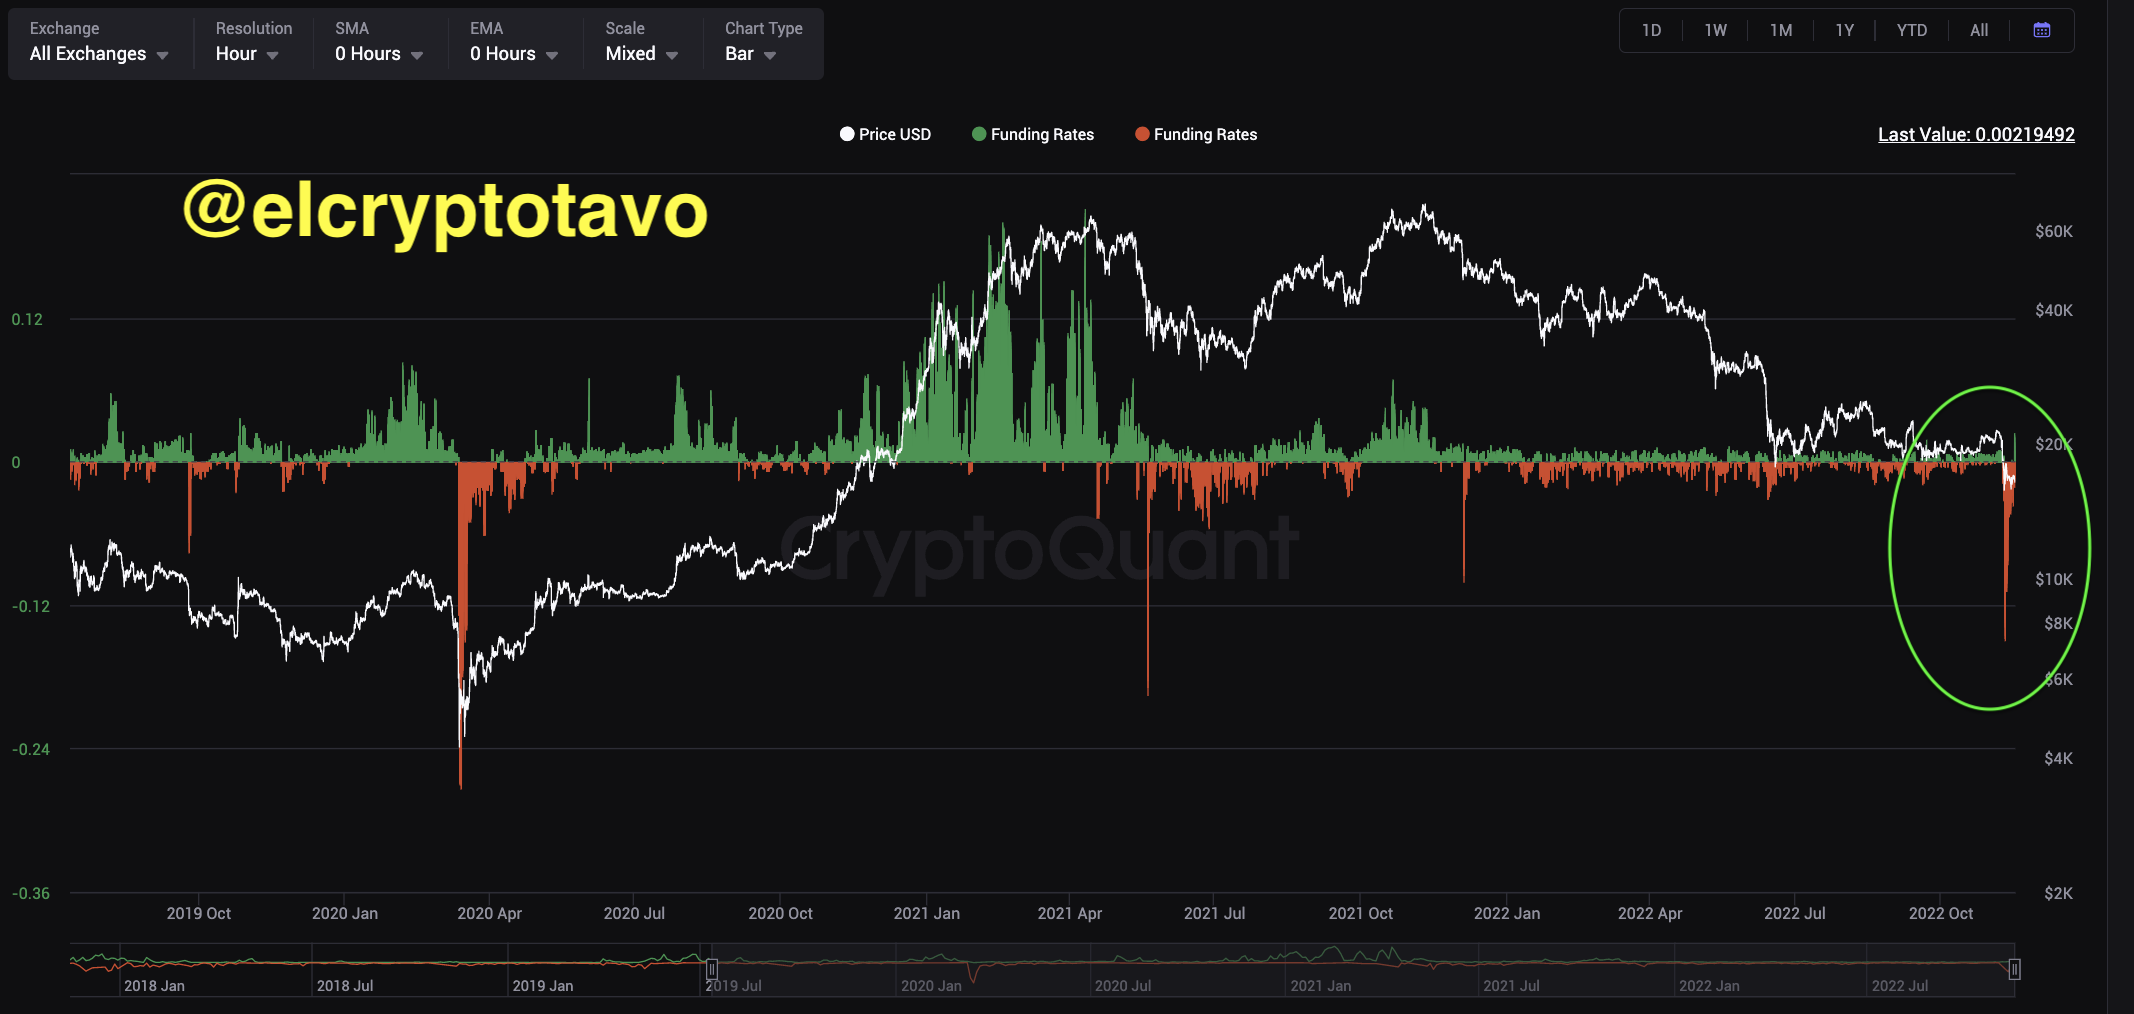
According to the quant, for the ongoing Bitcoin downtrend to end, “we need to wait for a capitulation signal from market participants.” In the chart, the analyst has highlighted the last few instances such a capitulation signal appeared for the cryptocurrency.

Such negative spikes for the funding rate imply that the traders have become overly pessimistic about the market. Historically, BTC has tended to move against the expectations of the majority, so it’s not surprising that bottoms have been more likely to form when the traders have been highly bearish about the asset.

Red spikes in the indicator like those shown in the chart may not always perfectly coincide with a low in the price, but they are still nonetheless a sign that tides could change for the coin.

At present, the Bitcoin funding rates are still at positive levels, so some more downtrend may need to occur in the price, before these longs are liquidated and the futures balance shifts towards the other side.

BTC Price

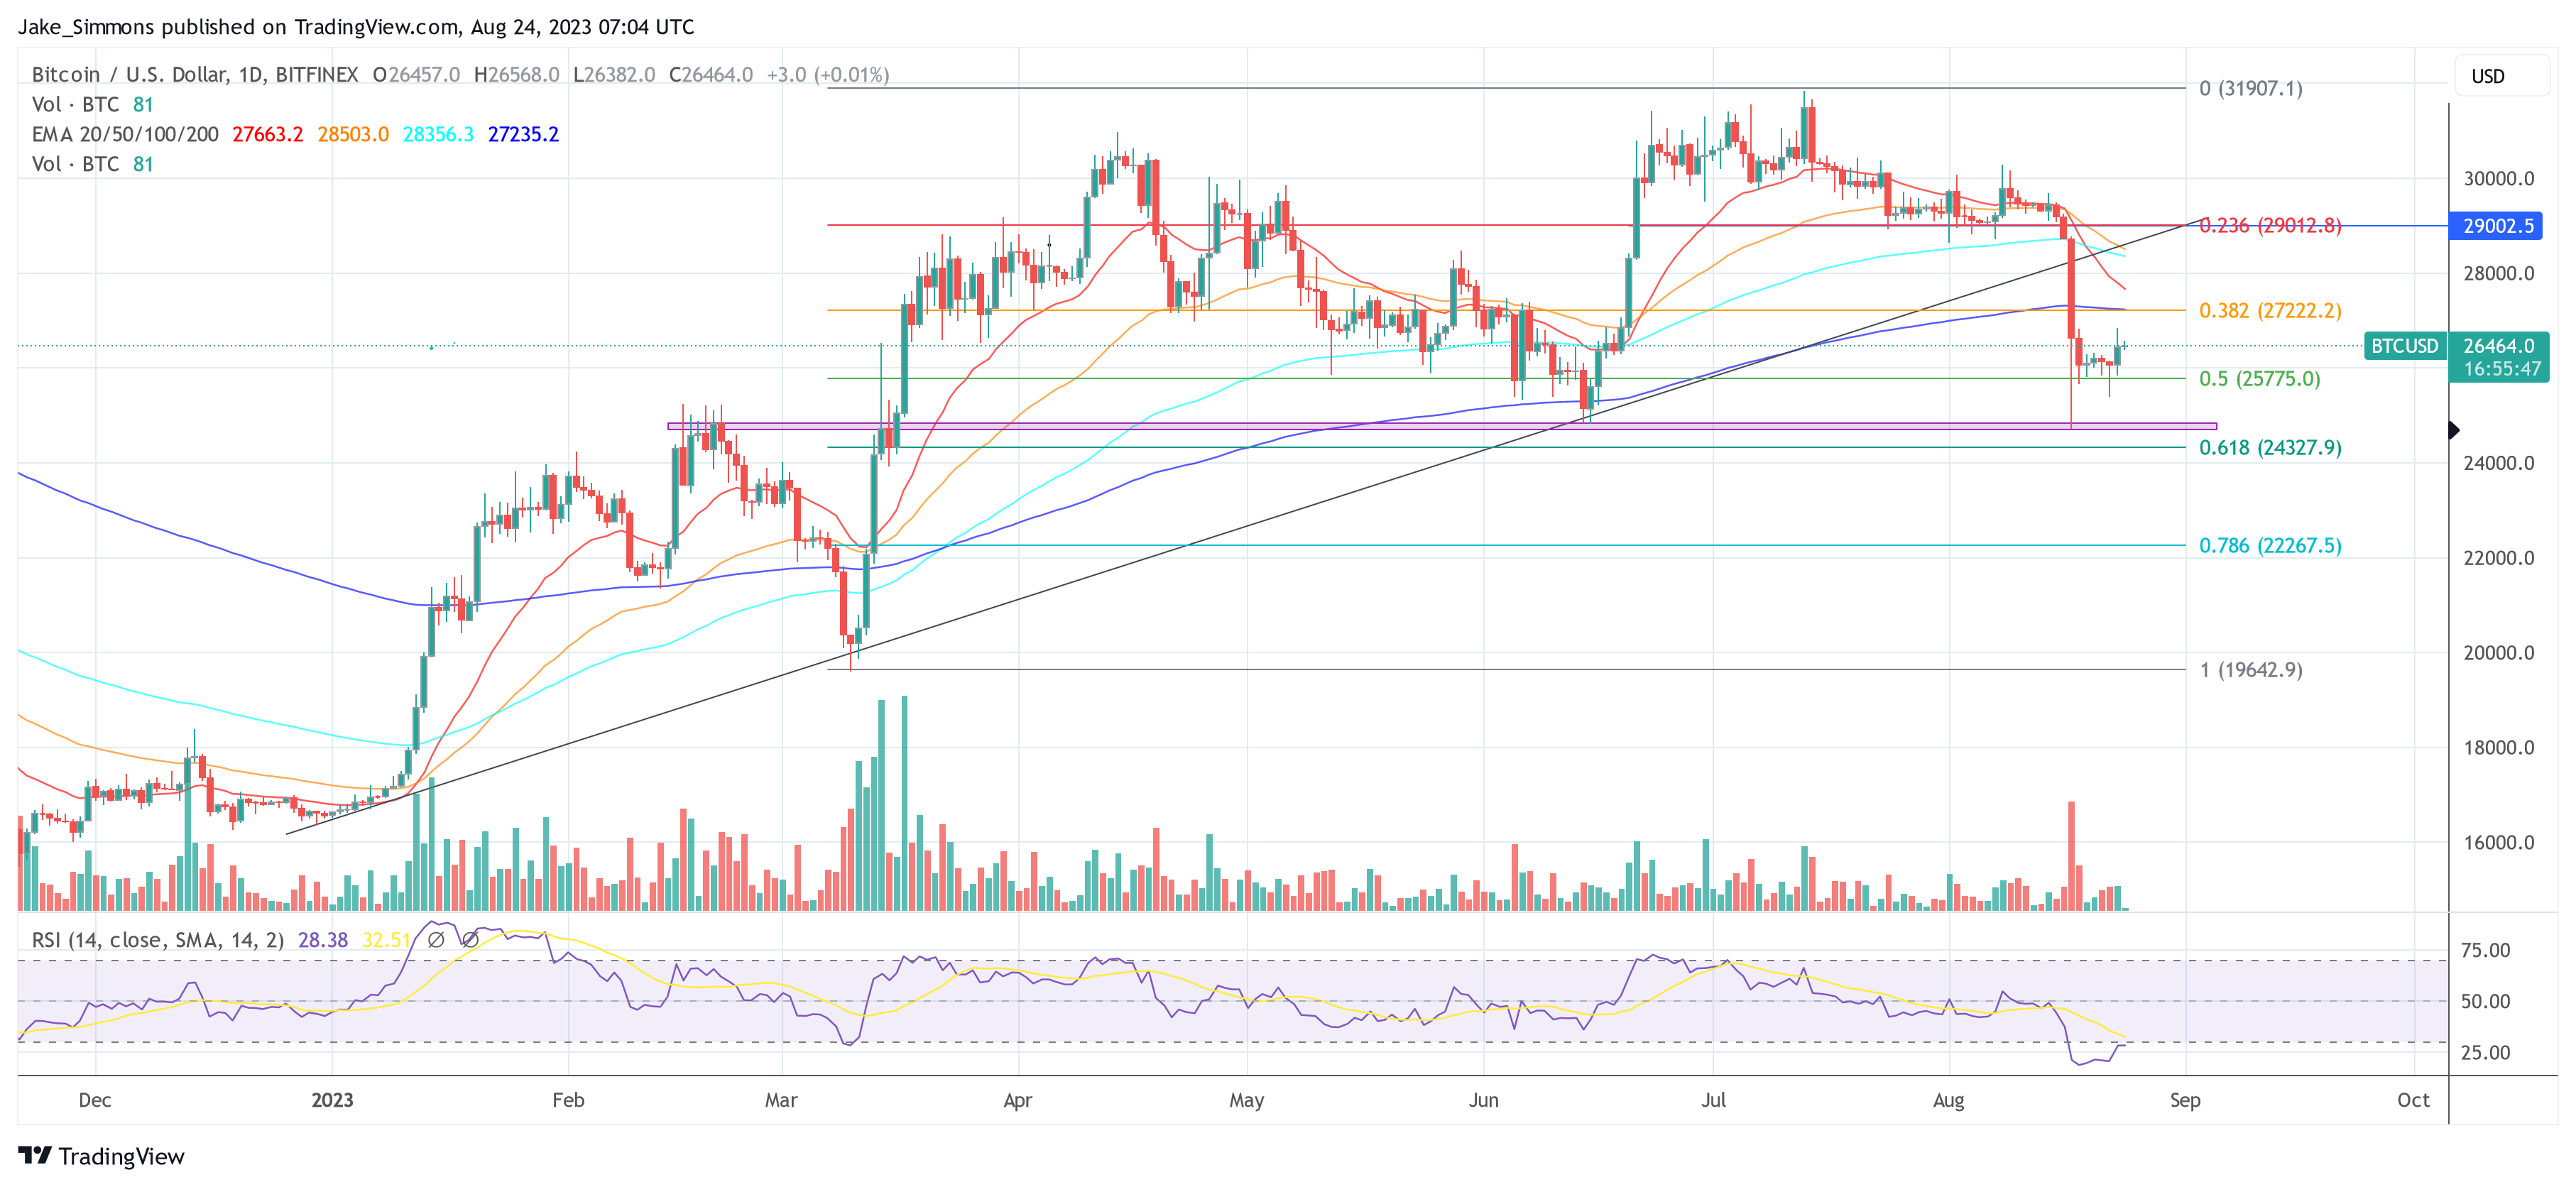
Bitcoin had plunged under the $39,000 mark just yesterday, but the coin appears to have bounced back today as it’s now once again floating above $40,000.

Bitcoin Price Chart

Are Bitcoin Derivatives Behind The Latest Rally? Glassnode Answers

Since the latest Bitcoin rally started, there has been speculation going on as to whether derivatives fuel the surge. Here’s what Glassnode says.

Bitcoin Funding Rates Have Remained Cool Recently

In its latest weekly report, the on-chain analytics firm Glassnode has talked about what the derivatives side of the market has looked like while the latest rally in the asset has occurred.

First, the report has looked into the open interest of the perpetual swap markets, where “open interest” refers to the total amount of Bitcoin contracts currently open. The metric has been measured in terms of BTC here so that the USD price fluctuations don’t affect the trend.

Bitcoin Open Interest

From the chart, it’s visible that the Bitcoin open interest saw two large liquidation squeezes back in January and August, with the former one being a short squeeze and the latter one being a long squeeze.

Since the latest rally started, BTC has observed two liquidation events: one of 25,000 BTC and the other of 33,000 BTC. This combined short squeeze is now of the same scale as the aforementioned mass liquidation events.

In terms of the USD values of the liquidation events, the latest squeeze is again comparable with the other ones this year:

Bitcoin Futures Liquidations

On the topic of liquidations, Glassnode reveals that, interestingly, the market has been dominated by long liquidations throughout the history of Bitcoin. There have only been a few phases where shorts have dominated the longs over 30 days.

The latest large short liquidations have resulted in the shorts just overtaking the longs, as the chart below shows.

Bitcoin Net Liquidation Volume

Curiously, it would appear that during the few periods that the short liquidations have dominated the market (highlighted in yellow), Bitcoin has observed a point of extreme in its price.

While the liquidation data would suggest that the derivatives have indeed played a role in driving the market through this latest rally, the funding rates could tell a different story.

Bitcoin Funding Rates

“Of note is that funding rates and cash-and-carry basis in futures markets have remained relatively calm all things considered,” explains Glassnode. “2023 has generally seen futures markets yield annualized rates over 6%, which are greater than US treasury rates.”

Back in August, however, the selloff cooled off these funding rates, and they have since remained relatively low. Even with the latest chaos in the market, the metric still hasn’t seen any significant uptick. The analytics firm notes that this could imply the Bitcoin rally is only partially driven by leveraged speculation.

BTC Price

At the time of writing, Bitcoin is trading at around $34,300, up 23% in the past week.

Bitcoin Price Chart

Why Is Bitcoin Price Up Today?

The Bitcoin price experienced a resurgence yesterday, reaching a high of $26,843, a 3.7% increase after its recent crash from $29,000. The reasons behind this uptick are manifold.

Why Is Bitcoin Up?

According to on-chain analytics firm Santiment, significant Bitcoin holders, often referred to as whales and sharks, have been actively adding to their holdings. As of now, there are 156,660 wallets holding between 10 to 10,000 BTC, with a collective accumulation of $308.6M since August 17th. Whale and shark wallets have added 11,629 BTC in the past six days.

Bitcoin whales buy the dip

Michaël van de Poppe, a well-regarded crypto analyst, drew attention to the strength shown by Silver & Gold, especially after the disappointing PMI rates yesterday. He believes that as yields appear to be topping out, Bitcoin might follow the trajectory of these commodities.

Recent economic indicators from the US private sector provide further context. The S&P Global Composite PMI for early August showed a decline, falling to 50.4 from 52 in July. Both the Manufacturing and Services PMI indices also registered drops from 49 to 47 and 52.4 to 51 respectively.

Moreover, the Bitcoin futures market certainly played a certain role in yesterday’s Bitcoin price movement. Yesterday, $28.06 million in short positions were liquidated on this market. After all, this is the third largest amount in August so far, surpassed only by August 17 ($120 million) and August 8 ($37 million).

BTC Total Liquidations Chart

Market intelligence platform Decentrader highlighted the prevailing market sentiment, noting that despite Bitcoin’s price rise, there’s still a sense of uncertainty and fear. This sentiment is further underscored by the continuing negative dip in average funding rates. While this means that sentiment is still bad, it opens up the possibility for more short squeezes if traders are raging into shorts.

Weighted average funding rate

The Dollar-Index (DXY) and its inverse relationship with Bitcoin also played a part. DXY was rejected just below 104 yesterday and dropped back to 103.5. The SPX showed a nice relief bounce with USD coming off 103.96.

CryptoCon’s volume analysis offers a broader perspective on Bitcoin’s price movement. Since November 2020, the volume of Bitcoin transacted reveals why the price halted at its current position. The volume past $28,900 acts as a significant barrier. However, the current range of 24,000 to 29,000 for Bitcoin is relatively uncharted, suggesting that Bitcoin is searching for new support and preparing for a potential move to the next resistance zone.

Bitcoin volume profile

What’s Next For BTC?

The upcoming Jackson Hole Economic Symposium tomorrow, Friday, where the Federal Reserve will discuss its future strategies, is a pivotal event on the horizon. Keith Alan of Material Indicators recalled the impact of last year’s symposium on Bitcoin, emphasizing, “Remember when FED Chair Powell spoke from Jackson Hole last year and his hawkish tone triggered a 29% BTC dump?”

While there are parallels in Bitcoin’s price action leading up to this year’s event, it’s crucial to note that market reactions can be unpredictable and hinge on various factors. With the Bitcoin market poised for the events of tomorrow, the prevailing mood is one of anticipation mixed with caution.

At press time, BTC traded $26,464.

Bitcoin price

Bitcoin Funding Rates Most Positive Since Feb, Long Squeeze Soon?

Data shows that Bitcoin funding rates have risen to the greenest levels since February 2023, something that could increase the risk of a long squeeze.

Bitcoin Funding Rates Are At Highest Levels Since February

As pointed out by an analyst in a CryptoQuant post, longs have accumulated in the market recently. The “funding rates” is an indicator that keeps track of the periodic fee that traders on the futures market are exchanging between each other right now.

Related Reading: Bitcoin Addresses In Loss Soar To One-Month High Amid Mixed Market Indicators

When the value of this metric is positive, it means that the long contract holders are currently paying a premium to the short holders so that they can hold onto their positions. This kind of trend implies that the majority of the market shares a bullish sentiment.

On the other hand, the indicator being below the zero mark suggests the payments are flowing the opposite way: shorts are paying the longs. Naturally, here the bearish mentality is the dominant force.

Now, here is a chart that shows the trend in the Bitcoin funding rates since the start of the year:

Bitcoin Funding Rates

As displayed in the above graph, the Bitcoin funding rates have surged during the past day as the cryptocurrency’s price has recovered back above the $29,000 level.

The rise implies that new long positions have appeared on the market, and the gap between the shorts and longs has widened. Following this increase, the funding rates have hit highly positive levels not witnessed since back in February of this year.

When the metric hit its high values back then, the cryptocurrency’s price had formed a local top and had started on a steep decline. The reason that the market reversed its trend even though the futures market traders were bullish was perhaps due to a long squeeze.

A “squeeze” is an event where a sharp swing in the price sets off a high volume of liquidations at once. Such liquidations only end up providing further fuel for the price move, thus prolonging it and causing even more liquidations. As such, liquidations can be imagined to cascade during a squeeze.

Whenever the futures market becomes overheated, the chances of this mass liquidation event taking place can go up. Generally, a squeeze is more probable to effect the side that has the larger amount of contracts. Naturally, this side would be reflected in the funding rates.

As the indicator’s value is highly positive right now, a long squeeze could have reasonable chance of happening. If one does take place in the near future, then the Bitcoin market could go down in a similar way as it did back in February.

BTC Price

At the time of writing, Bitcoin is trading around $29,500, up 1% in the last week.

Bitcoin Price Chart

Bitcoin Funding Rates On BitMEX Turn Deep Red, Here’s Why This Is Bullish

Data shows the Bitcoin funding rates on the cryptocurrency exchange BitMEX have turned quite negative recently. Here’s why this may be bullish.

Bitcoin Funding Rates On BitMEX Have Plunged To Deep Red Values

As pointed out by an analyst in a CryptoQuant post, BTC felt a bullish boost the last time this pattern was observed. The “funding rate” is an indicator that measures the number of periodic fees that futures traders on a derivative exchange are currently exchanging between each other.

When the value of this metric is positive, it means the holders of long contracts are currently paying a premium to the short holders in order to keep their positions. Such a trend implies that the majority of the investors on the exchange hold a bullish sentiment right now.

On the other hand, negative values of the indicator suggest the shorts are overwhelming the longs at the moment. Naturally, this kind of trend is a sign of a bearish mentality being more dominant among the futures traders on the platform.

In the context of the current discussion, the relevant derivative exchange is BitMEX. Here is a chart that shows the trend in the Bitcoin funding rates for this platform over the last year and a half:

Bitcoin Funding Rates

As shown in the above graph, the Bitcoin funding rates on the BitMEX exchange have taken a plummet toward deep negative values recently. This means that a large number of short contracts are piling up on the platform in comparison to long contracts.

Generally, when the futures market becomes too unbalanced towards any one side, a sharp price move in the opposite direction to what the investors are heavily betting on becomes more probable.

This is because a mass liquidation event, called a “squeeze,” is generally more likely to take place towards the side that has more contracts open. In a squeeze, a swing in the price triggers a large amount of simultaneous liquidations and these liquidations only end up fueling said move further in return. A cascade of liquidations can then occur thanks to this amplified price move.

Since the funding rates on BitMEX are heavily lopsided towards the negative side right now, a short squeeze is a possibility in the near term. From the chart, it’s visible that the indicator displayed a similar trend just earlier in the year.

This negative spike in March occurred as Bitcoin’s price plunged below the $20,000 level, but these red values were only temporary, as a short squeeze took place not too long after and lead to BTC recovering in spectacular fashion.

The metric observed some even more negative values following the November 2022 FTX crash, but the price didn’t see any appreciable surge following them. Though, nonetheless, Bitcoin still saw the bottom coincide with the red BitMEX funding rates.

It now remains to be seen whether the pattern that was seen in March 2022 repeats this time as well, with BTC observing a short squeeze that reverses the current decline.

BTC Price

At the time of writing, Bitcoin is trading around $27,500, down 4% in the last week.

Bitcoin Price Chart

Bitcoin Funding Rates Hit 14-Month High – What Could This Mean For The Market Leader?

The crypto market has started the year 2023 with a remarkable, bullish run. Over the last few days, several assets have recorded significant profits and are starting to pull through the crypto winter.

Most notably, Bitcoin, the market leader and the world’s biggest digital asset, has been one of the top-performing coins this year. In the last seven days, BTC gained by more than 17%, allowing the coin to surpass the $20,000 price mark for the first time since the start of the FTX crisis.

Bitcoin’s impressive price rally has generated much excitement among the crypto community, along with a significant rise in the positive sentiment around the entire crypto market. However, it appears there might be a need for alertness among investors in the coming days. 

Bitcoin Records Highest Funding Rates In Over A Year 

According to a post by Maartun, a top analyst on the crypto analytics platform Crypto Quant, Bitcoin funding rates have attained their highest values in 14 months. The Crypto Quant contributor further stated that the occurrence of high funding rates such as these usually resulted in Bitcoin experiencing a price pullback. 

Funding rates are recurring payments made to either traders in a long or short position, depending on the difference between perpetual contract markets and spot prices.

In essence, these payments serve as a method of maintaining the price of perpetual contracts close to the spot price of an asset – in this case, Bitcoin.

That said, when there are highly positive funding rates on crypto exchanges, it indicates that traders are betting on the BTC/USD market to attain higher prices and are paying to go really long on BTC. 

Trading positions such as these can be quite risky, as any slight price drop might lead to high levels of liquidation or force these traders to close their positions. 

Therefore, these funding rates are definitely something that all BTC investors should keep their eyes on in the coming days. For now, Bitcoin is holding its ground, having gained by 1.83% in the last 24 hours, according to data by CoinMarketCap.

At press time, the premier cryptocurrency is trading at $20,722.66, with a market cap value of $399.23 billion. 

bitcoin

BTC Trading at $20,716 | Source: BTCUSD Chart on Tradingview.com. 

What To Expect From Bitcoin In 2023?

According to the popular price prediction site, BitNation, Bitcoin could attain a peak price of $37,307.77 before the years run out. Their price forecast also states that BTC investors should expect an average price of $31,084.84. 

However, the team at Tradingbeasts are predicting a rather bearish Bitcoin market for 2023. According to their price projections, BTC is expected to record slight losses all through the year, closing its annual market with a maximum price of $18,339 and an average price of $14,671.

So far, Bitcoin has shown a strong performance in 2023, gaining by over 25% since the beginning of the year. No doubt, the premier cryptocurrency is one asset to look out for in 2023. 


Bitcoin Bearish Signal: Spot And Derivative Reserves Shoot Up

On-chain data shows the Bitcoin spot and derivative exchange reserves have both shot up recently, a sign that could be bearish for the price.

Bitcoin Spot And Derivative Reserves Register Growth

As pointed out by an analyst in a CryptoQuant post, the open interest and the funding rates are also heating up in the BTC market. The “exchange reserve” is an indicator that measures the total amount of Bitcoin that investors are depositing into wallets of centralized exchanges right now.

This metric has two versions; one is for the spot exchanges, while the other is for the derivative platforms. Usually, investors deposit to spot exchanges for selling purposes, so an increase in the reserves of these platforms can suggest selling pressure is rising in the market.

And as holders use derivative exchanges for opening positions on the futures market, a rise in this reserve can lead to higher volatility (the effect on the price can be in either direction).

Now, here is a chart that shows the trend in these Bitcoin exchange reserves over the last month:

Bitcoin Exchange Reserves

As displayed in the above graph, both the spot and derivative exchange reserves have increased in value recently, suggesting that investors have been making deposits to these platforms. The increased spot reserves suggest an elevated selling pressure in the market, while the derivative reserves imply an overheated futures sector.

The chart also includes data for two other metrics, the open interest, and the funding rates. The “open interest” is an indicator that measures the total amount of futures positions currently open on derivative exchanges. This metric takes into account both short and long contracts.

The graph shows that this metric has also trended up recently, further suggesting that the futures market is currently overheated. The other indicator, the “funding rates,” tells us whether there are more shorts or longs in the market.

The Bitcoin funding rates are favorable now, implying that the longs are overwhelming the shorts. Generally, whichever way this metric swing tells us which of these contract holders is more at risk of a liquidation squeeze.

So far, there hasn’t been any long squeeze in the market, but rather a short squeeze as the price has been able to keep up the momentum. There have been some high liquidations during the past day that may have helped calm the overheated futures market for now, but since there is increased selling pressure on the spot exchanges, BTC is still at risk for a short-term pullback.

BTC Price

At the time of writing, BTC is trading around $19,100, up 14% in the last week.

Bitcoin Price Chart

Bitcoin Reserve On Binance Sharply Rises, Whales Preparing For More Dumping?

On-chain data shows the Bitcoin reserve on Binance has been sharply going up in the last couple of days, something that could be a sign of dumping.

Bitcoin Reserve On The Crypto Exchange Binance Has Observed Sharp Growth In Recent Days

As pointed out by an analyst in a CryptoQuant post, the funding rates have been negative while these inflows have been made.

The “exchange reserve” is an indicator that measures the total amount of Bitcoin currently stored in the wallets of a centralized exchange (which, in this case, is Binance).

When the value of this metric goes up, it means investors are depositing their coins to the exchange right now. As investors could be depositing to such a platform for selling purposes, this kind of trend can have bearish impacts on the price of the crypto.

On the other hand, decreasing value of the reserve suggests coins are exiting the exchange currently. Such a trend, when sustained, can be a sign of accumulation from investors, and could thus be bullish for the BTC value.

Now, here is a chart that shows the trend in the Bitcoin exchange reserve for the crypto exchange Binance during the past month:

Bitcoin Exchange Reserve Binance

The value of the metric seems to have been riding an upwards momentum in recent days | Source: CryptoQuant

As you can see in the above graph, the Binance Bitcoin exchange reserve started to rapidly fall down around ten days ago as the crash started.

This happened because the collapse of FTX made investors more wary of crypto exchanges than ever before, and so they were withdrawing coins off centralized platforms in hordes.

After seeing a final sharp plunge a little less than a week ago, the indicator started moving sideways. In the past couple of days, however, this trend has changed.

The Binance Bitcoin exchange reserves are now climbing back up quickly, suggesting that investors have been depositing large amounts.

This could be a sign of activity from whales, and would imply that these humongous holders may be preparing to dump.

The quant has also talked about another indicator’s trend, the “Funding Rate,” which tells us whether the futures market is leaning towards shorts or longs right now. The below chart displays the trend in this metric.

Bitcoin Funding Rates

Looks like the metric has a red value currently | Source: CryptoQuant

The funding rates are highly negative at the moment, implying the majority of the contracts are shorts. Based on this the analyst thinks a short squeeze could possibly take place, which would propel the price in the short term.

However, the quant also believes that’s when the whales would potentially make their move, and dump the crypto.

BTC Price

At the time of writing, Bitcoin’s price floats around $16.5k, down 6% in the last week.

Bitcoin Price Chart

BTC continues to consolidate | Source: BTCUSD on TradingView
Featured image from Rémi Boudousquié on Unsplash.com, charts from TradingView.com, CryptoQuant.com

Bitcoin Funding Rates At 6-Month High, Long Squeeze Alert?

On-chain data shows the Bitcoin funding rates have now hit a 6-month high, something that could lead to a long squeeze in the market.

Bitcoin Funding Rates Currently Have A Highly Positive Value

As pointed out by an analyst in a CryptoQuant post, BTC funding rates have surged up to the highest for the last six months.

The “funding rate” is an indicator that measures the periodic fee that traders in the Bitcoin futures market have to pay each other.

When the value of this metric is greater than zero, it means long traders are paying shorts to hold onto their positions right now. Such a trend shows a bullish sentiment is more dominant in the market currently.

On the other hand, the funding rate being positive suggests there are more shorts in the market at the moment as they are paying a fee to the longs.

Now, here is a chart that shows the trend in the Bitcoin funding rates over the year 2022 so far:

Bitcoin Funding Rates

The value of the metric seems to have spiked up over the past day | Source: CryptoQuant

As you can see in the above graph, the Bitcoin funding rate is positive right now, and has been on the rise in recent days.

During the past day, the indicator has hit its highest value for the last six months, suggesting there are a large amount of longs open in the futures market right now.

The last time such high values of the metric were observed was back in May, shortly after which the price of the crypto crashed from nearly $40k all the way down to $30k.

A “long squeeze” took place in the market then. A squeeze is an event where a large amount of rapid liquidations take place in an overleveraged environment.

In a long squeeze, a sharp swing downwards in the price (when funding rates are positive) liquidates a large number of long contracts, which only amplifies this downswing further.

This amplified plunge then liquidates even more contracts, and so on. In this way, liquidations can cascade together and make the price take a sharp plummet.

As the Bitcoin funding rates are at high positive values currently, a long squeeze is a possibility, given that the price observes a sharp enough decrease.

BTC Price

At the time of writing, Bitcoin’s price floats around $20.7k, up 1% in the last week.

Bitcoin Price Chart

Looks like the value of the crypto has taken a hit during the last 24 hours | Source: BTCUSD on TradingView
Featured image from Kanchanara on Unsplash.com, charts from TradingView.com, CryptoQuant.com

Bitcoin Leverage Ratio Hits New ATH, Market In For A Rough Ride?

On-chain data shows the Bitcoin leverage ratio has surged up to a new all-time high, suggesting the market could be heading towards high volatility.

Bitcoin All Exchanges Estimated Leverage Ratio Sets New ATH

As pointed out by a CryptoQuant post, the funding rate has remained neutral while the leverage has increased in the market.

The “all exchanges estimated leverage ratio” is an indicator that measures the ratio between the Bitcoin open interest and the derivative exchange reserve.

What this metric tells us is the average amount of leverage currently being used by investors in the BTC futures market.

When the value of this indicator is high, it means users are taking a lot of leverage right now. Historically, such values have led to higher volatility in the price of the crypto.

On the other hand, the value of the metric being low suggests investors aren’t taking high risk at the moment, as they haven’t used much leverage.

Now, here is a chart that shows the trend in the Bitcoin leverage ratio over the last few years:

Looks like the value of the metric has been rising up during the last few months | Source: CryptoQuant

As you can see in the above graph, the Bitcoin estimated leverage ratio has shot up recently and has attained a new ATH. This means that investors are taking a high amount of leverage on average.

The reason overleveraged markets have usually turned highly volatile in the past lies in the fact that such conditions lead to mass liquidations becoming more probable.

Any sudden swings in the price during periods of high leverage can lead to a lot of contracts getting liquidated at once. But it doesn’t end there; these liquidations further amplify the price move that created them, and hence cause even more liquidations.

Liquidations cascading together in such a way is called a “squeeze.” Such events can involve either longs or shorts.

The Bitcoin funding rates (the periodic fee exchanged between long and short traders) can give us an idea about which direction a possible squeeze may go in.

CryptoQuant notes that this metric has a neutral value currently, implying the market is equally divided between shorts and longs. As such, it’s hard to say anything about the direction a possible squeeze in the near future might lean towards.

The Bitcoin volatility has in fact been very low in recent weeks, but with such high accumulation of leverage, it may be a matter of time before a volatile price takes over.

BTC Price

At the time of writing, Bitcoin’s price floats around $19.6k, up 2% in the past week.

The BTC value continues to trend sideways | Source: BTCUSD on TradingView
Featured image from Kanchanara on Unsplash.com, charts from TradingView.com, CryptoQuant.com

Bitcoin Open Interest, Funding Rates Point To Growing Bullish Sentiment

Bitcoin has seen fluctuating sentiment lately. With numerous dips and recoveries, it is no surprise that investors have had a hard time deciding on which side of the fence to sit on. However, while retail investors seem to be uncertain about the market, there has been some growth in both the funding rates and the open interest over the last week, showing that positive sentiment may be stabilizing.

Funding Rates Recover

Over the last couple of weeks, bitcoin funding rates have been consistently below neutral. This coincided with the times when the market was struggling, ushering in a new bear trend. But with the last week’s events, there has been a remarkable recovery in the funding rates.

Toward the end of last week, the funding rates had returned to neutral levels for the first time in one month. It followed the recovery in bitcoin’s price last Friday before it slid back down. The bitcoin funding rates have since lost their footing at the neutral territory but continue to maintain higher levels before the BTC recovery on Friday.

Funding rates return to neutral | Source: Arcane Research

What this shows is that there is still demand for both bitcoin longs and shorts. This means that while it does look to be swinging in the favor of the bulls due to the elevated levels, it is still an uncertain market. Additionally, last week’s recovery to neutral levels did not really change much about the current trend, as funding rates have now spent nine consecutive months at or below neutral levels.

Bitcoin Open Interest Say ‘Short Squeeze’

Despite the decline in the bitcoin price, the open interest has not had a hard time of it like the rest of the market. Instead, BTC-denominated open interest has hit multiple new all-time highs this year, leading to various short squeezes in the market.

Open interest continued to see favorable market conditions as it hit a new all-time high of 421,000 BTC last Wednesday. Even the short squeeze that was recorded on Friday did not do much to bring down the open interest, which remained elevated at 418,000 BTC at the start of this week. 

The depressed market sentiment suggests that this elevated trend is unlikely to continue for very long. Bitcoin’s price decline also points to this, given that the elevated open interest coincided with a period of price recovery. It also means that bears have been in control of the market for the period where the open interest has been high. Bitcoin’s fall below $20,000 is a testament that short traders continue to control the market. 

Featured image from PYMNTS, charts from Arcane Research and TradingView.com

Follow Best Owie on Twitter for market insights, updates, and the occasional funny tweet…

Bitcoin Open Interest Climbs Up, Price To Break Sideways Trend Soon?

On-chain data shows the Bitcoin open interest has been slowly growing recently, something that could lead to more volatility in the price of the crypto.

Bitcoin Open Interest Goes Up While Funding Rates Approach A Neutral Value

As pointed out by an analyst in a CryptoQuant post, the BTC open interest has gained around $500 million over the last few days.

The “open interest” is an indicator that measures the total amount of BTCUSD positions currently open on all derivatives exchanges. The metric takes into account for both short and long positions.

When the value of this indicator goes up, it means investors are opening up more positions on exchanges right now. Since this usually leads to a higher amount of leverage in the market, this kind of trend can make the price of Bitcoin more volatile.

On the other hand, the decline in the metric implies positions are closing up or liquidating on exchanges at the moment. Lower leverage usually leads to a more stable value of the crypto, and so such a trend can result in lesser volatility for BTC.

Now, here is a chart that shows the trend in the Bitcoin open interest over the last few days:

The value of the metric seems to have climbed up in recent days | Source: CryptoQuant

As you can see in the above graph, the Bitcoin open interest has observed an uplift during the past couple of days.

This increase amounted to around $500 million and took the indicator’s value from $8.15 billion to $8.66 billion.

The chart also includes data for the “funding rates,” a metric that tells us about the distribution of BTC positions between longs and shorts.

This indicator has most recently had a slightly negative value, which means the market is slightly leaning towards a short-dominant environment right now.

In times of high open interest (and hence high leverage), the market becomes more prone to seeing largescale liquidation events. Such liquidations are the reason behind the increased volatility of the market during such periods.

BTC has been mostly moving sideways during the last few days, but since the open interest has jumped up now, it’s possible the crypto could see fresh movement soon.

The funding rates can hint at which direction this new price volatility may favor, but since the metric’s value is almost neutral currently, it’s hard to say anything.

At the time of writing, Bitcoin’s price floats around $19.7k, down 1% in the past week.

BTC has continued to consolidate sideways during the past week or so | Source: BTCUSD on TradingView
Featured image from Kanchanara on Unsplash.com, charts from TradingView.com, CryptoQuant.com

Bitcoin Marks 9th Consecutive Month Of Sluggish Funding Rates

Bitcoin funding rates for the past two months have entered one of their worst streaks yet. During this time, there have been no positive funding rates, and the best that the market has seen has been funding rates at a neutral level. However, even now, reaching neutral levels have proved incredibly hard for funding rates, taking a deeper dive with each passing week.

Funding Rates Remain Below Neutral

The last time bitcoin funding rates had been in the neutral territory had been at the beginning of August. Since then, funding rates have consistently returned below neutral, with some short-term lows being recorded along the way. Funding rates on crypto exchange Binance have actually dropped to 2-month lows at this point. Additionally, the crypto exchange has now hit nine months of funding rates at or below neutral levels.

This puts the perpetual swaps at a continuously lower rate compared to spot market prices. Bitcoin traders have since been reducing their risk exposure to the digital asset, and this has come as a culmination of such wariness.

Funding rates remain below neutral | Source: Arcane Research

It is the most bearish that the market has been since the bull market was triggered in 2020. This even comes despite the fact that bitcoin open interest has been seeing higher levels. On Tuesday, the bitcoin funding rates sat at around 0.00% and had touched a 2-month low earlier in the week.

Bitcoin Open Interest Grows

Bitcoin open interest has maintained a consistent growth rate despite the funding rates taking a nosedive at each possible point. Each week has seen open interest either hit a new all-time high or come close to reaching it. The former was the case last week.

BTC trading below $20,000 | Source: BTCUSD on TradingView.com

This time around, open interest had a brand new all-time high of 398,075 BTC on August 29th. This is more than 2% of the total BTC circulating supply. It is up significantly from its lowest point last year of 186,158 BTC, representing a more than 110% growth in this time.

With the open interest so high and funding rates so low, it leaves room for the possibility of a short squeeze. This unusual market has not been ignored by investors, leading them to take up more conservative positions.

Bitcoin’s price has also not been encouraging. After hitting a new local high of $25,000 about a week ago, the digital asset is now struggling to hold above $20,000.

Featured image from RushRadar, charts from Arcane Research and TradingView.com

Follow Best Owie on Twitter for market insights, updates, and the occasional funny tweet…

Bitcoin Funding Rates Turn Positive, Why The Rally May Not Be Over

Bitcoin funding rates had fallen below neutral two weeks ago after finally recovering from a month-long downtrend. This had sparked fears of another bearish trend starting in the market. However, this has quickly changed as the numbers for last week have come in. This time around, the bitcoin funding rates are painting a better picture for the digital asset.

Funding Rates Return To Neutral

The bitcoin funding rates for the last week have been more optimistic compared to previous weeks. This is because it had continued to maintain its positive at neutral for the whole seven days; there was not a single point in the week that funding rates had actually fallen below neutral. This is the first time since March that the funding rates have consistently remained above the negative level for a while week.

A recovery in funding rates is always a welcome change for the market, this is why last week’s day remains important. With a market such as this, where bitcoin continues to struggle to comfortably break above $23,000, there needs to be a significant change in not only sentiment but in the amount of money being injected into the space.

BTC funding rates return to neutral | Source: Arcane Research

With funding rates recovering to neutral, it once more puts it on a path towards becoming neutral, something that has eluded bitcoin for most of the year so far. The trend, which had started in June, has now reached an acceptable point, but the end game remains for finding rates to turn positive if bitcoin is to continue on a bull rally.

BTC trading below $23,000 | Source: BTCUSD on TradingView.com
Will Bitcoin Recover?

Bitcoin is still trending at $22,800, which has surprisingly become a support level for the digital asset. This level continues to hold tentatively but needs a big push to rise out of this level. With funding rates recovering, perp traders may likely provide that needed push.

Related Reading: Why Bitcoin Investors Should Pay Attention To The Macro Environment

As for the leverage in the bitcoin market, it remains elevated. This means that more traders are opening positions in the digital asset. But it also puts them in a precarious position in a situation where liquidations could pile up quickly, especially with a move below $22,000.

Nonetheless, the bull indicators remain strong, albeit a bit weaker compared to last week. The resistance at $23,000 is not as strong as bears would like, which puts the next major resistance well above $23,500. If bitcoin can beat the 50-day moving average once more, then it is likely to surge above $24,000 once more.

Featured image from The Economic Times, charts from Arcane Reseach and TradingView.com

Follow Best Owie on Twitter for market insights, updates, and the occasional funny tweet…

Elevated Bitcoin Open Interest Levels Puts Market In Vulnerable Position

Bitcoin has recovered above $23,000 multiple times now, but the digital asset remains in a perilous position. This is because the recovery alone has not been able to assure that the bull trend would endure. Rather, it has been falling the brief buying and selling pressures that have been plaguing investors in recent times. The bitcoin open interest also mirrors this fact and shows just how easy it would be for bitcoin to lose its position.

Bitcoin Open Interest Stays Elevated

For the past week, the bitcoin open interest has been on the rise. After hitting above 300k the previous week, there was no stopping this part of the market. However, it also pointed to more peculiarities about the current bitcoin uptrend.

Related Reading | Why Cardano (ADA) May Breakout In A Bull Run To $1

For one, the elevated bitcoin-denominated open interest shows that there is very high leverage in the crypto market. As with any market, having such high leverage always puts the value of the digital asset in a perilous position. It could swing either way resulting in a short squeeze or a long squeeze. Whatever the case may end up being, the results are often the same; there are significant price swings that would go in either direction.

BTC recovers above $23,000 | Source: BTCUSD on TradingView.com

With the current movement of bitcoin, it is more likely that a long squeeze would be the end of it. This would likely see the price drop back down and touch $20,000. But if the off chance that it does end in a short squeeze, then bitcoin’s price could very well revisit $25,000.

Funding Rates Fall

Last week, the market had seen some much-needed bullish sentiment on the part of perpetual traders when the funding rates had recovered to neutral levels. Given that the funding rates had spent weeks swinging below neutral, this was a welcome change, however briefly.

It would seem the positive recovery would only last a single week as bitcoin funding rates have begun to swing back into the negative. It shows a straight decline down from neutral, indicating that traders were returning to more careful trades.

Funding rates fall below neutral | Source: Arcane Research

Interestingly, though, is the fact that despite the decline in the funding rates, they still continue to maintain higher lows. It shows better prospects compared to the month of June, which was characterized by funding rates remaining perpetually below neutral.

Related Reading | Bullish Sentiment Spills Over To Institutional Investors As Ethereum Inflows Balloons

What this shows is that although bitcoin traders are being more careful, they have not entirely written off the digital asset. This improvement in market sentiment has shone through in bitcoin’s recent recovery. However, for this to continue, funding rates would need a reversal from here.

Featured image from GoBankingRates, charts from Arcane Research and TradingView.com

Follow Best Owie on Twitter for market insights, updates, and the occasional funny tweet…

Funding Rates Return To Neutral Following Bitcoin Relief Rally

Bitcoin funding rates had seen a very negative month between mid-June and mid-July. The funding rates, which had previously remained muted, quickly declined below neutral and proceeded to spend the next one month on this level. However, there is a significant change as last week saw funding rates return to neutral.

Funding Rate Recovers On Exchanges

The bitcoin funding rates had been touching low points as the price of the digital asset struggled. This was concerning given that funding rates were expected to improve as the digital asset began to basically trade at what was described as a “discount.” This would not be farther from the truth, as funding rates fell to their lowest points this June. It indicated that perp traders were still bearish on the cryptocurrency and refrained from moving in.

Related Reading | Bitcoin Dominance Dives As Ethereum Takes Up More Space

Last week would come with good news as funding rates returned to neutral and stayed there. Binance and Bybit crypto exchanges both recorded funding rate levels of 0.01%. The return to neutral came as the price of bitcoin started a relief rally that saw it break above $23,000.

Funding rates return to neutral | Source: Arcane Research 

Open interest had also followed the same route, although it retraced during the week when the price fell once more. It showed that there is still a lot of leveraging going on in the market since the bitcoin open interest was not much different from what was recorded the prior week, even with the decline.

Bitcoin Traders Turning Bullish

The recovery of bitcoin funding rates to a neutral level is a testament to the returning positive sentiment among traders and investors. It definitely does not signal that the market has returned to its previously bullish phase, but it is an indication that investors are now looking favorably at the bitcoin and crypto market at large.

BTC retraces downwards | Source: BTCUSD on TradingView.com

It tracks along with the Fear & Greed index which has now moved out of the ‘Extreme Fear’ territory for the first time in almost three months. It saw an incredible bounce from last week’s sentiment, with a score of 18 putting it in extreme fear. Although the market is still fearful, the recovery is seeing faith return to the market. It is also evidenced in the buying pressure that has been building this week. 

Related Reading | Domino Effect On Stablecoins Leads To Reversal Of Growth Trend

The correlation of the funding rates with the price of bitcoin can either be good or bad from here on out, depending on how well the cryptocurrency performs in the market. If it continues its recovery trend, then funding rates may return above neutral for the first time in more than two months.

Featured image from CNBC, charts from Arcane Research and TradingView.com

Follow Best Owie on Twitter for market insights, updates, and the occasional funny tweet…

Bitcoin Marks One Month Of Negative Funding Rates, More Decline Incoming?

Bitcoin funding rates had first fallen below the neutral level last month. Before that, the funding rates had been fluctuating at and below neutral for the longest time. This new trend has lasted longer than expected as the digital asset’s price continues to struggle. In this report, we take a look at the state of bitcoin funding rates as well as the implications if the present trend continues.

Funding Rates Below Neutral

When bitcoin funding rates had first fallen below neutral in June, the price of the digital asset was still trading well above $30,000. Since then though, multiple crashes and dips have seen the cryptocurrency lose more than $10,000 of its value and continue to struggle to hold above its previous cycle peak.

Related Reading | Mid Cap Crypto Coins Lead In July, Best Way To Weather The Winter?

However, despite the minor upward corrections that have been recorded since then, the funding rates have refused to budge. At the time of this writing, the funding rates have now spent a complete month with below neutral numbers.

Binance and Bybit are some of the most prominent platforms when it comes to calculating funding rates and the last time the crypto exchanges had seen funding rates in the neutral level since bitcoin’s fall from $30,000 had been in mid-June. Instead, the funding rates have begun to mirror the movement of price and have not recovered since then. 

Funding rates remain below neutral | Source: Arcane Research

This comes despite a surge in the bitcoin open interest last week which reached a new all-time high. So the funding rates have deviated from the open interest and are now following the low yield rates that are being recorded in the market. 

Will Bitcoin Recover?

With bitcoin’s price above $20,000 once more, there has been some positive sentiment returning to the market. However, it remains shaky given that there is not a lot of support left at this point and the price can easily be pulled down by the bears.

This is why the decline in the bitcoin funding rates remains a concern. Naturally, the funding rates are expected to see an increase when the price of the digital asset has declined as much as it has. But the opposite has been the case so far, meaning that there is not a lot of new money coming into the space, if any.

BTC recovers just below $21,000 | Source: BTCUSD on TradingView.com

For a prominent recovery in bitcoin’s price, an uptick in funding rates would need to be seen. When sentiment picks up among perp traders, the broader market is sure to follow. 

Related Reading | Bitcoin Price Spends Four Weeks At 2017 Peak Prices, What Comes Next?

Additionally, the inflation rate from the CPI report on Wednesday was higher than expected. While that has resulted in a spike in the price of bitcoin, it has been a short one. For this to hold, the market needs to see more buying momentum.

Featured image from CNBC, charts from Arcane Research and TradingView.com

Follow Best Owie on Twitter for market insights, updates, and the occasional funny tweet…

Bitcoin Funding Rates Are Climbing As Price Continues To Struggle

Bitcoin has been struggling over the last couple of weeks and funding rates have responded in different ways to the price. Instead of a rise in funding rates when the price had begun to plummet, they had stayed muted and had even begun to decline, especially during the past week. However, this is changing as the price of the digital asset has begun to take a turn for the better.

Funding Rates Recover

Bitcoin funding rates declined to one of their lowest points last month and this had been when the price of the digital asset had been higher. At that point, long traders remained relaxed, opting to stay out of the market while the crash raged on. This has now changed given that long traders have begun to move into the market.

Related Reading | Altcoins Take The Lead As Bitcoin Struggles To Hold Above $20,000

Funding rates across Binance and Bybit crypto exchanges have been showing a good recovery trend over the last week. Although it remains below neutral, it is close to reclaiming this level. Bybit has seen its bitcoin perpetuals recover to 0.01% over the past weekend. Binance still remains in the negative territory but a total average of the two has returned an average of 0.003% in the perps market. 

It is obvious that long traders are now rousing from their slumber. This time around, it is with tremendous vigor as evidenced by the growth rate recorded over this time period, going from negative to positive so quickly.

Funding rates begin recovery | Source: Arcane Research

There is no telling if this recovery trend will continue in the new week or if this is just a one-off. However, if it turns out to be the former, then the current recovery in the price of bitcoin may not be a short-lived one after all.

Bitcoin Bouncing Back

After a gut-wrenching month of June, July has big better tidings for the digital asset. Now, it has not been as good as investors were hoping but bitcoin has been having better luck holding on to its $20,000 support level compared to a couple of weeks back.

Related Reading | SEC Still Against Spot-based Bitcoin ETFs. Is There A Light At The End Of The Tunnel?

This week, the digital asset has recovered a good chunk and has been close to testing the $21,000 resistance level once more. It still remains under key technical levels but the return in positive sentiment shows that there may be more recovery to come.

BTC continues recovery trend | Source: BTCUSD on TradingView.com

As bitcoin funding rates recover and long traders become more active, it will be no surprise if bitcoin were to test the $22,500. An unlikely level as of now but doable as long as the sell-off fatigue holds in the market.

Bitcoin is trading at $20,860 at the time of this writing. It remains the largest cryptocurrency with a market cap of $398 billion.

Featured image from Verve Times, charts from Arcane Research and TradingView.com

Follow Best Owie on Twitter for market insights, updates, and the occasional funny tweet…

Bitcoin Funding Rates Remain Negative But Open Interest Tells Another Story

Bitcoin funding rates have been dropping over the last couple of weeks. Even as the price of the digital asset had plummeted, causing some to call it being on ‘discount’, these funding rates have refused to move out of the negative territory. The past week has proven to be no different given that funding rates have exited the neutral territory entirely and remain low.

Funding Rates Refuse To Budge

Coming out of the last week has been a hard one for the crypto market. The bloodbath had sent the majority of the coins in the crypto market into the red and bitcoin had touched the $20,000 level for the first time since December 2020. Through this has come panic across investors and the funding rates have reflected this panic.

Related Reading | Exchange Inflows Ramp Up As Crypto Investors Clamor To Exit Market

The past week had come to a close with funding rates sitting well below neutral. This follows the trend for the 7-day period where the funding rate had trended below neutral each day. It sat at 0.013% as of Tuesday. Not the lowest point so far but it marked the second-lowest point for the month of June.

This decline in funding rates follows what Arcane Research refers to as an orderly sell-off in the derivatives markets. It is no surprise given the liquidation volumes that rocked the market on Monday and Tuesday, touching above $1 billion in a 24-hour period and setting a new daily liquidation event record.

Funding rates remain low | Source: Arcane Research

The research and analysis firm also notes that investors are approaching the market with caution. This is due to the “current market structure with increased contagion risks related to Celsius and the pressuring macro backdrop.” This caution comes as no surprise given that investor sentiment now resides in extreme fear, meaning there is no room for careless abandon in a market such as this.

Bitcoin Open Interest Turns The Other Way

Even with the funding rates low, other metrics are surprisingly not doing as bad. One of these is the bitcoin’s open interest in the perpetual markets. This metric remains high even though the price of bitcoin has plummeted close to 2017 highs.

Historically, BTC-denominated open interest has been known to decline in line with the market. This has not been the case with the most recent bitcoin crash. Instead of falling, open interest had hit multiple new all-time highs even as the sell-offs had continued. This suggests that some investors had believed that the bottom was in and tried to take advantage of it. But this was not the case.

Open interest on the rise | Source: Arcane Research

Nevertheless, open interest in perpetuals was at 298,500 BTC as of Tuesday. It is in stark contrast to the last major market crash that took place back in December, where open interest in perps had declined to 190,000 BTC as the price of the digital asset had fallen.

Related Reading | Bitcoin Crash Sends Institutional Investors Running For The Hills

This increase in open interest suggests that if the bitcoin bottom is not in already, then it may very well be reached soon. Although it is important to keep in mind that a metric like this on its own cannot give a full picture of when the bitcoin bottom will be reached.

BTC drops to $21,000 | Source: BTCUSD on TradingView.com
Featured image from Arabian Business, charts from Arcane Reseach and TradingView.com

Follow Best Owie on Twitter for market insights, updates, and the occasional funny tweet…

Bitcoin Decline Sees Funding Rates Plunge To Three-Month Lows

Bitcoin funding rates have taken a nosedive after massive sell-offs at the beginning of the week. Bitcoin had made a remarkable recovery coming out of a slow weekend but these sell-offs would quickly wipe off all of the gains made, and with it, the funding rates came crashing down. It led to one of the most brutal crashes in funding rates in recent history. This has seen it touch one of its lowest points since February.

Factors Behind Decline

The bitcoin funding rates had plummeted due to the sell-offs that were recorded on Monday night. Most notably had been the plunge in crypto exchange Bybit which had declined to its three-month low of -0.0378%. It represented one of the largest declines of all cryptocurrency exchanges, of which Binance’s levels had stopped at 0.01378%. This sent funding rates to February 2nd levels, although stopping at a higher low compared to the carnage witnessed on May 12th.

Related Reading | Bitcoin Miner Revenues Stay Low As Price Decline Continues

These negative funding rates persisted throughout the week before culminating in the June decline. Bybit and Binance have both seen negative rates due to the lagging on the perpetual spot markets. It shows a high correlation to the price of the digital asset which had fallen back below $31,000 on Monday night to land at $29,000.

BTC funding rates see sharp decline | Source: Arcane Research

Funding rates on the Binance exchange have now been at the neutral to negative levels for half a year now. This is a new record for the exchange after enjoying some of the best months in the year 2021. The funding rates overall have been in the neutral to below neutral levels for the better part of 2022 and this does not seem to be changing anytime soon.

Bitcoin Trend After Decline

The decline in the funding rates coincided with the decline in the price of the digital asset. Bitcoin which had been making steady gains had lost all of it on Monday and returned to the $29,000. However, this would not hold for long as the digital asset would start a reversal that would put it back above $30,000 by the end of Wednesday.

BTC settles above $30,000 | Source: BTCUSD on TradingView.com

This recovery is also credited to the fact that investors are returning back to BTC to seek safe haven. Altcoins had been the winners of the 2021 bull rallies but with the 2022 bear market had come massive losses and as such, investors had moved on to strong digital assets such as bitcoin. 

Related Reading | U.S. Macro Pressure Responsible For Entire Bitcoin Downtrend

With this, bitcoin is now trading above its 20-day moving average but continues to lie below its 50-day moving average. This indicates that bears still largely maintain their hold on the market but a turn in the tide may be coming if there is significant buy pressure in the market. 

Bitcoin is trading at $30,475 at the time of this writing. It is maintaining its recovery trend in the early hours of Thursday. However, with the opening of the U.S. trading hours, more sell-offs are expected, leading to a decline in price.

Featured image from PYMNTS, charts from Arcane Research and TradingView.com

Follow Best Owie on Twitter for market insights, updates, and the occasional funny tweet…