Perp Traders Remain Quiet As Bitcoin Struggles To Hold $30,000

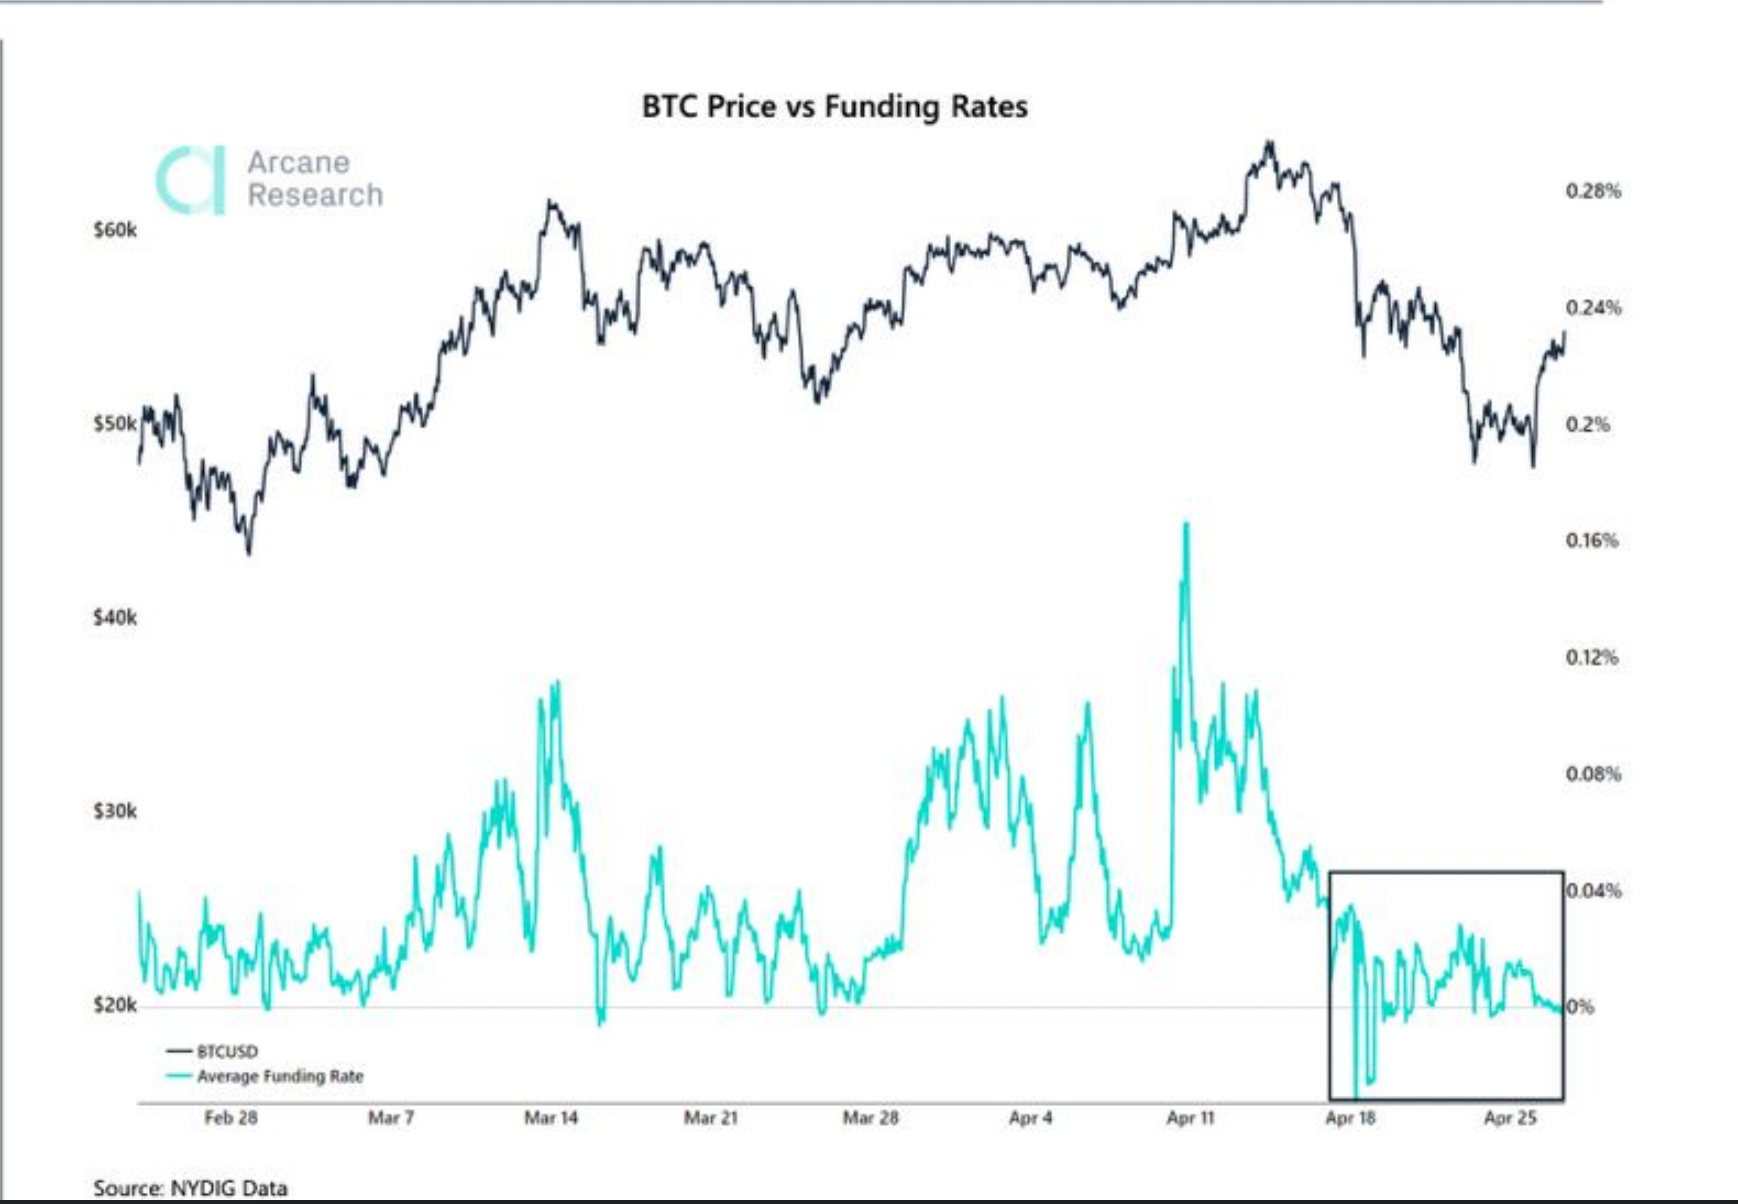
Bitcoin has been struggling to hold on to the $30,000 level for the better part of this week, failing more often than not. While there have been various reactions from different parts of the market such as the ETFs, perpetual traders seem to have taken this as a sign to hold off on their activities. What this has led to is a continuation of the neutral or below-neutral funding rates that have been recorded in the past couple of weeks.

Bitcoin Funding Rates Unmoved

For the past few months, bitcoin funding rates have been tethering around the neutral and below neutral levels. This has been the case through both market recoveries and downtrends, although there have been periods of slight deviations where funding rates have recovered into the positive but even these have been short-lived.

Related Reading | Institutional Investors Seek Safe Haven In Crypto Products Amid Market Uncertainty

The last time that the funding rate saw a sharp recovery had been May 12th on the Binance exchange, after which funding rates had once more returned to trending at the neutral and below neutral line. This is interesting given that open interest in perpetual had surged to new all-time highs during this time. 

Funding rates fall below neutral | Source: Arcane Research

The 21 bitcoin funding rate intervals on the Binance and Bybit exchanges have been dominated by below-neutral funding rates. A total of 16 funding rates have been neural while 5 have been neutral funding rates. All this while, the perps have continued to trade at a reasonable discount to the spot.

Leverage Still Surging

Even though bitcoin funding rates have been straggling, it has not affected the performance of open interest (OI). OI had declined significantly in the previous week but last week saw BTC denominated open interest retrace its steps and add 41,000 BTC. This brought the total denominated OI to touch new all-time highs of 290,000BTC, beating the previous May 4th high of 282,000 BTC. Just a week after open interest had dived more than 35,000 BTC.

Mostly, the surge in open interest has followed the times when the funding rates have been below neutral. At times where funding rates have been neutral or above neutral, open interest has usually been down.

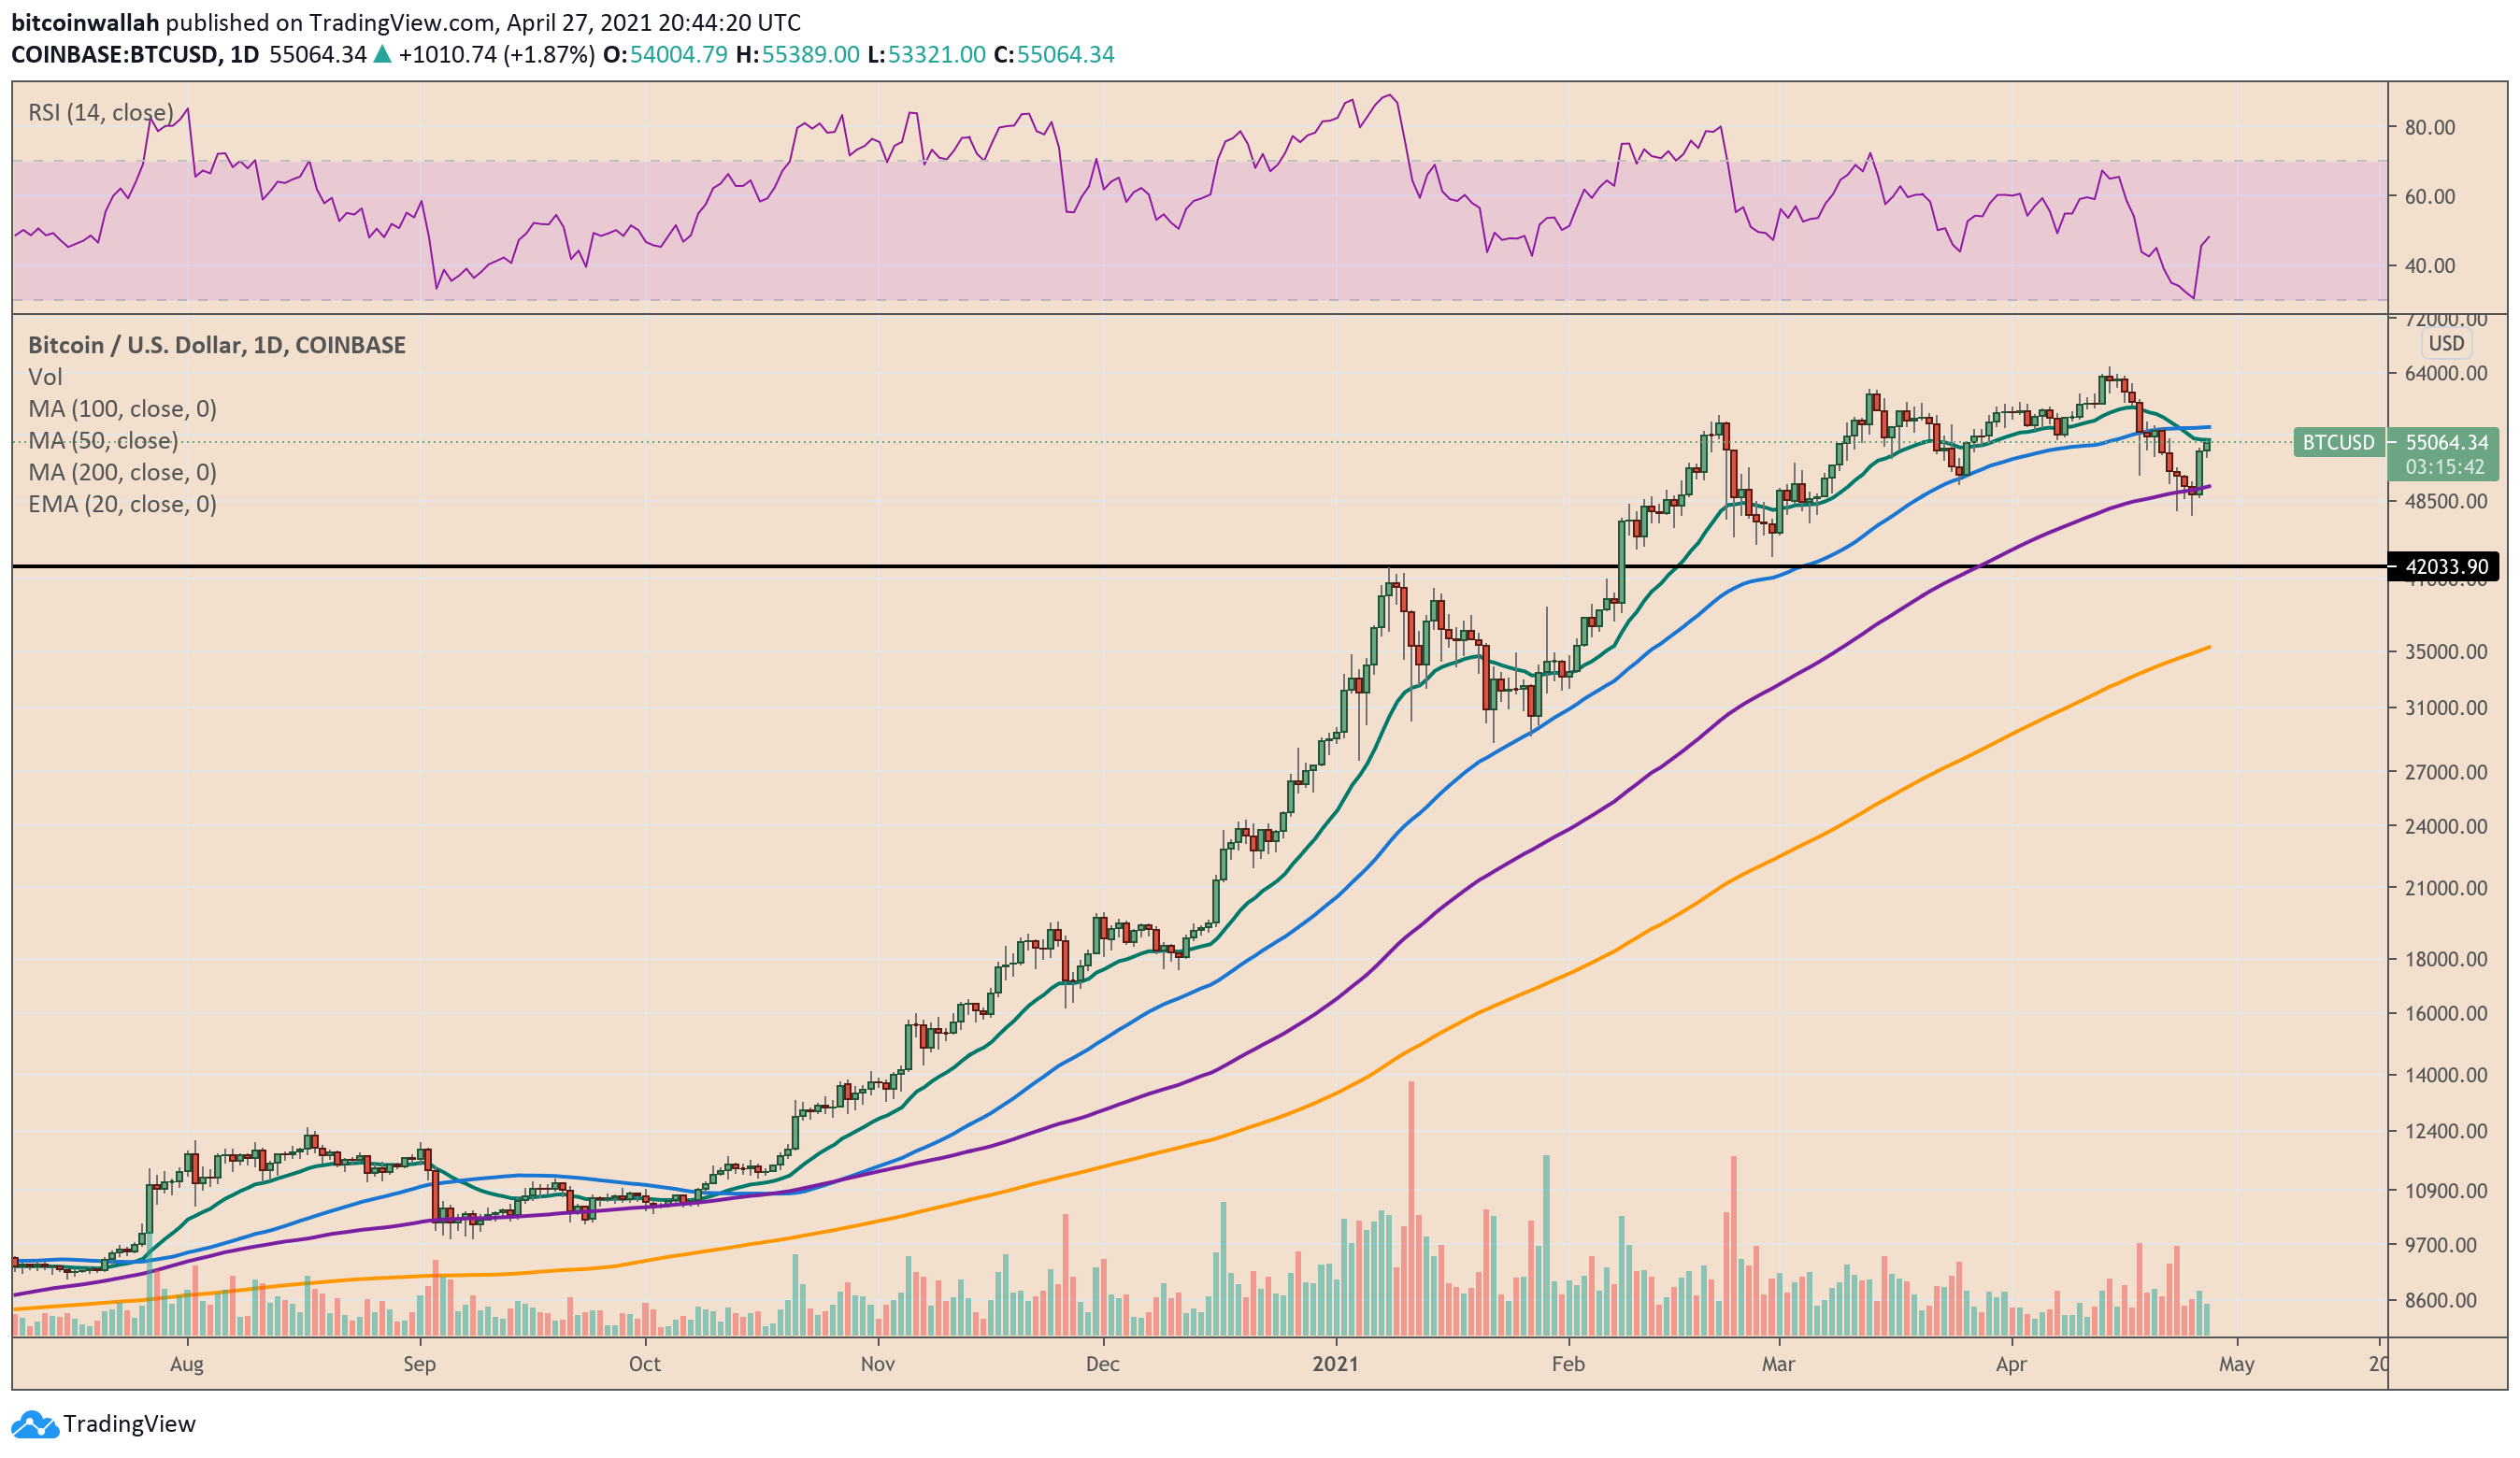
BTC fails to hold above $30,000 | Source: BTCUSD on TradingView.com

What this suggests is that there will likely be more volatility coming into the market. This could happen regardless of whether the price recovers or continues to decline. However, the growth in open interest usually precedes a large recovery trend such as the one recorded during the July 26th short squeeze. So more than likely, it will be a recovery in price that will follow this surge in volatility. 

Related Reading | Bitcoin On-Chain Activity Throttled After LUNA Collapse

Bitcoin remains the largest cryptocurrency in the space with a market cap of $552 billion. It is up 5.10% in the last 24 hours to be trading at $29,200 at the time of this writing.

Featured image from CoinDesk, charts from Arcane Research and TradingView.com

Follow Best Owie on Twitter for market insights, updates, and the occasional funny tweet… 

Funding Rates Fall To Yearly Lows Following Bitcoin’s Fall Below $29,000

Bitcoin has had a rough couple of weeks leading up to this moment and the effects of this are still being felt all across the board. This has seen bitcoin’s price crumble below $30,000 once more. Along with this fall has come some other brutal news for the digital asset. One of these has been the funding rates, whose massive dive has shown increasingly bearish momentum among the largest traders.

Funding Rates Take A Dive

The Bitcoin funding rates had been in a bit of a lull even as the price of BTC had begun taking its beat-down at the $40,000 level. Mostly, it had remained neutral or below neutral so the sudden drop in funding rates is no surprise. However, the degree to which it had dropped had been more cause for concern. This time around, funding rates have taken a nosedive that has sent them towards yearly lows.

Related Reading | How The Tether Peg Could Predict Raging Bitcoin Volatility

Arcane Research reports that the plunge had come in the midst of the sell-offs that had rocked the market last week. This had seen funding rates drop across major exchanges in the space. Most notably on May 12th when the funding rate had fallen to a -0.0042% on the biggest exchange, Binance. 

Funding rates decline to yearly lows | Source: Arcane Research

An interesting note is that funding rates, despite trending in the negative territory, have not been this low since July of 2021. This means that this is the most significant dip that has been recorded in the market in the space of a year. 

Traders were already bearish before now, resulting in the neutral funding rates that were recorded the previous week. However, this proves that the larger market is expecting more bearish trends and are therefore making moves to protect themselves.

Bitcoin Long Liquidations Is The Trigger

After the decline below $30,000, bitcoin had recorded one of the most brutal liquidation trends in recent memory. Liquidations had reached as high as $0.73 billion in bitcoin liquidated in a single day, culminating in the highest liquidation event recorded since the December 4th crash. 

BTC price declines below $29,000 | Source: BTCUSD on TradingView.com

Future and perp traders had obviously borne the brunt of this and this, in turn, had negatively affected the funding rates. The perpetual markets trading substantially below the spot market following the liquidations had contributed greatly to the plummet in funding rates.

Related Reading | Crypto Carnage Causes Flight To Bitcoin Safe Haven, Dominance Demonstrates

The funding rates had begun to recover after May 12th though. Briefly returning to the neutral territory before once more plummeting back down. However, the fall rate has not been as deep as the previous fall. 

Funding rates still remain well below neutral at the time of the report, which means that perp traders are still very bearish on the market, and as such, are not putting as much money into the digital asset.

Featured image from Cryptocoin Spy, charts from Arcane Research and TradingView.com

Follow Best Owie on Twitter for market insights, updates, and the occasional funny tweet… 

Bitcoin Funding Rates Remain Unmoved Despite Plunge To $30,000

Bitcoin funding rates had taken a plunge at the beginning of May. While this had not been a pronounced bear trend at that point, the price of BTC was already showing some signs of weakness. That weakness has now seen the digital asset plunge below $30,000 for the first time in 2022 and back up. However, funding rates that had returned to neutral had remained unmoved by this volatility in the market.

Bitcoin Funding Rates Are Unshaken

Bitcoin had seen some massive sell-offs around the $35,000 level. This was mainly triggered by investors panicking that they may lose more of their holdings and as such, had tried exiting the cryptocurrency to mitigate these losses. The resultant fear and liquidations that had erupted had worked together to push the price of the digital asset even further down, and like clockwork, every other thing in the market had followed this downtrend.

Related Reading | Market Downtrend Trigger Bitcoin Inflows From Institutional Investors

Funding rates would prove to be one of the few immune to this downtrend. After recovering from its crash at the start of the month, it had gone back to the neutral level and this is where it stayed even as bitcoin had broken down below $35,000. Even when its price had fallen lower, funding rates had remained unshaken.

Funding rates remain neutral | Source: Arcane Research

This follows the same trend that had been recorded since the December 4th crash. Funding rates had started on a trend of being at or below neutral and have not deviated from this since then. It was obviously the result of negative sentiment across investors which had led to low momentum.

Another group that this is indicative of is the perp traders. These perpetual traders have been following the spot market closely. This is obviously a deviation from the norm because as seen in previous market trends, the funding rates fall when the price of the digital asset falls.

BTC crumbles to $29,000 | Source: BTCUSD on TradingView.com

This indicates that these perp traders are leaning towards adding more long exposure with the digital asset. Mostly, this is happening near what is perceived to be the bottom of the one-and-a-half-year trading range. 

Related Reading | Shiba Inu Vs. Dogecoin And LUNA: Which One Will Survive The Crypto Carnage?

The average funding rate is pulled from cryptocurrency exchanges Binance and Bybit, both of which have proven to have the most presence from perp traders. Even though the whole Terra UST issues, funding rates have refused to budge.

Featured image from The Economics Times, charts from Arcane Research and TradingView.com

Bitcoin Long Squeeze Incoming? Funding Rates Surge Up

On-chain data shows the Bitcoin funding rates have observed a rise again, suggesting that another long squeeze may be in store for the crypto.

Bitcoin Funding Rates Show Relatively High Positive Value

As explained by an analyst in a CryptoQaunt post, the current positive funding rates may mean the price could observe a decline soon.

The “funding rate” is an indicator that measures the periodic fee that Bitcoin futures traders are paying each other.

When the value of this metric is greater than zero, it means long traders are paying a premium to short investors to hold on to their positions right now. This trend therefore suggests that the majority sentiment is bullish at the moment.

On the other hand, negative values of the indicator imply that a bearish sentiment is more dominant as shorts are paying longs currently.

Now, here is a chart that shows the trend in the Bitcoin funding rates (72-hour MA) in the year 2022 so far:

Looks like the value of the metric has surged up recently | Source: CryptoQuant

As you can see in the above graph, the quant has marked the points where the Bitcoin funding rates reached a peak during the last few months.

It seems like shortly after relatively high positive funding rates occurred, the price of the crypto observed a steep decline.

Related Reading | Five Months Of Fear: When Will The Bitcoin Carnage End?

A long squeeze is a mass leverage flush event where long liquidations cascade together. Such a squeeze can sharply drive the price down and the above instances seem to have been marked by this squeeze.

A short squeeze, on the contrary, can rather uplift the price. The analyst therefore argues that the Bitcoin market will require negative funding rates if the price has to observe any real improvements.

However, as longs are currently dominating the futures market, a long squeeze will need to happen to take the funding rate down and pile up shorts.

Related Reading | Bitcoin Institutional Outflows Near One-Year Highs, More Downside Coming?

But with that, the price of the crypto may also suffer another plunge down just like the instances earlier in the year.

BTC Price

At the time of writing, Bitcoin’s price floats around $39.5k, down 1% in the last seven days. Over the past month, the crypto has lost 15% in value.

The below chart shows the trend in the price of the coin over the last five days.

The price of BTC seems to have observed a sharp rise in the past twenty-four hours | Source: BTCUSD on TradngView

Bitcoin has been struggling for many months now and the price has recently shown no signs of any real recovery as it remains stuck below the $40k level.

Featured image from Unsplash.com, charts from TradingView.com, CryptoQuant.com

Broader Market Celebrates Bitcoin Breakout, But What About Perp Traders?

Bitcoin perpetual traders seem to be the only ones unmoved by the digital asset’s recent breakout. BTC which has had a tremendous rally during the first half of the week had been able to break out of the slump of the low $40,000s and moved on an upward trajectory above $47,500. However, perp traders have not reacted much to it given the state of the funding rates.

Funding Rates Remain Flat

The bitcoin perpetual traders are not reacting to the recent upside as expected. This is evidenced in the fact that the perp basis is still sitting at or even below neutral funding rates, marking the 115th consecutive day that this has remained the case. This speaks volumes to how perp traders are viewing the market. Regardless of the bitcoin price increase, they have not increased their activity in any significant way.

BTC funding rates remain neutral amid price growth | Source: Arcane Research

It could easily mean that perp traders are not convinced by the recent price movement. As with the previous uptrends recorded this year, it could mean that perp traders are expecting the digital asset to go the same way. However, this uptrend has differed from its predecessors given the fact that it has broken above the $45,000 resistance point and possesses the potential to climb towards $50K.

Related Reading | Here Are The Projects Pushing Cardano’s Price To The Upside

Funding rates have refused to be moved, however. Even going as far as falling below the neutral funding rate. This follows the trend for the year so far, given that there have been no positive funding rates recorded in 2022. The decline in funding rates can be attributed to long traders closing their positions, which have caused perpetual prices to either align or continue to trail behind spot prices.

Bitcoin Open Interest Declines

Funding rates are not the only metric that shows perp traders remain uninterested in the uptrend. Open interest in perpetual has also declined recently. In the space of less than a week, it had fallen from 256K BTC to 245K BTC. One explanation for this could be the short liquidations that have rocked the market since bitcoin began this recovery.

BTC maintaining momentum above $47,000 | Source: BTCUSD on TradingView.com

The USDT collateralized BTC perp on Binance is known to be the largest perp instrumental. This instrument had recorded a new all-time high recently as open interest had gone up. It was swiftly followed by both neural/low funding rates and even long-short ratios below 1. All of this is to say that there is the possibility of crowding on the short side.

Related Reading | Ethereum “Diamond Hands” Filled Their Bigs Through The Dip

An implication of this, notes Arcane Research, would be a suggestion that leverage in the crypto market remains “relatively lofty.” However, this comes with some negative sentiments. Together, this “could be a potent setup for a short squeeze if the strong momentum holds” the report reads.

Featured image from CoinDesk, charts from Arcane Research and TradingView.com

Bitcoin Funding Rates Remain Negative For More Than A Week

On-chain data shows the Bitcoin funding rates have mostly remained negative for more than a week now. If past trend is anything to go by, this may mean that a bottom could be near.

Bitcoin Funding Rates Have Now Remained Mostly Negative For More Than Seven Days

As pointed out by an analyst in a CryptoQuant post, the Bitcoin funding rates have been negative in the past week for the most part.

The “funding rates” is an indicator that measures the periodic fee Bitcoin futures traders have to pay each other in order to hold onto their positions.

When the value of this indicator is positive, it means long holders are currently dominant and are paying a premium to short traders. Such values occur when the market sentiment is majorly bullish.

On the other hand, negative funding rates imply shorts now outweigh the longs and are willing to pay a fee to the longs. This kind of trend may show that the majority sentiment among traders is bearish at the moment.

Related Reading | Why Bitcoin Could Hit $90K By The End Of 2022, According To This Prediction

Now, here is a chart that highlights the trend in the BTC funding rates since April of last year:

Looks like the value of the indicator has been negative recently | Source: CryptoQuant

As you can see in the above graph, the Bitcoin funding rates have been mostly negative for more than a week now.

Related Reading | This Bitcoin Volatility Index Pattern Suggests A Short Squeeze May Be Near

Such values suggest that the sentiment among the majority of the futures market traders seems to be bearish right now.

In the chart, it’s also visible that the last time such negative funding rates stuck for longer than this was back in during the mini-bear market between May and July 2021. In this period, a bottom formation occurred.

Because of this, the quant in the post notes that the current negative funding rates may provide the ideal conditions for a trend reversal.

BTC Price

At the time of writing, Bitcoin’s price floats around $37.3k, up 11% in the last seven days. Over the past month, the crypto has lost 20% in value.

The below chart shows the trend in the price of BTC over the last five days.

BTC’s price has mostly moved sideways in the last few days | Source: BTCUSD on TradingView

A couple of days back, Bitcoin’s price touched as high as $38.6k, before coming back down to the current levels. At the moment, it’s unclear when the coin’s price may recover, but if the funding rates are anything to consider, a bottom can form in the current conditions.

However, it’s worth noting that during the May-July consolidation it took more around three months of negative funding rates before the bottom formation.

Featured image from Unsplash.com, charts from TradingView.com, CryptoQuant.com

Bitcoin Funding Rates Turn Negative In Sentiment Reset

Data shows following the crash, Bitcoin funding rates flipped to negative for the first time since September as market sentiment resets.

Bitcoin Funding Rates Turn Negative For The First Time Since Late September

As per the latest weekly report from Glassnode, market sentiment reset after the latest crash in BTC’s price as funding rates turned negative.

The “perpetual funding rate” is an indicator that measures the periodic fee that Bitcoin futures traders have to pay each other to keep their positions. This metric helps us know about which direction leveraged positions tend to.

When the indicator’s value is negative, it means short traders are currently paying long traders to hold on to their position. Such a trend may show that the market sentiment is bearish on the price of BTC.

On the other hand, if the metric’s value is positive, it means the market shares a majority bullish bias as long traders pay a premium to the short traders.

Now, here is a chart that shows the trend in the Bitcoin funding rates over the past six months:

Looks like the funding rates dipped to negative recently | Source: The Glassnode Week Onchain (Week 49)

As you can see in the above graph, the funding rates have been positive for many months now, but following the crash they have turned negative.

Related Reading | Understanding Bitcoin UTXO: Mid-To-Long Term Holders Responsible For November Correction

The reason for this switch is that due to the crash, there was a cascade of long liquidations. This kind of situation can push the funding rates down and to the opposite side.

These long liquidations resulted in the open interest being flushed of $5.4 billion in futures contracts. And subsequently, the funding rates declined to around -0.035%.

While this is the first time since late September that the funding rates have turned negative, such highly negative values were only seen back in July.

Related Reading | Data Shows Bitcoin Short-Term Holders Have Started To Sell At A Loss

This flip to negative means that the Bitcoin market sentiment has now been reset.

BTC Price

At the time of writing, Bitcoin’s price floats around $51.3k, down 12% in the last seven days. Over the past month, the crypto has lost 16% in value.

The below chart shows the trend in the price of the crypto over the last five days.

BTC’s price recovers a bit from the crash in the past 24 hours | Source: BTCUSD on TradingView

A few days back, Bitcoin’s price crashed down to $42k. Quickly after, it recovered a bit to higher levels, and then consolidated for a couple of days. In the past day, the coin has shown some recovery as it has once again broke above $51k.

Featured image from Unsplash.com, charts from TradingView.com, Glassnode

Bitcoin Funding Rates Fall Below Zero In Market Sentiment Reset

Yesterday, funding rates fell below zero in a market sentiment reset as Bitcoin’s price declined following its new all-time high.

Bitcoin Funding Rates Briefly Fell Below Zero Yesterday

As per the latest weekly report from Arcane Research, the funding rates have plummeted following a spike around when BTC made a new ATH. Yesterday, they briefly went below zero.

The “funding rate” is a Bitcoin indicator that tells us about the current periodic payments that futures contract traders are making between each other.

When the metric has positive values, it means long traders are paying short traders to keep their positions. Such a situation suggests that the market sentiment is currently bullish.

On the other hand, negative values of the indicator imply short traders are paying a premium to hold their positions. This trend may mean that the market sentiment is bearish at the moment.

Now, here is a chart that shows how the value of the Bitcoin funding rate has changed in the past couple of months:

Looks like the funding rates have plummeted recently | Source: The Arcane Research Weekly Update – Week 45

As the above graph shows, when Bitcoin made a new ATH around $69k earlier in the month, the indicator also showed a big positive spike.

Related Reading | Bulls Giving Up? Massive Bitcoin Bid Wall Removed, What It Could Mean For BTC

However, BTC couldn’t keep the momentum up and the price started falling shortly after. The funding rates plummeted down hard along with it.

Because of this decline in the price of Bitcoin, November 10th observed about $500 million worth of long liquidations.

Many traders seem to have bet on BTC’s price moving further up after its new ATH so they opened new leveraged long positions. But due to the crash, these positions ended up being liquidated.

On November 15th (that is, yesterday), the indicator’s value briefly went below zero. This is the first time it has happened since the end of September.

Related Reading | Confirmed: AMC Now Accepts Bitcoin, Ethereum, Two Other Cryptos, Dogecoin To Follow

Currently, the funding rates are just above zero. It looks like balance has returned to the market as there are equal amounts of short and long demands.

However, with BTC’s latest downtrend, this balance may soon shift.

BTC Price

At the time of writing, Bitcoin’s price is trading around $60.9k, down 8% in the last seven days. Over the past thirty days, the crypto has gained 0.3% in value.

The below chart shows the trend in the price of the coin over the last five days.

BTC has continued its decline as it plunges down in the last couple of days | Source: BTCUSD on TradingView
Featured image from Unsplash.com, charts from TradingView.com, Arcane Research

Bitcoin Funding Rates Touch Same Level As Early September, More Correction To Come?

Data shows Bitcoin funding rates right now are at the same level as they were in early September. This means the coin may see another flush out similar to how it happened back then.

Bitcoin Funding Rates Float Around Similar Levels To Early September

As per this week’s on-chain report from Glassnode, the BTC futures perpetual funding rate of all exchanges is currently at the level similar to what it was back in early September before the crash.

The “funding rates” is an indicator that shows the premium that traders have to pay each other while holding on to their positions in the perpetual swap futures markets.

When the metric has negative values, it means that short traders are paying longs, and that many traders are bearish on Bitcoin right now.

Opposite to that, positive funding rates imply that the overall market sentiment is leaning towards bullish and longs are currently paying shorts to keep their positions.

Related Reading | BTC Holders Reduce Spending, Why Bitcoin Could Get More Rocket Fuel

Now, here is a chart that highlights the trend in the value of the indicator over the last six months:

Looks like the metric is currently showing highly positive values | Source: Glassnode’s The Week On-Chain, Week 43

As the above graph shows, when Bitcoin made its new all-time high (ATH) some days ago, the indicator reached positive local highs.

This means traders started opening many leveraged long positions so that they don’t miss out on the wave of BTC making new ATHs.

Related Reading | On-Chain Data Shows Surge In Stablecoins Supply Pouring Into Bitcoin

However, the price had a correction, which has often been the case during periods of high leverage, and a lot of the excess leverage was flushed out.

Nonetheless, the funding rates are still at similarly high levels right now as in early September. What followed then was the El Salvador crash that took the rates to negative values.

It’s possible another correction can take place now in order to flush out more of the currently high leverage in the market. Though it’s not a certainty that it will be how it plays out.

BTC Price

At the time of writing, Bitcoin’s price floats around $62.5k, down 0.4% in the last seven days. Over the past month, the crypto has gained 44% in value.

The below chart shows the trend in the price of the crypto over the last five days.

BTC’s price seems to be recovering somewhat from the dip | Source: BTCUSD on TradingView

Over the last few days, Bitcoin has shown some effort to bounce back from the correction, but in the last couple of days, the crypto has only moved rather sideways. If the futures funding rates are anything to go by, the market may be heading towards another correction soon that will wipe out the excess leverage.

Featured image from Unsplash.com, charts from TradingView.com, Glassnode.com

Bitcoin Funding Rates Fall Flat For Weeks As Market Takes Pause

The funding rates for Bitcoin have recovered from their September 2020 lows, insomuch that they are now trending sideways since April 18.

Many analysts watch Bitcoin Funding Rates because of their potential to predict the upcoming trends in the flagship cryptocurrency market. In retrospect, they signify periodic payments that traders with open short positions pay to the ones with open long positions, all based on the difference between the perpetual contract market and spot price.

A positive funding rate reflects traders’ bullish bias, showing that long traders pay short traders in a market that appears heavily skewed to the upside. Similarly, when the Bitcoin funding rate becomes negative, it implies that traders are bearish, which means short traders pay long traders.

But…

…based on Arcane Research’s report, the funding rates have gone neutral for more than a week. The research and analysis firm added that the short-term bias conflict between bears and bulls would eventually favor the latter, given the Bitcoin price’s incredible recovery at the beginning of this week.

The BTC/USD exchange rate dropped by more than 27 percent after establishing its record high of $64,899 on April 14. It was only until this Monday that the pair showed any signs of recovery. Its rebound went as far as 12 percent on a week-to-date timeframe, coinciding with its neutralizing funding rates.

“The fact that the funding rate has remained neutral amid Bitcoin’s strong recovery yesterday is a healthy sign going forward,” wrote Arcane Research.

Bitcoin Price vs Funding Rates. Source: Arcane Research
Bitcoin Price vs. Funding Rates. Source: Arcane Research

More bullish tailwinds for Bitcoin came from its declining open interest. Arcane Research cited derivatives market data from April 27 session, noting that unsettled BTCUSD contracts reached their lowest levels since March 8. That reflected more cautious sentiment in the derivative market. It also meant that the ongoing Bitcoin price recovery entirely took cues from spot markets.

“It makes the current price action more sustainable,” added Arcane Research.

Part of the reason Arcane Research appeared bullish is the ability of the derivatives market to drive bitcoin prices wildly. Traders typically open highly leveraged trades as they anticipate maximum returns from precarious positions. Nevertheless, when their bets fail, it increases their tendency to sell their real bitcoin assets to cover their margin positions. That overall fuels selling pressure in the market.

What’s Next for Bitcoin?

According to ByBt.com, the bitcoin options contract expiring on April 28 has a majority strike price target near $52,000. That increases the pressure on bulls to protect the market from potential bearish assaults. Should they fail, one can expect a breakdown towards the said lower level.

It also coincides with the 100-day simple moving average, which served as support to the ongoing Bitcoin price rebound.

Bitcoin bounces off the purple wave (100-DMA). Source: BTCUSD on TradingView.com

As of now, the BTC/USD exchange rate is looking to break above its 20-day exponential moving average (20-DMA).

Image by Marcel Langthim from Pixabay