Is A $72K Bitcoin Surge On The Horizon? Glassnode’s Latest Analysis Points To An Answer

Recent insights from Glassnode’s cofounders, shared under their X (formerly Twitter) account ‘Negentrophic’ have sparked interest in Bitcoin market dynamics, leading to a promising stabilization and possible price surge.

Market Sentiments And EMA Trends

With Bitcoin’s value recently wavering below the $70,000 mark, a detailed analysis from the cofounders suggests that a strong support level around the $62,000 50-day Exponential Moving Average (EMA) could set the stage for a significant rebound.

This crucial support level indicates a strong buying sentiment, indicating the market’s confidence in the cryptocurrency’s value and a potential resistance against further declines.

Using the strategic placement of the 50-day EMA as a support point, the analysis suggests that investors might see the current price levels as a solid base, preventing significant downward movements.

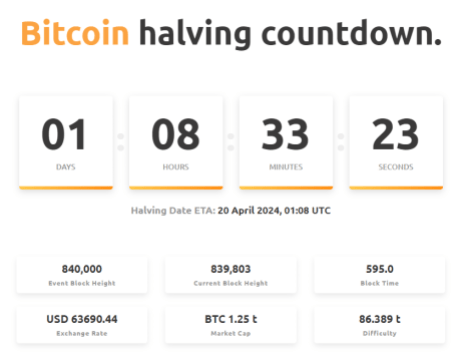
This perspective is reinforced by recent price movements, where despite a pre-halving general dip, Bitcoin has experienced a 7.1% increase in value over the past week, and the same uptick continued in the last 24 hours.

Bitcoin (BTC) price chart on TradingView

Further analysis by the Glassnode cofounders delves into the behavior of EMAs over different durations. Short-term EMAs indicate a growing inclination among investors to buy, while longer-term EMAs lean towards selling.

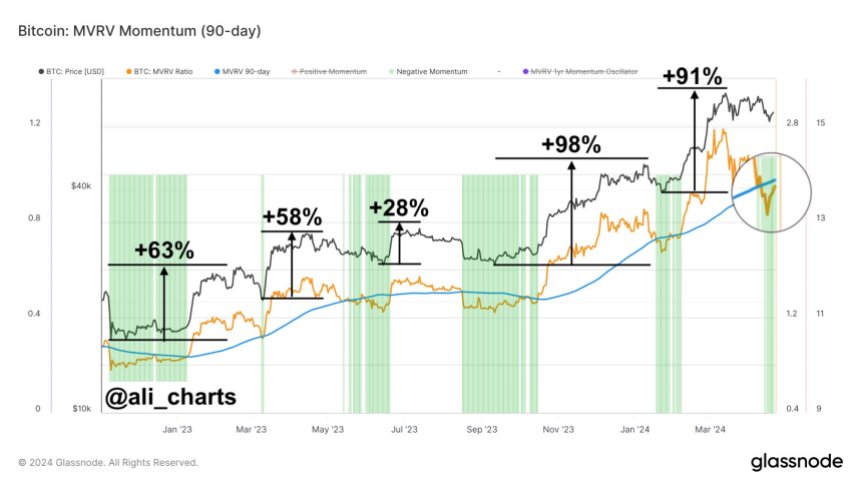
This contrasting behavior between short and long-term EMAs sheds light on the current phase of the market, which seems to be in a period of consolidation after the notable 92% increase in Bitcoin’s price over six weeks earlier in the year.

Such insights are vital as they offer a deeper understanding of the underlying market forces and investor behavior during volatile periods.

Meanwhile, Glassnode’s team’s analytical approach extends beyond simple price movements. Yesterday, they compared the current market conditions to the early 2021 “strong correction,” which they term “wave 4” of the ongoing market cycle.

This historical perspective provides a lens through which current trends can be evaluated, suggesting a cyclic return to bullish conditions reminiscent of past market behaviors.

Bitcoin Bullish Projections And Market Dynamics

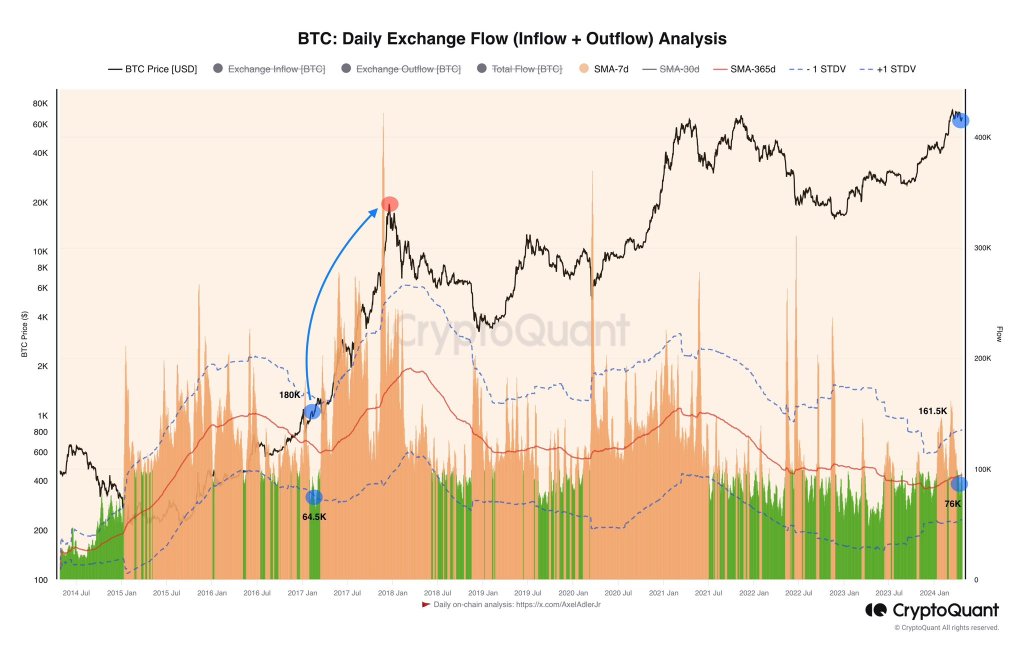
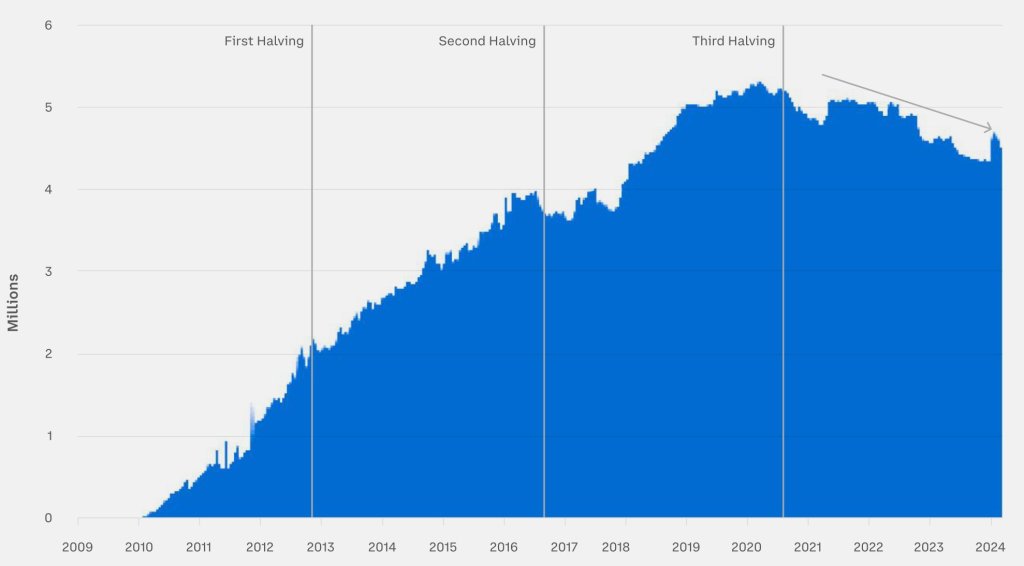
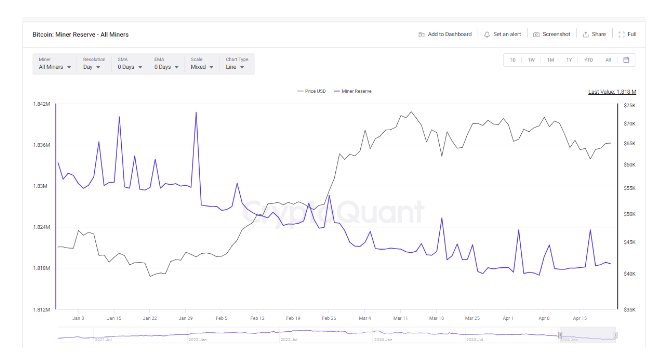
Bitfinex analysts have highlighted significant activities around Bitcoin withdrawals, supporting the optimistic outlook on Bitcoin. The current levels, echo those of January 2023, suggest that investors are increasingly moving their Bitcoin to cold storage—a sign that many anticipate further price increases.

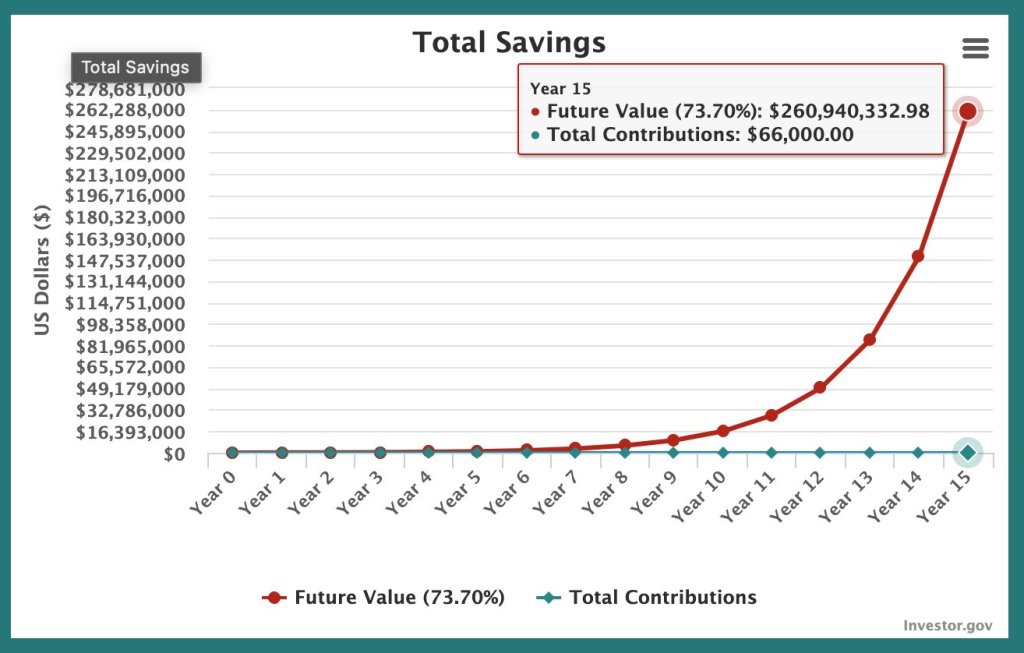
Veering back to Glassnode’s projections yesterday based on their indexes and Fibonacci levels, the cofounders were boldly optimistic, anticipating a potential 350% increase from current market levels.

Notably, this forecast highlights the expected financial trajectory and underscores a growing confidence among experts and market analysts in Bitcoin’s market performance and its foundational economic principles.

Featured image from Unsplash, Chart from TradingView

This Metric Printed In 2017 Before Bitcoin Exploded: Is A Mega Run Incoming?

In a post on X, one analyst has picked out a key on-chain metric that could signal the beginning of a strong leg up, similar to the explosive gains 2017. Currently, Bitcoin prices remain steady and edging higher. However, the coin failed to register sharp upswings, as most traders had predicted before the Halving event on April 20.

Flow Indicator Dips: A Bull Run In The Making?

Taking to X, the analyst said there has been a sharp drop in the 7-day average Flow indicator at leading crypto exchanges like Coinbase and Binance. When this was highlighted, the Flow indicator pointed to a decline from 161,000 to 76,000 BTC, a nearly 50% drop. 

BTC daily exchange flow | Source: Analyst on X

Interestingly, a similar pattern emerged in 2017 before Bitcoin embarked on a historic bull run.

The analyst said the Flow indicator dropped to 64,500 BTC across exchanges days and weeks later before prices exploded to around $20,000 in December 2017. 

Bitcoin price trending upward on the daily chart | Source: BTCUSDT on Binance, TradingView

For now, only time will tell if Bitcoin is preparing for a strong leg up. The coin remains within a bear formation, looking at the candlestick arrangement in the daily chart. Even though prices rose after Halving Day on April 20, sellers are in charge. As it is, the April 13 bearish engulfing pattern continues to define price action. Technically, a close above $68,000 might be the foundation for a rally towards $74,000 in the days ahead.

Bitcoin Supply Rapidly Shrinking

While the Flow indicator points to declining BTC across exchanges, another analyst has discovered an interesting development. Taking to X, another analyst noted that the available Bitcoin supply dipped below 4.6 million for the first time before April 20, when the network halved miner rewards. 

BTC supply falling | Source: Analyst on X

Since Halving reduces daily emissions by half, even if the current demand is sustained, the analyst says a supply squeeze will drive prices higher. Even so, as mentioned earlier, whether BTC will rally depends on the pace at which immediate resistance levels are cleared.

Historically, prices tend to rally a few months after Halving Day. However, in the past few months, there have been notable deviations. For instance, prices soared to all-time highs before Halving Day. This is the first time this has happened.

Beyond technical formations, the United States Securities and Exchange Commission (SEC) approved the first spot Bitcoin ETFs in January 2024. Through this product, institutions are free to gain exposure through shares. These shifting dynamics will shape price action in the current epoch, possibly leading to new deviations from historical performances. 

Bitcoin Market Dynamics Still Positive Post-Halving – Bitfinex Analysis

In the midst of the dramatic changes that have occurred in the cryptocurrency space after the Bitcoin halving event, Bitfinex provides a perceptive analysis that reassures investors that the market dynamics of BTC have remained positive in the post-halving period. Bitfinex examines the on-chain data and finds encouraging signs for Bitcoin in spite of the United States economy’s current state of uncertainty in its most recent Alpha report, which was released on April 22.

Bitcoin Market Dynamics Remains Bullish

According to the Hong Kong-based crypto platform, exchange withdrawals of Bitcoin are currently at levels not seen since January 2023. This simply indicates that a lot of investors are putting their assets in cold storage in expectation of price rises.

Also, the exchange noted that long-term investors’ aggressive selling has not yet caused the usual pre-halving price decline, which suggests that new market participants are absorbing the selling pressure quite well, highlighting the tenacity of the present market structure of Bitcoin.

The Bitfinex Alpha report revealed that the average daily net inflow from spot Bitcoin Exchange-Traded Funds (ETFs) is $150 million. Given the ETFs’ inflows far exceeding the $30 and $40 million daily issuance rate of BTC following the halving, this significant supply and demand imbalance could encourage further price appreciation.

Bitfinex further claims the massive purchases of spot Bitcoin ETFs, which have dominated the entire year’s market narrative, may decline. However, recent ETF outflows have shown that ETF demand may be starting to stabilize.

It is important to note that the recently concluded Halving cut down miners’ reward from 6.25 BTC to 3.125 BTC. As a result, miners are now modifying their operating tactics in order to sustain their activities against the decline in reward following the Halving.

Thus, the amount of Bitcoin that miners are sending to exchanges has significantly decreased, which may indicate that they are selling ahead of time or collateralizing their holdings to upgrade infrastructure. Consequently, this could possibly lead to a gradual increase in selling pressure rather than a sudden drop in value at the Halving.

New BTC Whales Surpassed Old Whales

Since the conclusion of the fourth Halving, on-chain data shows a significant rise in new Bitcoin whales. CryptoQuant Chief Executive Officer (CEO) Ki Young Ju, reported the development, noting that the initial investment made by the new whales in Bitcoin is nearly twice that of the old whales combined.

According to the data, the total holding by these new whales, which are short-term holders, is valued at $110.6 billion. Meanwhile, the old whales, which are long-term holders, own a whopping $67 billion worth of BTC. This change in whale demographics may impact Bitcoin’s future course and the dynamics of the cryptocurrency landscape as a whole.

Bitcoin

Conservative Projection Places Bitcoin At $245,000 In 5 Years

A recent analysis paints a rosy picture of Bitcoin’s future, even with a conservative growth projection. Taking to X, Michael Sullivan predicts that the world’s most valuable coin could reach a staggering $245,000 within just five years if it maintains a mere 30% compound annual growth rate (CAGR). 

Bitcoin Projections: From Conservative To Exponential Growth

The analysis explores various growth possibilities for Bitcoin. Assuming the coin’s growth rate significantly contracts in the coming years, growing at just 30% CAGR, Sullivan projects the coin to reach $245,000 by 2029. 

BTC price at a CAGR of 30% | Source: Analyst

A decade later, it will be at $909,000; by 2039, each coin in circulation will be trading at a whopping $3.37 million. If, however, the CAGR rises to 40%, Bitcoin would be worth $10.3 million in 15 years and $1.9 million in 10 years.

Still, even at these mega valuations, Bitcoin has been soaring at unprecedented rates, outperforming all traditional finance assets since launching. To demonstrate, Bitcoin registered a CAGR of 73.7% over the past four years. 

Therefore, if this trend continues, Sullivan says BTC will smash above the $1 million level a year after halving in 2028. However, half a decade later, each coin will change hands at over $16.5 million. 

BTC at a CAGR of 73.7% | Source: Analyst on X

A look back at Bitcoin’s history makes it clear that the coin has been on a tear. Following this historical trend and making projections for the future, BTC could be far more valuable in the next five or ten years.

There Are No Guarantees, Crypto Is Dynamic

While these projections are undoubtedly exciting for Bitcoin holders, it’s crucial to remember that they are just projections. The crypto market, just like any other tradable asset, doesn’t move in straight lines. 

As an illustration, after peaking at nearly $70,000 in 2021, prices crashed to as low as $15,600 the following year. In 2017, BTC rose to around $20,000 before tanking to below $4,000 a year later in 2018. This volatility and the dynamic market, influenced by new circumstances, don’t guarantee these lofty projections.

Bitcoin price trending upward on the daily chart | Source: BTCUSDT on Binance, TradingView

Nonetheless, analysts remain optimistic of what lies ahead, especially after the historic Halving event on April 20. As traditional finance players join in, finding exposure in BTC through spot exchange-traded funds (ETFs), prices might rise, even breaking above the all-time highs of around $74,000.

Market Expert Predicts New Paradigm For Bitcoin: ‘Days Under $100,000 Numbered’

As the Bitcoin (BTC) Halving event concluded for the fourth time, the cryptocurrency market witnessed notable changes in key metrics. 

These developments have led Charles Edwards, a market expert and founder of Capriole Invest, to issue bold predictions that hint at a paradigm shift in the BTC market. 

Bitcoin Trading At ‘Deep Discount’

One of the key metrics highlighted by Edwards is the staggering electrical cost associated with mining a single Bitcoin. Edwards reveals that this cost has now reached an astonishing $77,4000. This figure represents the raw electricity expenses required to power the Bitcoin network for every newly mined BTC.

Another significant metric that Edwards draws attention to is the Bitcoin Miner Price, which soared to $244,000 on Saturday. This metric encompasses the block reward and fees miners receive for every Bitcoin they successfully mine. 

Notably, this surge in miner price coincided with transaction fees skyrocketing to $230, marking a four-fold increase compared to the previous all-time high of $68 set in 2021.

Bitcoin

Considering the metrics above, Edwards suggests that BTC currently trades at a “deep discount.”  This is because BTC’s price is lower than the electrical costs of mining it.

Typically, this situation only lasts for a few days every four years, suggesting that the price will only take a short time to catch up and surpass this price level, which is slightly below BTC’s all-time high (ATH) of $73,7000, reached on March 14th. 

Edwards outlines three possible outcomes in the wake of these developments. First, he anticipates a scenario in which the price of Bitcoin experiences a significant surge. 

Secondly, there is a likelihood that approximately 15% of miners may be forced to shut down due to unfavorable economics. Finally, Edwards suggests that average transaction fees are expected to remain substantially higher.

Based on the analysis of these metrics and the potential scenarios, Edwards boldly predicts that Bitcoin’s days under the $100,000 mark are “numbered.” While it remains to be seen which of the three outcomes will prevail, Edwards expects a combination of all three factors to contribute to Bitcoin’s price appreciation.

Optimal Buying Opportunity? 

Bitcoin has demonstrated significant price consolidation above the $60,000 mark since Friday, following temporary drops below this threshold amid mounting anticipation for the Halving event. 

Crypto analyst Ali Martinez recently analyzed Bitcoin’s current price state, suggesting that a potential bottom may have formed above these levels, increasing the likelihood of surpassing upper resistance levels shortly.

According to Ali Martinez’s analysis, Bitcoin strives to establish the $66,000 price level as a crucial support zone. Data reveals that approximately 1.54 million addresses collectively purchased 747,000 BTC at this level. If Bitcoin successfully secures this support, it may pave the way for further upward movement.

Martinez identifies Bitcoin’s next critical resistance levels, between $69,900 and $71,200. These levels represent significant price barriers for BTC bulls, and Bitcoin may encounter selling pressure at these levels. 

In addition, the analyst points out that the Bitcoin MVRV ratio, a metric that compares the market value of Bitcoin to its realized value, has shown a promising pattern, as seen in the chart below. 

Bitcoin

Martinez highlights that whenever the MVRV ratio falls below its 90-day average since November 2022, it historically indicates an optimal buying opportunity for Bitcoin. Interestingly, such buying opportunities have resulted in average gains of approximately 67%.

According to Martinez, based on current market conditions and an analysis of the MVRV ratio, now may be an opportune time to consider buying Bitcoin. The historical data and the potential for significant price appreciation support this view. 

Bitcoin

BTC is trading at $66,100, up 1.6% in the past 24 hours. 

Featured image from Shutterstock, chart from TradingView.com

Ethereum Spot ETFs Approval Skepticism Persists, As ETH Recovers

Ethereum Spot Exchange-Traded Funds (ETFs) approval odds continue to witness notable pessimism as the cryptocurrency space awaits the United States Securities and Exchange Commission’s (SEC) decision on the products scheduled for May.

The expectation surrounding the SEC’s decision highlights how important ETF approval is in terms of giving conventional investors more convenient access to Ethereum’s spot market. Presently, data from Polymarket, the world’s largest prediction market, shows that ETH ETF approval odds have fallen to a mere 11%.

Pessimism Deepens As Ethereum ETFs Remain Uncertain

As the May deadline draws near, doubt and skepticism loom large on the horizon, casting a dark shadow for the products. One of the most recent figures to voice doubts about the SEC’s willingness to approve the exchange-traded products this May is Nate Geraci, the president of ETF Store.

According to Geraci, the regulatory watchdog is eerily silent on Ethereum spot ETFs. He further suggested that the products might not be approved due to the SEC’s significantly lower level of engagement with ETF issuers than in previous interactions.

“Logic says that is correct, but also wonder if SEC learned a lesson from clown show with spot Bitcoin ETFs,” he added. Thus, he has pointed out two possible options for the products, which are either an approval or lawsuit from the Commission.

Commenting on the president’s insights, a pseudonymous X user questioned if there is a possibility that activities are taking place behind closed doors in order to avoid disrupting the pre-launch market. Geraci responded, saying he believes that could be possible, drawing attention to Van Eck CEO Jan Van Eck’s review, which might prove otherwise.

It is worth noting that Van Eck is one of the earliest firms to submit its application for an Ethereum exchange product. Even though the company was the first to file for an application, Jan Van Eck is pessimistic about the approval of the ETPs, saying they will probably be rejected in May.

He stated:

The way the legal process goes is the regulators will give you comments on your application, and that happened for weeks and weeks before the Bitcoin ETFs. And right now, pins are dropping as far as Ethereum is concerned.

In light of this, investors prepare for an unpredictable result while managing market swings and modifying their investment plans in the face of changing regulations.

ETH Price Sees Positive Movement

While Ethereum ETFs might be experiencing negative sentiment, ETH, on the other hand, has witnessed a positive uptick lately. ETH has revisited the $3,000 level again after falling as low as $2,888 during the weekend.

Today, ETH price rose by over 4%, reaching around $3,234, indicating potential for further price recovery. At the time of writing, Ethereum was trading at $3,215, demonstrating an increase of 1.40% in the past day.

Also, the asset’s market cap and trading volume are up by 1.40% and 5.96% in the last 24 hours. Given the anticipated impact of the recently concluded Bitcoin Halving on cryptocurrencies, ETH could be poised for noteworthy moves in the coming months.

Ethereum

Were Bitcoin Miners Behind The BTC Price Crash Below $60,000?

The price of Bitcoin fell drastically towards the $60,000 mark in the days leading up to the just concluded halving. On-chain data has shed light on what could very well be the reason for this price dip in the middle of all the excitement around the halving.

Particularly, data has revealed that some miners have been selling their holdings in the days leading up to the halving event, with the entire BTC holdings of miners hitting a 12-year low. 

Miners’ Bitcoin Holdings Hit 12-Year Low

On-chain analytics platform IntoTheBlock noted this interesting trend amongst Bitcoin miners. According to the platform’s “Miners’ Bitcoin Holdings,” the collective BTC reserve across various miners has now dropped below 1.9 million BTC, its lowest in over 12 years.

Interestingly, the metric shows that miner reserves have been on a continued trend of outflows since the beginning of the year, just after the approval of Spot Bitcoin ETFs. This means the outflow from miner wallets can be linked to increased demand from the various Bitcoin ETF wallets, with the latter now controlling over 4.27% of the total circulating wallets.

At the time of writing, CryptoQuant data puts the total number of miner reserves at 1.818 million BTC, a decrease of 22,000 BTC from 1.84 million on January 3. Additionally, this outflow from the miner reserves was exacerbated in the days leading up to the halving, as noted by IntoTheBlock.

“This indicates that miners have been net sellers leading up to the halving,” IntoTheBlock said in a social media post.

The persistent selling pressure exerted by miners may have been a contributing factor in Bitcoin’s stagnant pace between $65,000 and $70,000 over the past weeks. This outflow of BTC from miner wallets into the market seems to have flooded the market with more than enough BTC, which in turn contributed to a crash to $60,000 during the week.  

What’s Next For Bitcoin?

The practice of Bitcoin miners selling their holdings in the days leading up to the halving is not unusual, as demonstrated by their actions in past halving events. At the time of writing, Bitcoin is trading at $64,978, up 8% after rebounding up at $60,000. The much anticipated fourth Bitcoin halving has now been completed and the industry looks forward to its effect over the next few months. 

The halving is ultimately a balancing act for miners. Although miners’ revenues are cut in half, the reduced Bitcoin supply and possible price increase can help offset some of the losses over time. According to a report, Bitcoin miners could sell up to $5 billion worth of BTC after the halving, with the price of the cryptocurrency potentially falling to $52,000.

Featured image from Pexels, chart from TradingView

Battle For The Halving Block: Bitcoin Users Spend Record $2.4 Million On Block 840,000

With Bitcoin finally completing its fourth-year halving cycle, many users are aggressively competing for halving blocks, paying exorbitant amounts of fees to mine a single block. 

Bitcoin Mining Pool Pays Over $2.4 Million In Block Fees

Earlier today, the 840,000th block was added to the Bitcoin blockchain, triggering the onslaught of the highly anticipated halving event. While the price of BTC did not witness a dramatic change following the halving, transaction fees spiked to unprecedented highs. 

Amidst the massive competition, a mining pool identified as ViaBTC had successfully mined the 840,000th Bitcoin block. Cumulatively, BTC users had spent a staggering $37.7 BTC in mining fees, equivalent to $2.4 million, recording the highest fee ever paid for a Bitcoin block. 

According to reports from mempool, after ViaBTC had produced the 840,000th block, the protocol had initiated an automated reduction of miners’ reward by half, from 6.25 BTC to 3.125 BTC per block. In addition to the fees, ViaBTC had received a total payout of 40.7 BTC, valued at approximately $2.6 million, for mining the historic block.  

While it may seem that Bitcoin miners had thrown caution to the wind by spending over $2.4 million on a single block, the 840,000th block had a major significance within the cryptocurrency space. The historic Bitcoin block is said to hold the first Satoshis, ‘sats,’ the smallest units of BTC following the halving. 

There are several of these “epic sats,” that appear after the halving event, coveted as a rare collector’s item among cryptocurrency enthusiasts. Some even speculate that these Bitcoin fragments could be potentially worth millions of dollars. 

Including the hype surrounding these fragmented BTC, much of the competition for the Bitcoin blocks, following the halving has been attributed to the new Runes Protocol which launched at the same time as the Bitcoin halving. 

Degens Rush To Secure Infamous Rune Tokens

The Runes Protocol, created by Casey Rodamor, a Bitcoin developer, has sent shockwaves through the cryptocurrency community, as degens are avidly competing to etch and mint tokens directly on the Bitcoin network. 

While mining pools were mining new Bitcoin blocks, degens had paid over 78.6 BTC valued at $4.95 million to mint the rarest Runes. This exponential surge in fees has been an unprecedented event, highlighting the increased adoption and participation of the Bitcoin network.

According to reports from Ord.io, a Rune labeled as ‘Decentralized’ was acquired for a fee of 7.99 BTC, equivalent to $510,760. While another titled ‘Dog-Go-To-The-Moon’ was obtained for a fee of 6.73 BTC, worth approximately $429,831.

Leonidas, protocol developer and host of the groundbreaking Ordinals, a system for numbering “epic sats,” has declared the Runes Protocol a remarkable success as degens have “single-handedly offset the drop in miner rewards from the halving.” He concluded that Runes have significantly impacted Bitcoin’s security budget, potentially playing a major role in ensuring the network’s sustainability.

Bitcoin price chart from Tradingview.com (Bitcoin halving)

Fourth Bitcoin Halving Completed – Here Are The Implications

The long-awaited fourth Bitcoin halving finally occurred after BTC posted its 840,000th block. This event is significant as it is expected to have several implications for the Bitcoin ecosystem and the crypto market going forward. 

What To Expect Following The Bitcoin Halving

The Bitcoin halving slashed miners’ rewards from 6.25 BTC to 3.125 BTC for each block mined. This means that Bitcoin miners are set to earn a reduced income of 450 BTC instead of the 900 BTC they earned before the fourth halving. This development is expected to have a dire effect on their operations, as NewsBTC reported that they could lose a whopping $10 billion following the halving.  

While the effects of the halving are not so pleasant for BTC miners, the halving is deemed necessary for the growth of the Bitcoin ecosystem. It makes Bitcoin (BTC) deflationary by reducing the rate at which more tokens come into circulation. This could make the flagship crypto more scarce and ultimately drive up its value, as it has done in the past three halvings

In anticipation of history repeating itself, crypto analysts and experts have made several predictions about how high Bitcoin could rise this time post-halving. So far, the most bullish price prediction remains by Samson Mow, the CEO of Jan3 and Bitcoiner, who predicts that the flagship crypto could rise to $1 million this year. 

He added that this unprecedented price surge was possible considering that BTC’s demand is expected to continue outpacing the supply, with more institutional investors recently getting on board through the Spot Bitcoin ETFs. The imbalance between Bitcoin’s supply and demand is also why crypto analyst MacronautBTC believes Bitcoin could rise to $237,000. 

Billionaire Tim Draper also agrees that Bitcoin could attain such heights based on his prediction that the flagship crypto will hit $250,000 in 2025. 

Implications On The Broader Crypto Market

Crypto analyst Michaël van de Poppe recently predicted a narrative shift post-halving. He expects Bitcoin to take months to consolidate while altcoins significantly move to the upside during this period. This is plausible, considering Bitcoin doesn’t experience that parabolic price surge until about six months after the halving. 

During this period, altcoins like XRP and Cardano (ADA), which have underperformed up until now, will be closely monitored as investors wait to see if they will show any sign of bullish momentum in them. Ethereum (ETH) will also be the focus of many in the crypto community as they watch how the second-largest crypto token by market cap will perform while Bitcoin (BTC) consolidates. 

Interestingly, Van de Poppe expects the narrative to shift to Ethereum and projects in the Decentralized Physical Infrastructure Networks (DePIN) and Real World Assets (RWA) sector. Therefore, such projects are also worth keeping an eye on. 

Bitcoin price chart from Tradingview.com (Bitcoin halving)

Bitcoin Halving: Anticipating Price Impact, Miner Challenges, And Long-Term Outlook

The highly anticipated Bitcoin Halving event is close, bringing with it heightened expectations regarding the long-term impact on the Bitcoin price. 

There are concerns, however, that this quadrennial event may already be priced in, as Bitcoin recently reached an unprecedented all-time high of $73,700 on March 14.

This surge broke the pattern of previous Halvings, where Bitcoin had never surpassed its previous ATH before the event. However, historical data reveals significant price increases in the year following previous Halvings.

Experts Predict Delayed Bitcoin Halving Price Impact

Analysts argue that the compounding impact of reduced issuance takes several months to materialize, suggesting that the Halving itself may not prompt a significant rally before or immediately after the event. 

Deutsche Bank analysts share this sentiment, highlighting that substantial price increases have typically occurred in the run-up to previous Halvings rather than immediately after them.

Another factor to consider is the increased production costs for Bitcoin miners resulting from the Halving. As the mining reward decreases, participating in the mining process becomes less profitable. 

This has historically led to a decline in the hashrate, the total computational power used for Bitcoin mining. JPMorgan analysts predict that production costs could rise to an average of $42,000 after the Halving.

One JPMorgan analyst wrote, “This estimate is also the level we envisage Bitcoin prices drifting towards once Bitcoin-Halving-induced euphoria subsides after April.”

While these factors may influence short-term price movement, historical data reveals that the price of Bitcoin has experienced significant increases in the year following previous Halvings. 

The respective price gains for the three previous halvings were 8,760%, 2,570%, and 594%. However, it’s important to note that each successive halving has a diminishing impact on the new supply of Bitcoin.

Mining Industry Shake-Up

In the mining sector, Halving could lead to significant revenue losses, estimated to be around $10 billion annually. 

According to Fortune, publicly traded miners have taken measures to increase their resilience, diversify their offerings, and optimize their operations. However, mining stocks have faced challenges, with some experiencing significant declines.

While larger miners may undergo a period of adjustment, smaller miners and pools may be pushed offline. This could result in a wider market share for the surviving miners. 

Experts at private asset management firm Bernstein expect the mining industry to consolidate, with “smaller and less efficient players” potentially selling assets to raise capital and shore up their balance sheets. 

The increased market dominance of the surviving miners is expected to be profitable over the long term, especially with the continued structural demand for Bitcoin from ETFs.

Timing The Bitcoin Bull Market Peak

Cryptocurrency analyst Rekt Capital has provided insights into the potential timing of Bitcoin’s bull market peak based on historical Halving cycles and the current acceleration seen in the market. 

According to Rekt Capital, Bitcoin has traditionally reached its peak in the bull market approximately 518-546 days after the Halving event.

However, the current cycle has shown signs of unprecedented acceleration, with Bitcoin surpassing previous all-time highs roughly 260 days ahead of historical norms. Nonetheless, the recent “pre-Halving retrace” has slowed down the cycle by around 30 days and counting.

Taking into account this accelerated perspective, if Bitcoin’s bull market peak is measured from the moment it breaks its old all-time high, it may occur 266-315 days later. As Bitcoin achieved new all-time highs in March, this suggests a potential bull market peak in December 2024 or February 2025, according to Rekt’s analysis.

Both perspectives carry significance throughout the cycle, especially if the acceleration trend persists. However, prolonged retracements or consolidation periods can slow down the cycle, potentially pushing the anticipated bull market peak further into the future.

Bitcoin Halving

At the time of writing, BTC was trading at $64,300, up from the $59,000 mark reached in the early hours of Friday.

Featured image from Shutterstock, chart from TradingView.com 

Bitcoin’s Next Move Revealed: Trading Guru Reveals This Cryptic Chart Pattern, Here’s What It Says

Legendary trader Peter Brandt has recently shared notable insights into the potential future trajectory of Bitcoin price, suggesting the possibility of a significant market move for the crypto asset.

This insight comes as Bitcoin appears to be recovering slightly from its week-long decline. The asset is up nearly 5% over the past 24 hours, with a current trading price of $64,968 at the time of writing.

Bitcoin Next Move According To This Chart Pattern

Brandt’s analysis, presented through a series of charts, outlines a distinctive pattern in Bitcoin’s historical price behavior, characterized by three distinct phases.: the Hump-Slump, Bump-Rump, and Pump-Dump cycles.

As per Brandt’s observation, while Bitcoin has completed the initial two phases of the cycle, the third phase, marked by the “pump” component, remains unfulfilled, hinting at potential bullish momentum ahead.

Meanwhile, amid heightened market volatility and uncertainty, Bitcoin has faced notable price fluctuations, experiencing a nearly 10% decline over the past week.

However, recent bullish momentum has seen the cryptocurrency surging by 3.7% in the past 24 hours, with its price briefly climbing above $65,000 after hitting a 24-hour low of $60,000.

Bitcoin (BTC) price chart on TradingView

This upward movement aligns with Brandt’s suggestion of a pending bullish phase in Bitcoin’s price cycle, adding weight to the anticipation of a potential market “pump.”

Insights From Industry Leaders And Analysts

In addition to Brandt’s analysis, industry leaders and analysts have offered their perspectives on Bitcoin’s future trajectory.

Anthony Scaramucci, founder and managing partner of Skybridge Capital, has recently projected a bullish outlook for Bitcoin, forecasting a potential price surge to $200,000 following the upcoming halving event.

Scaramucci cited various factors, including the influence of new financial products like spot ETFs and increasing institutional interest, as key drivers behind Bitcoin’s anticipated price appreciation.

However, amidst optimistic forecasts, CryptoQuant, a prominent crypto analytics platform, has cautioned that Bitcoin could face a significant downturn to $52,000 if its price breaches the critical $60,000 support level.

A CryptoQuant analyst particularly noted:

If the price breaks below $60,000, we might witness a decline to $52,000 before a subsequent rise. However, given the significant dominance of institutional ETFs, I wouldn’t be surprised if they accumulate excess supply from liquidations near the short-term support level of $60,000.

Featured image from Unsplash, Chart from TradingView

Crypto Expert Predicts A Narrative Shift Post-Bitcoin Halving

Crypto expert Michaël van de Poppe has provided insights into what to expect when the Bitcoin halving occurs on April 19. As part of his analysis, van de Poppe suggested that the attention might shift from Bitcoin once the event occurs. 

A Narrative Shift To Occur Post-Halving

Van de Poppe mentioned in an X (formerly Twitter) post that narratives will change as the halving event approaches but failed to specify what the new narrative will be when this happens. However, in a previous X post, the crypto expert laid out some of his expectations for the crypto market going forward, which included what he expected the new narrative to be. 

According to Van de Poppe, the narrative will shift to Ethereum (ETH) and projects that are focused on Decentralized Physical Infrastructure Networks (DePIN) and Real World Assets (RWA). These sectors, along with Artificial Intelligence (AI) and meme coins, have been projected to be among the leading narratives in this bull run. 

Meanwhile, the crypto expert, who has so far continued to state that altcoins are greatly undervalued, expects these crypto tokens to bounce “in their Bitcoin pairs” once the hype around the halving is over. Furthermore, Van de Poppe mentioned that altcoins will show bullish strength from this second quarter until the summer after which a correction will come in the third quarter of the year.

Before now, the crypto expert listed ten altcoins he believes could make the most price gains when the altcoin season begins in full force. These tokens include Chainlink (LINK), Celestia (TIA), Arbitrum (ARB), Polkadot (DOT), Cosmos (ATOM), DYDX (DYDX), WooNetwork (WOO), Sei (SEI), Skale Network (SKL), and Covalent (CQT). 

Expectations For Bitcoin

In the short term, Van de Poppe expects Bitcoin to experience a relief bounce to around $70,000. However, he didn’t sound so bullish about the flagship crypto’s long-term trajectory, predicting that Bitcoin will face a period of consolidation that he doesn’t expect to change in the “coming months.”

In another X post, he said, “It’s a waiting game on Bitcoin currently, as momentum is relatively gone.” He added that he expects Bitcoin to continue “the retracement and consolidation,” while altcoins will bounce up in their BTC pairs during this period. 

This predicted consolidation period looks to be the re-accumulation phase in the stages of Bitcoin halving, which crypto analyst Rekt Capital once referred to. Elaborating on what this period is like, Rekt Capital stated back then that many investors get “shaken out in this stage due to boredom, impatience, and disappointment with lack of major results in their BTC investment in the immediate aftermath of the Halving.”

Once this period is over, Bitcoin is expected to make its “parabolic uptrend,” a phase that Rekt Capital noted historically lasts just over a year. In line with this, it is worth noting that most of Bitcoin’s price gains usually come between six months to a year after the Bitcoin halving has occurred. 

Bitcoin price chart from Tradingview.com

Bitcoin Halving Could Catalyzed $100,000 Price Surge: Bitwise CEO

As the cryptocurrency community excitedly awaits the impending Bitcoin halving, Bitwise Chief Executive Officer (CEO) Hunter Horsley has weighed in on its impact on BTC, predicting that the event could potentially propel prices to $100,000 or even higher.

Horsley expressed his optimistic outlook toward the upcoming Bitcoin Halving on the X (formerly Twitter) platform. Every four years, the Halving has historically been linked to greater price increases, and Horsley’s upbeat view indicates that this cycle might be no different from the others.

Upcoming Bitcoin Halving Is Being Underestimated

According to the CEO, the much-anticipated event is presently being significantly underestimated in the crypto space. He claims that the market has never priced in it in the past, and it will not be priced in this time either, expressing his confidence toward the occasion.

Horsley highlighted the historical relevance and transformative implications of these occurrences, drawing comparisons with past Halvings and citing the notable profits that investors achieved in 2020, 2016, and 2012. He stated that following months of debate by investors on whether the previous three halvings were priced in, Bitcoin grew by 5.4x, 2.8x, and 88x, respectively.

Given the past price developments, the Bitwise CEO anticipates this Halving to serve as a catalyst for the $100,000 target for BTC. Horsley’s prediction seems very reasonable since the figure is just about a 47% increase from the digital asset’s current price.

It is worth noting that the opinions of fully deployed current holders are not used to measure the impact of the Halving. Rather, it depends on whether there will be a significant and sustained increase in demand in addition to the daily decrease in the supply of natural sellers. 

In all, the Bitwise CEO foresees a steady growth in demand along with the conditions for a substantial Halving event this year. As investors prepare for the possible impact of this historic occasion on Bitcoin’s price trajectory, this audacious prognosis highlights the possibility of massive price increases not only in BTC but the entire cryptocurrency market.

BTC Move Into No Man’s Land

With the Halving less than 24 hours away, Cold Blooded Shiller, a cryptocurrency analyst, has reported that Bitcoin has entered No Man’s Land. “There are some interesting discussion points on BTC right now, but we have just entered No Man’s Land,” he stated.

According to Shiller, until one of the two green zones highlighted in his chart is contacted, he believes the price action is far more unpredictable. Nonetheless, there are some interesting links here for former price action and Relative Strength Index (RSI).

The analyst claimed the RSI is currently resetting on the Higher Time Frame (HTF), and the last time it occurred was back in January, following a similar breakdown from consolidation seen now.

While Shiller does not think the results will be the same this time, it’s quite reasonable if no recovery happens due to this degree of loss.

Bitcoin

Bitcoin Miners Always Sell Into Halvings, Is This Time Any Different?

On-chain data shows Bitcoin miners have always sold as Halvings have occurred. With the next one just around the corner, how are miners behaving this time?

Next Bitcoin Halving Is Less Than Two Days Away Now

In a CryptoQuant Quicktake post, an analyst discussed Bitcoin miners’ behavior in the build-up to the next Halving.

The “Halving” is a periodic event on the Bitcoin network where the cryptocurrency’s block rewards (the compensation miners receive for solving blocks) are permanently slashed in half.

This event occurs approximately every four years, and according to NiceHash’s countdown, the next one will occur in just over 32 hours.

Bitcoin Halving

Bitcoin miners earn revenue from two sources: transaction fees and block rewards. Historically, the former has been quite low on the BTC network, so the miners primarily depend on the latter to pay off their running costs.

Since the block rewards are cut in half during Halvings, these events naturally deal a significant blow to the miner’s revenues. As such, it’s not surprising that the miners have generally shown a reaction to the event in the past cycles.

“One of the common dynamics that occur in every cycle of cutting the issuance of new BTC is the significant selling pressure exerted by miners,” says the quant. One way to gauge the degree of selling pressure coming from these chain validators is via the Miner to Exchange Flow metric.

This indicator tracks the total amount of Bitcoin moving from miner-associated addresses to wallets connected to centralized exchanges. As miners usually deposit Bitcoin to these platforms for selling, this flow can provide hints about their selling behavior.

Now, here is a chart that shows the trend in the 30-day moving average (MA) BTC Miner to Exchange Flow over the last few years:

Bitcoin Miner to Exchange Flow

As displayed in the above graph, the 30-day MA Bitcoin Miner to Exchange Flow had surged to high levels in the 2020 Halving event, implying that this group had potentially been participating in a selloff.

This selling push may have come from the miners planning to exit, given the sharp revenue reduction that was set to occur. The graph, though, clearly shows that no such selling pressure has emerged this time around despite the event being just around the corner.

So, what’s going on here? The analyst suggests that the Bitcoin miners may have already completed the latest round of selling in advance (as the exchange inflows from the cohort did spike in February). If this is true, the quant thinks this could benefit the market in the short term.

BTC Price

Bitcoin has continued to move sideways inside a range recently, as its price is still trading around $63,500.

Bitcoin Price Chart

Bitcoin: Expect The Unexpected – Analyst Sees Unconventional Bull Run Post-Halving

Bitcoin has been moving lower ahead of the Halving event, going against analysts’ expectations. This price action has been unexpected and shows how the coin tends to go against predictions, basically charting its path. 

Bitcoin Breaking The Mold

In light of Bitcoin’s randomness, especially in the past few months following the approval of spot exchange-traded funds (ETFs), one analyst expects the coin to continue defying expectations by clocking in a bull run that defies historical trends.

4-year simple moving average for Bitcoin | Source: Analyst on X

The analyst cites two recent instances where Bitcoin defied expectations to justify this bullish outlook. First, following the rapid expansion in the 2020 to 2021 bull run that saw Bitcoin soar from less than $10,000 to fresh all-time highs of around $70,000, prices sharply contracted in 2022. 

Then, the United States Federal Reserve shifted its monetary policy to curb raging inflation by rapidly increasing interest rates. Following this and other market-related events, Bitcoin prices dipped below the all-time high of the previous cycle of $20,000.

By November 2022, prices fell to as low as $15,000, accelerated by the collapse of FTX. This retest of previous highs and fall below $20,000 had never happened before. 

Another anomaly occurred last month. For the first time, Bitcoin prices expanded and broke the previous all-time highs of around $70,000 before the Halving event. As Bitcoin’s past price action shows, prices only rally to fresh all-time highs after Halving.

However, this changed when BTC soared to $73,800, possibly paving the way for bulls to join in and push the coin back to unchartered territory post-Halving. 

Is BTC Ready For A Multi-Year Rally?

With this in mind, the analyst believes Bitcoin will continue uniquely shaping its path, deviating from history. For instance, the analyst thinks BTC will outperform altcoins in the coming months.

The analyst adds that increased regulatory scrutiny following high-profile collapses like FTX and Luna could dampen altcoin enthusiasm. 

The coin will ride on the fact that it is the only one with an ETF from the United States SEC receiving investments. As a result of this capital injection, Bitcoin will likely register a multi-year “up only” phase, just like gold did once its ETF was approved.

Bitcoin price trending sideways on the daily chart | Source: BTCUSDT on Binance, TradingView

Prices remain depressed ahead of this. Though prices are increasing at spot rates, the coin is within a bear formation. Currently, BTC has local resistance at around $65,000.