Bitcoin Long-Term Holders Buy The Blood, Snatch Up 70,000 BTC

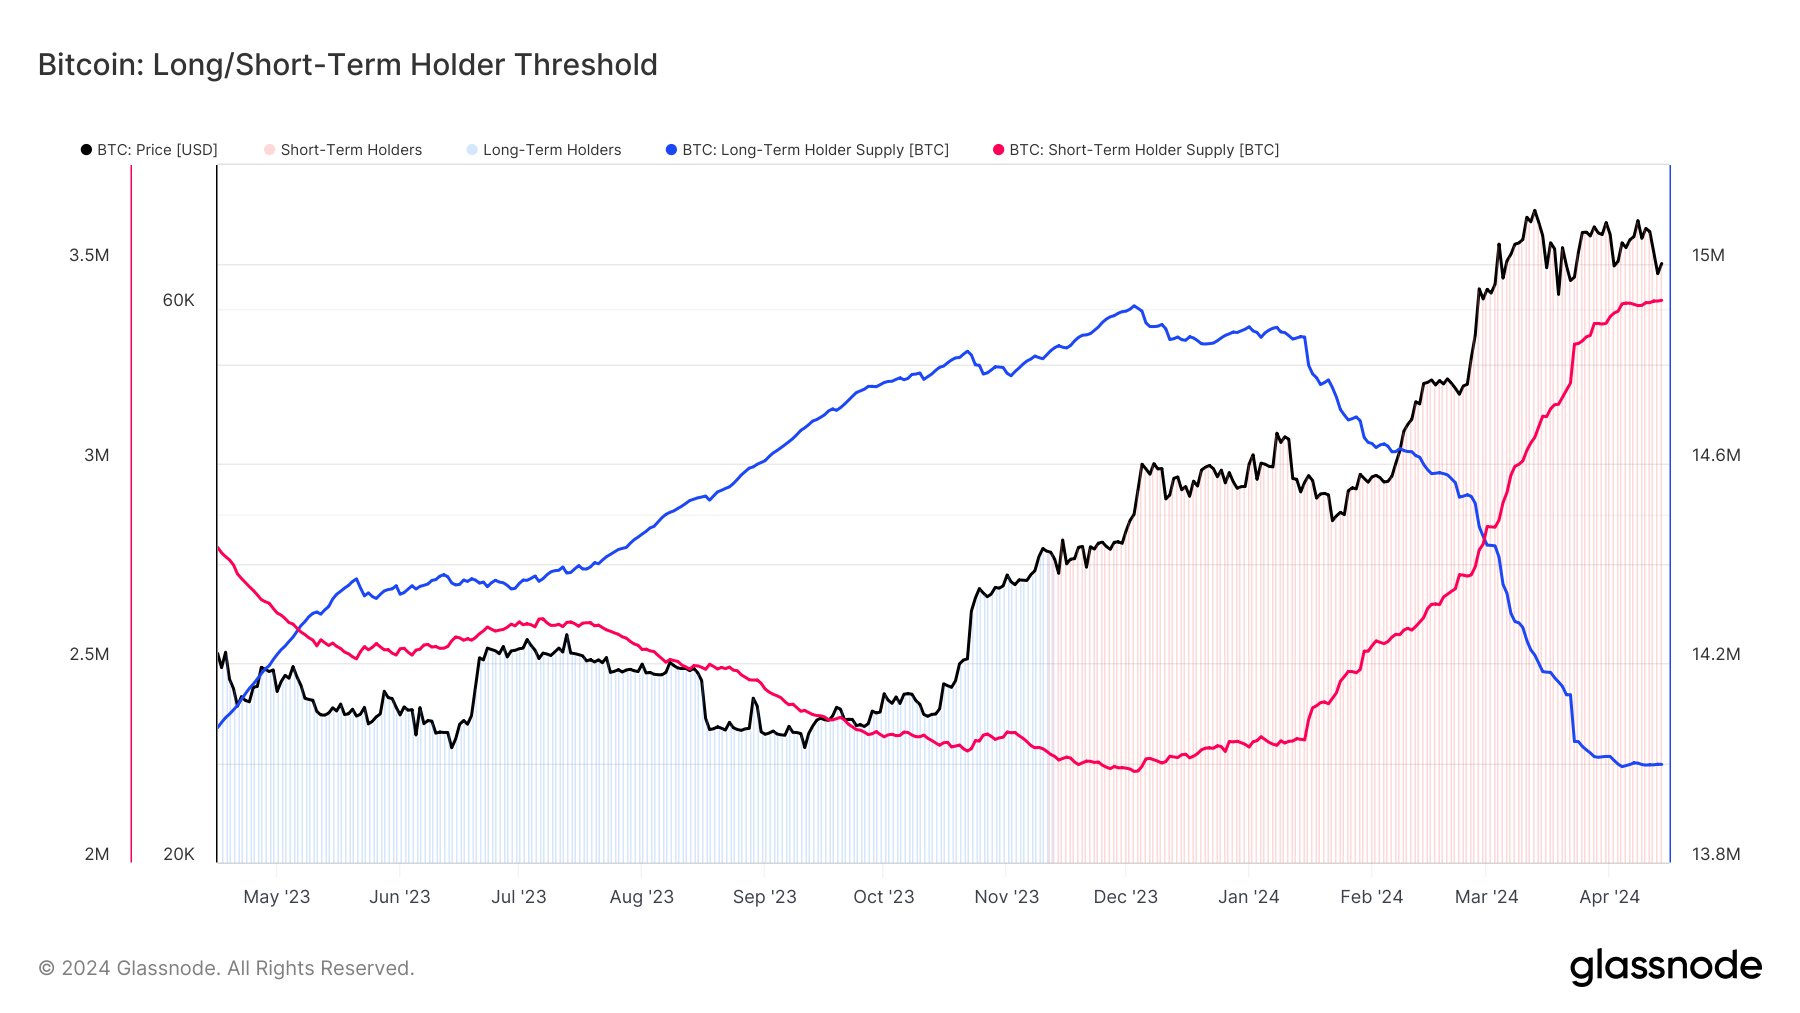
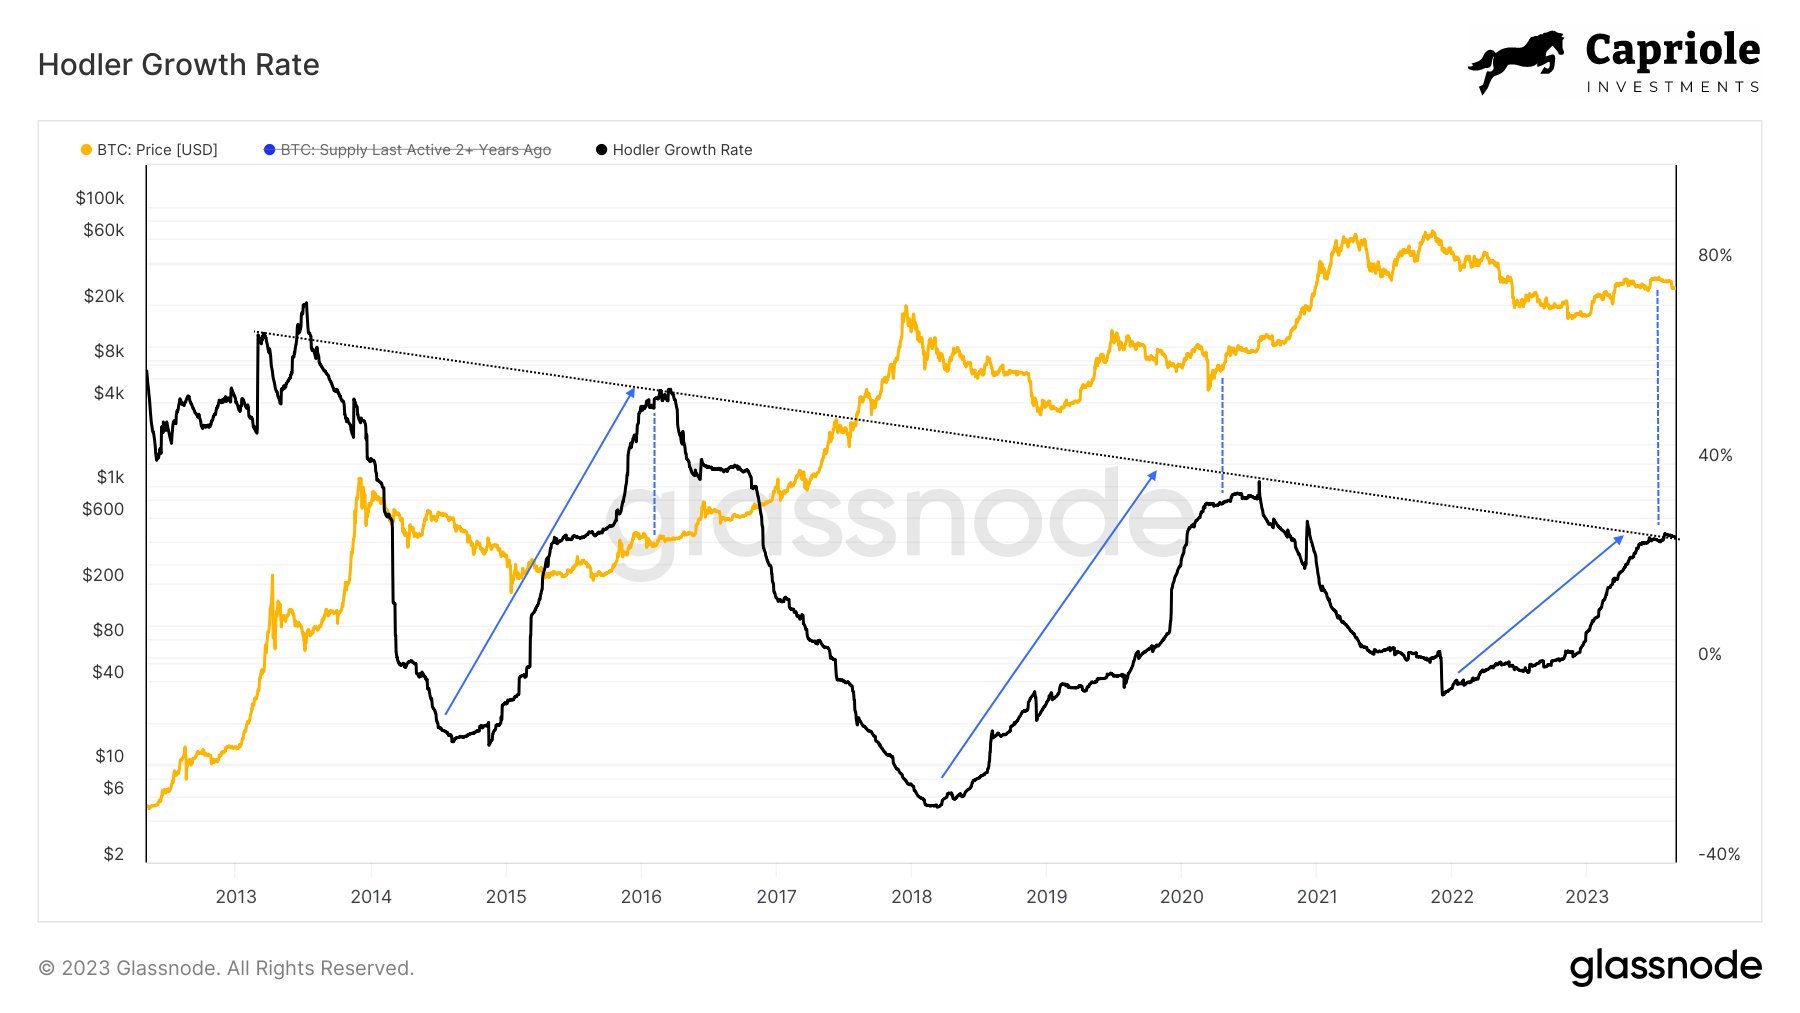
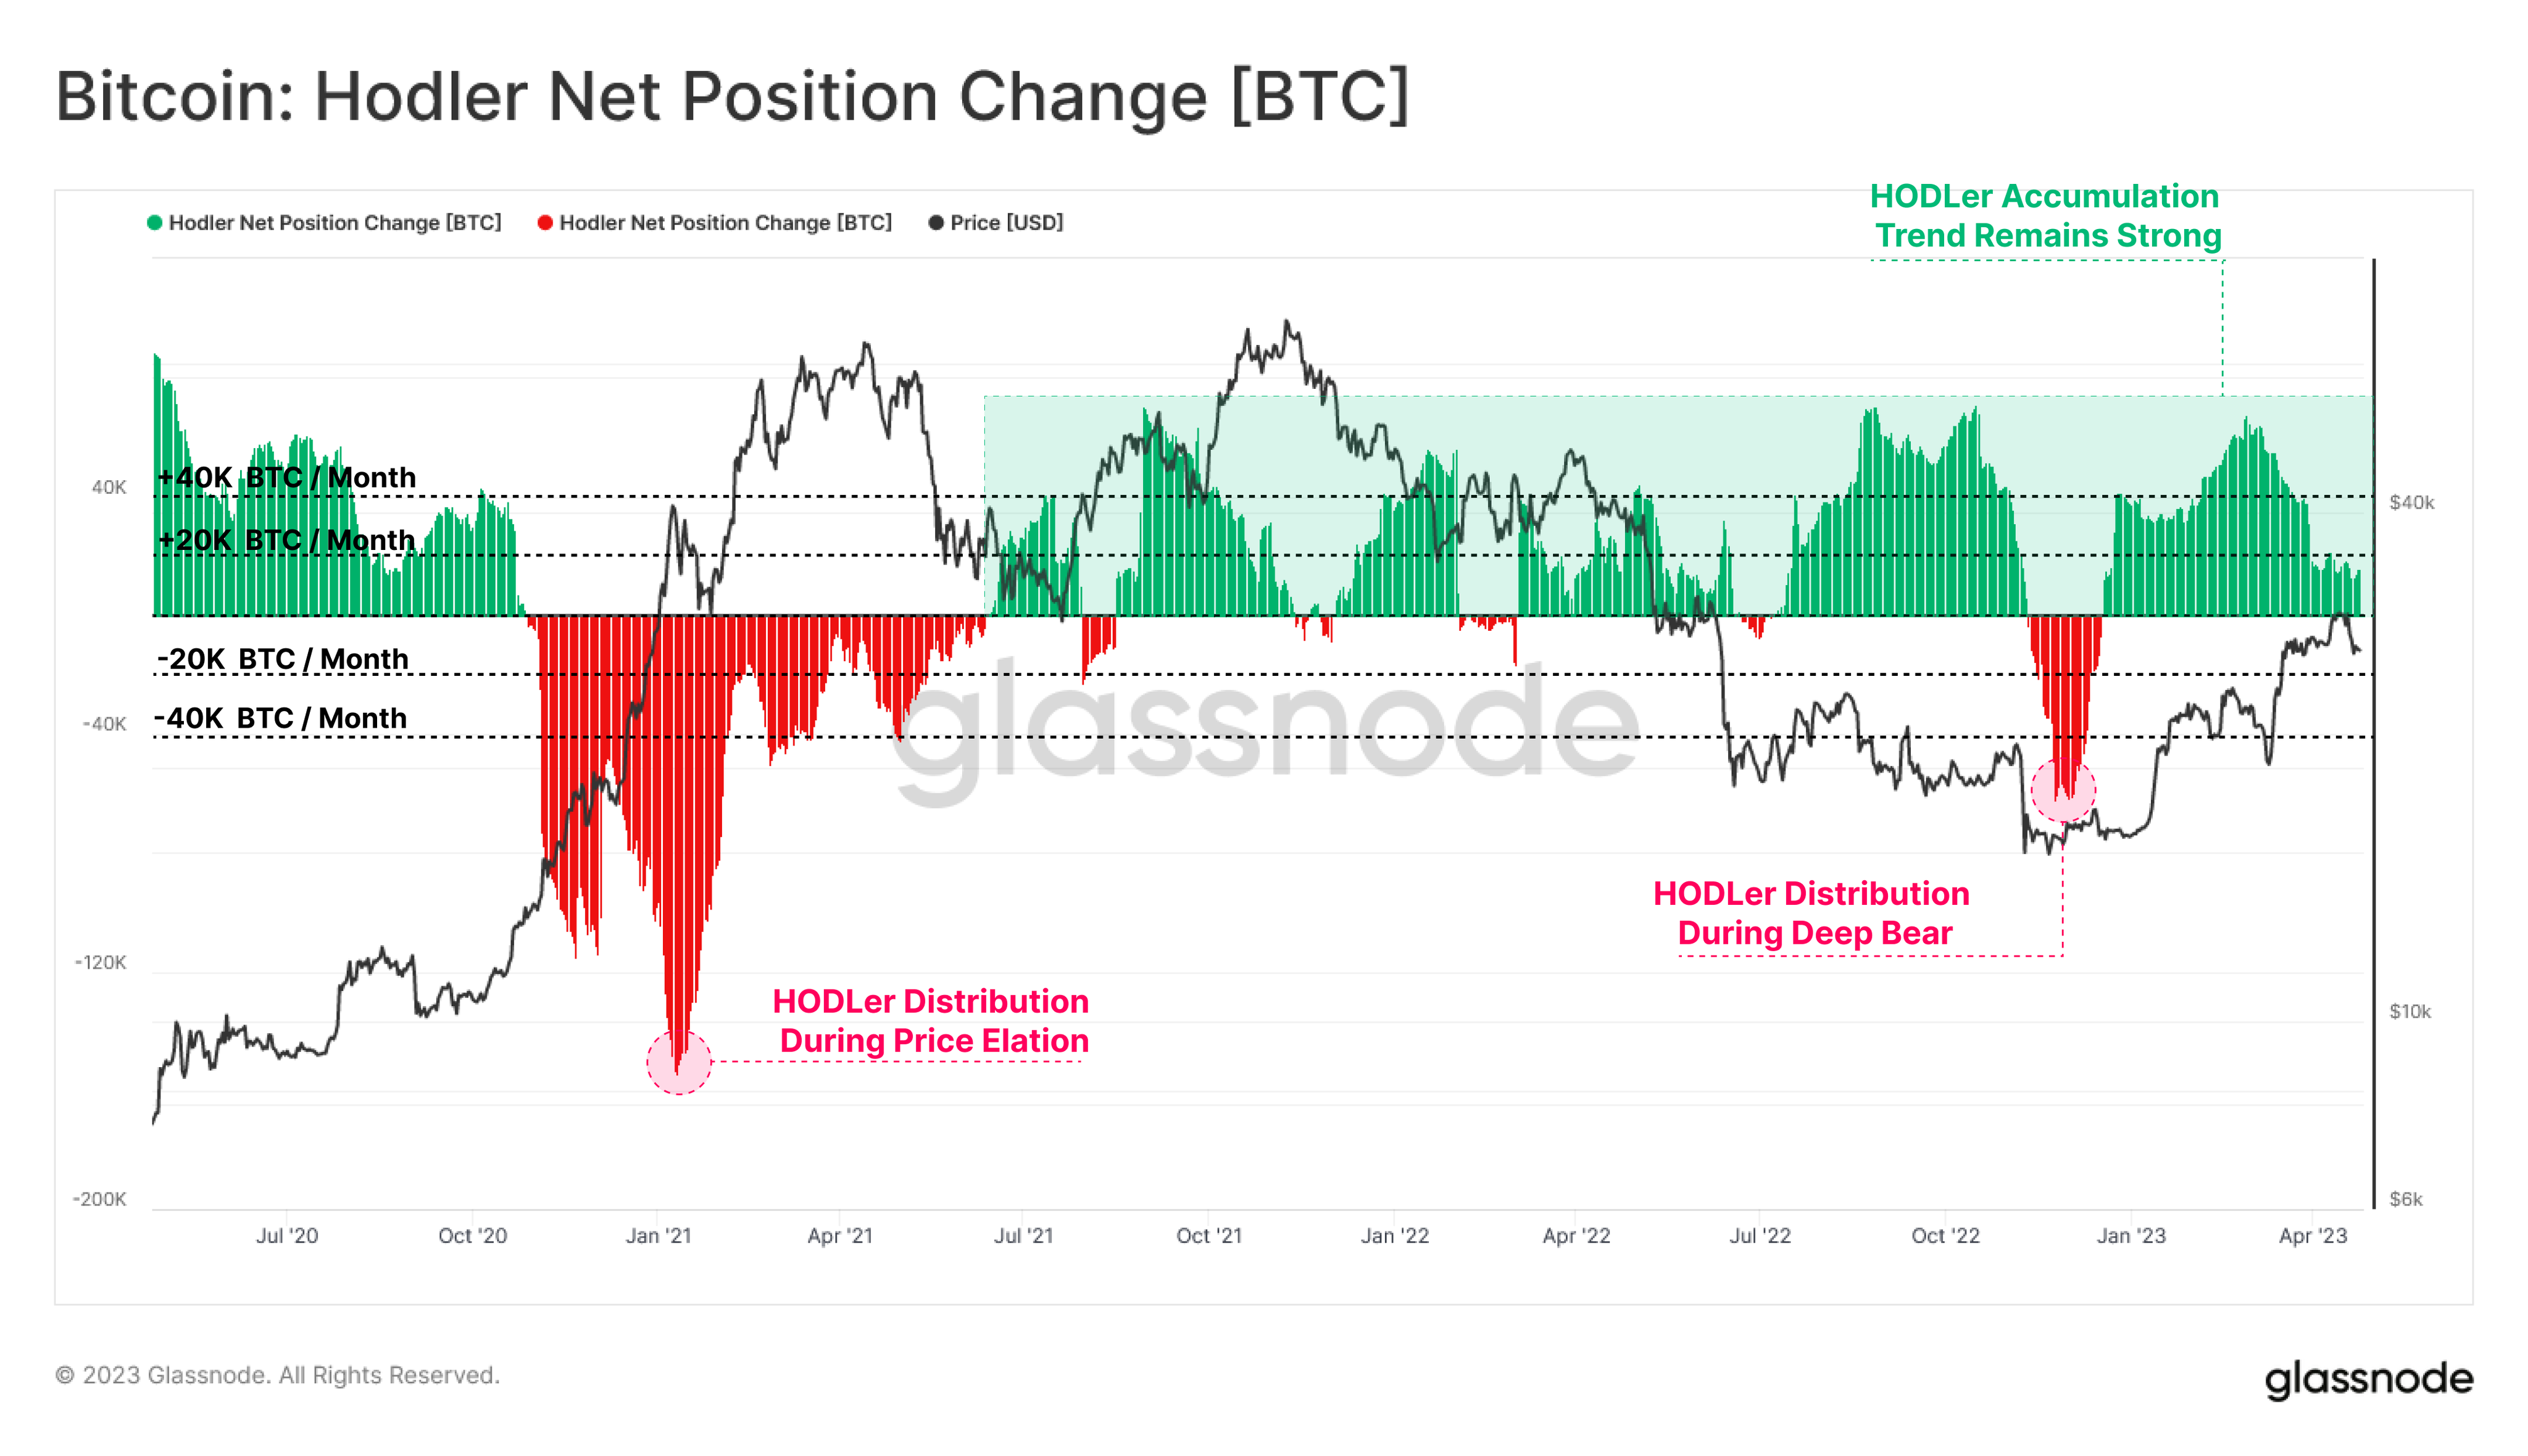
Glassnode data has revealed that Bitcoin long-term holders are taking advantage of the cryptocurrency’s lower price to significantly increase their holdings. This accumulation further strengthens the belief that this group of Bitcoin investors anticipate a potential upside for Bitcoin despite its recent volatility. 

Long-Term Holders Pay $4.3 Billion For 70,000 BTC

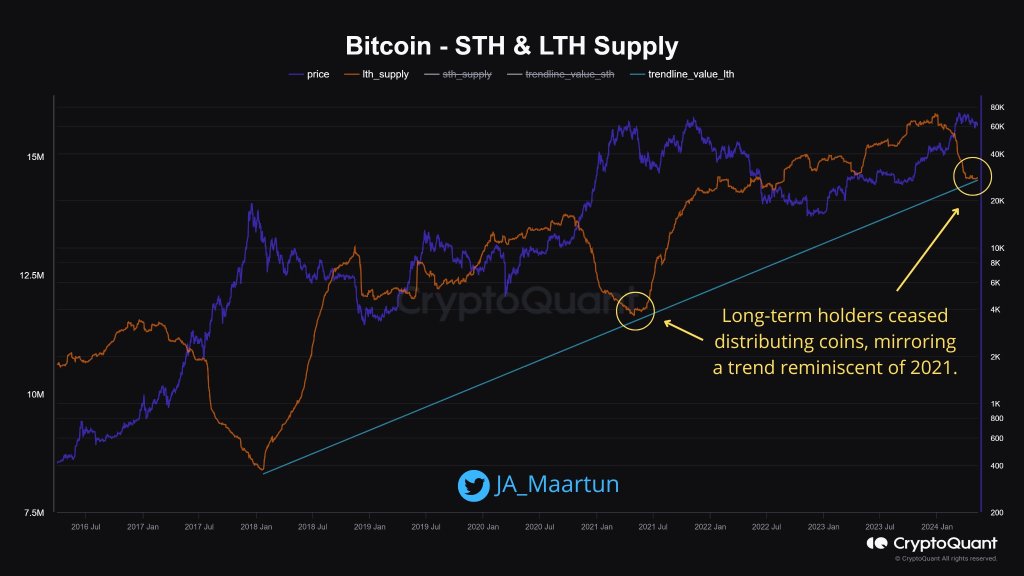
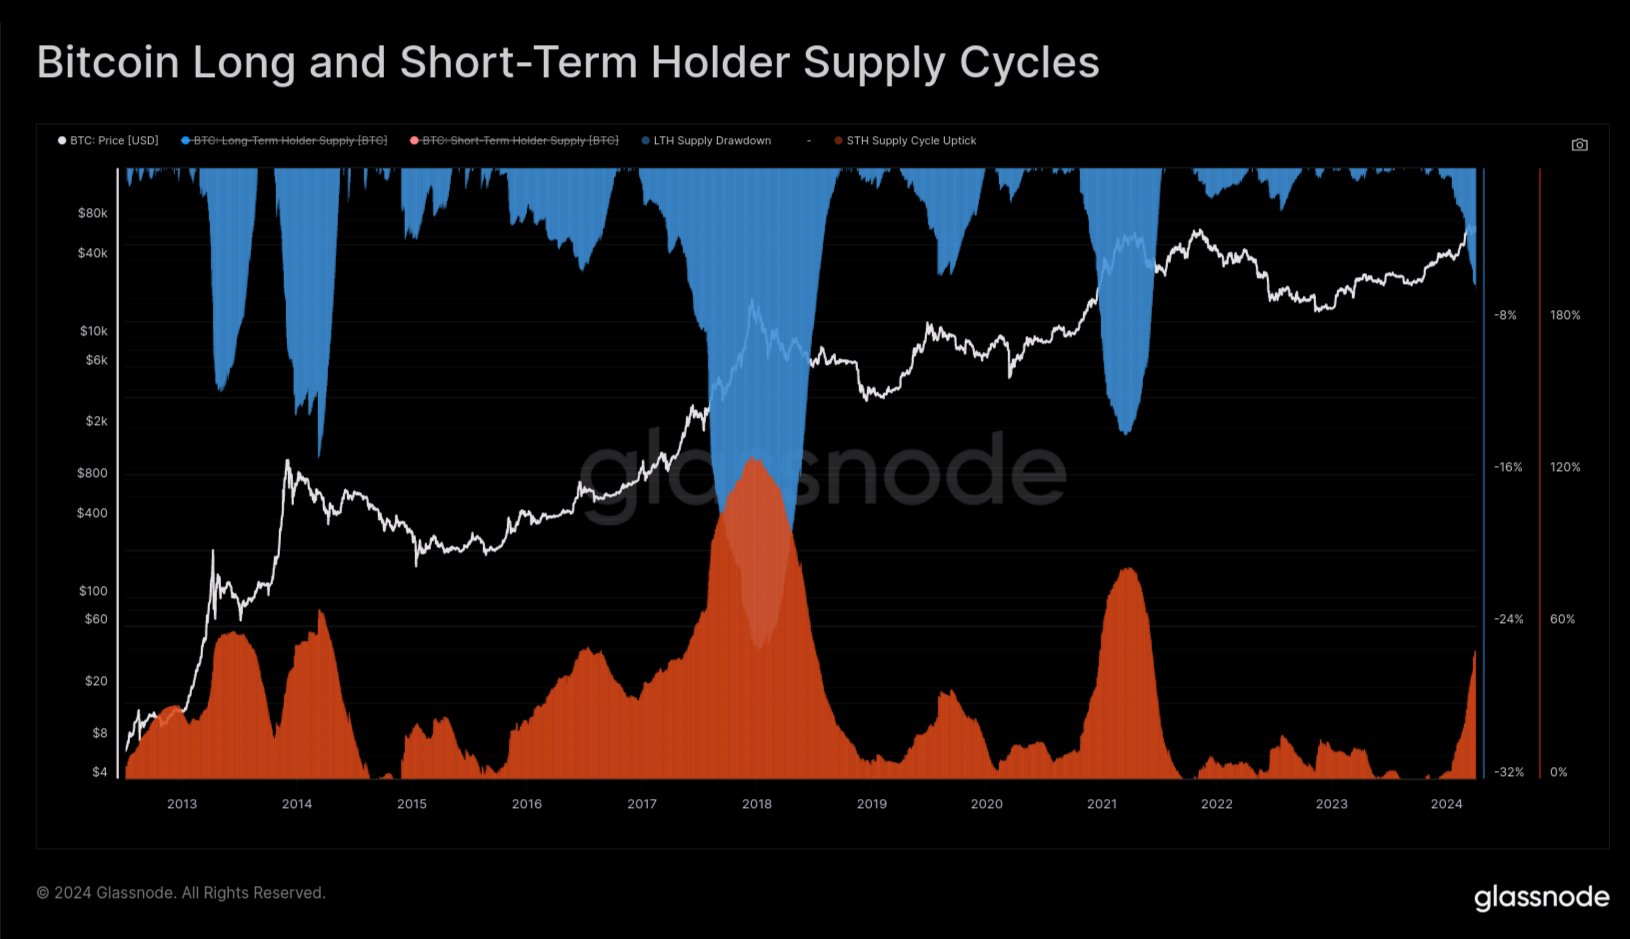
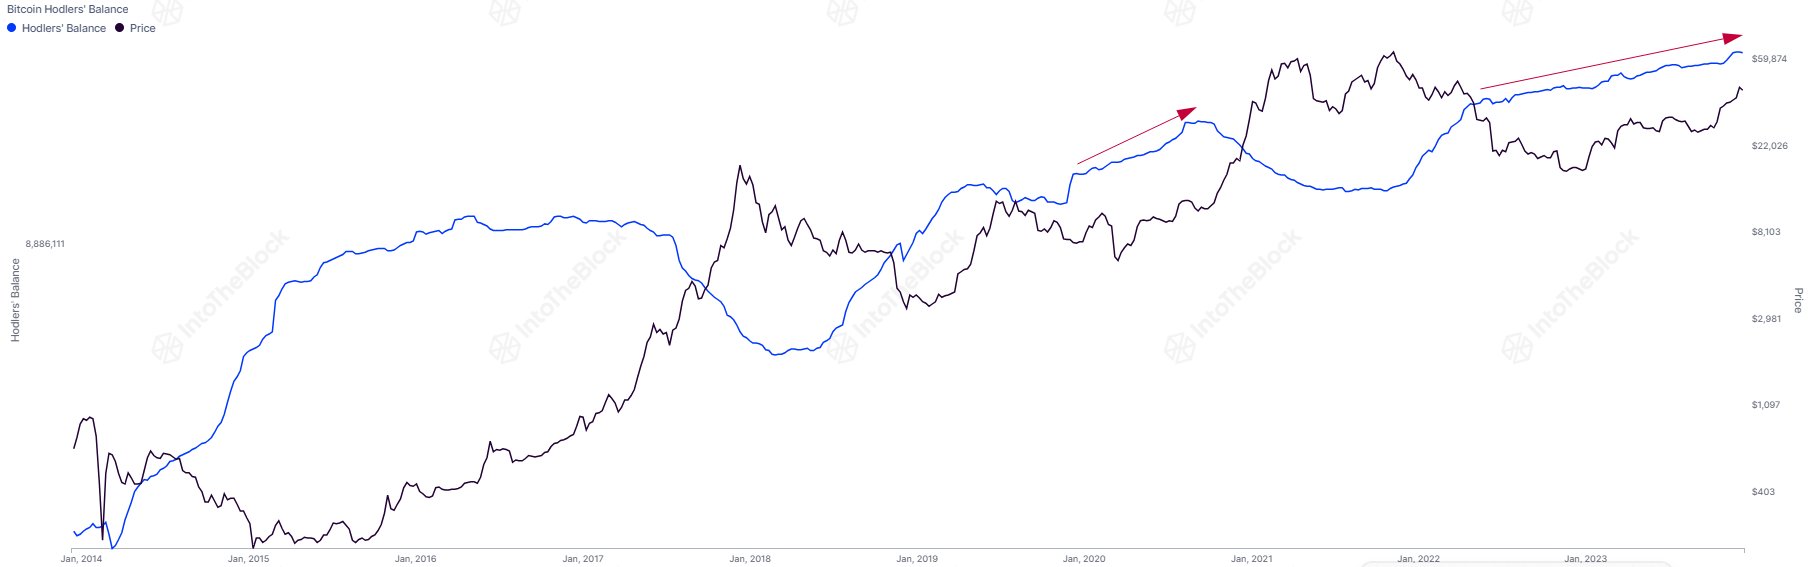
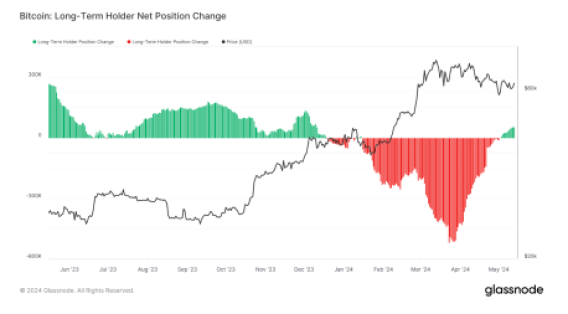
According to Glassnode, long-term Bitcoin holders who had previously sold 1 billion BTC in the latter part of 2023 are accumulating once again. This buying activity could be interpreted as a potential bullish signal for Bitcoin. 

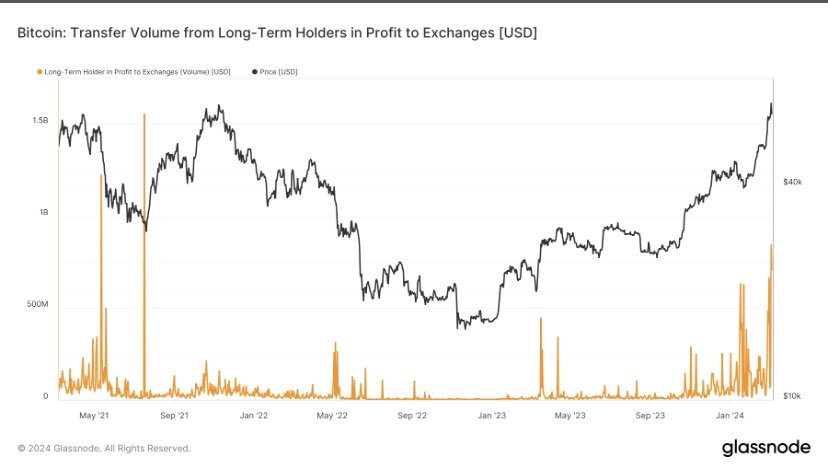
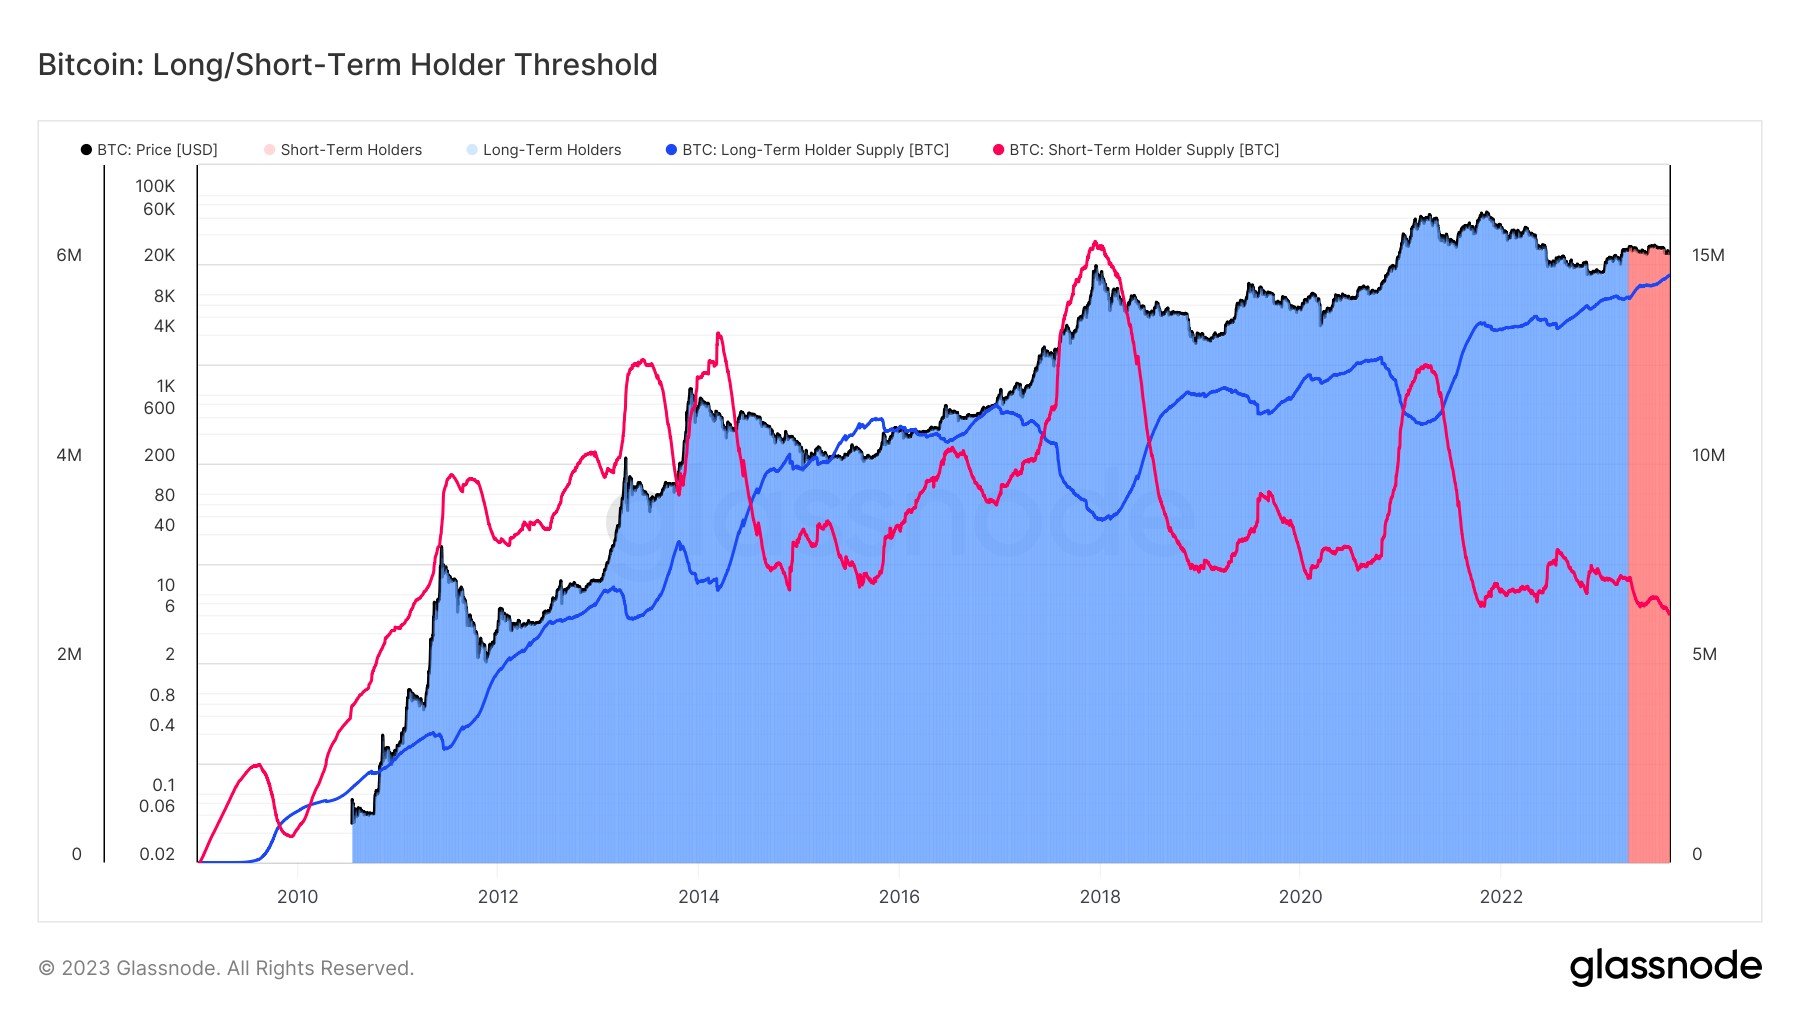
Traditionally, Bitcoin long-term holders sell their holdings during peak prices and buy new tokens during periods of correction or substantial declines. When these seasoned investors buy cryptocurrencies during market lows, it usually indicates their expectations of a potential rebound, leading to profits. 

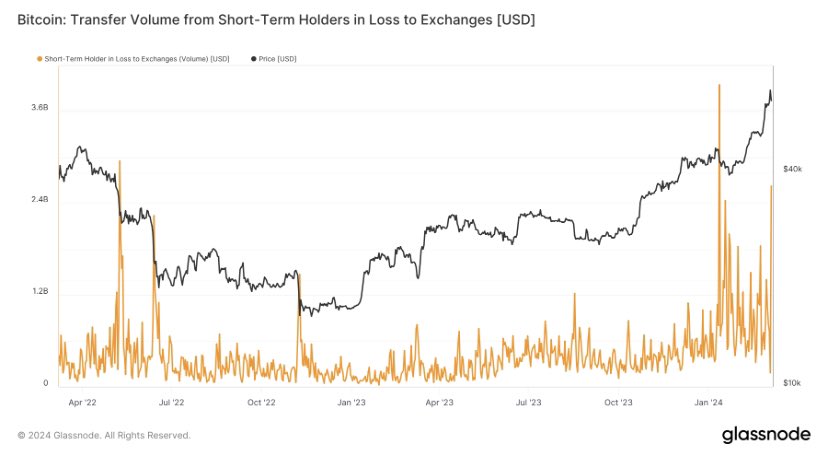
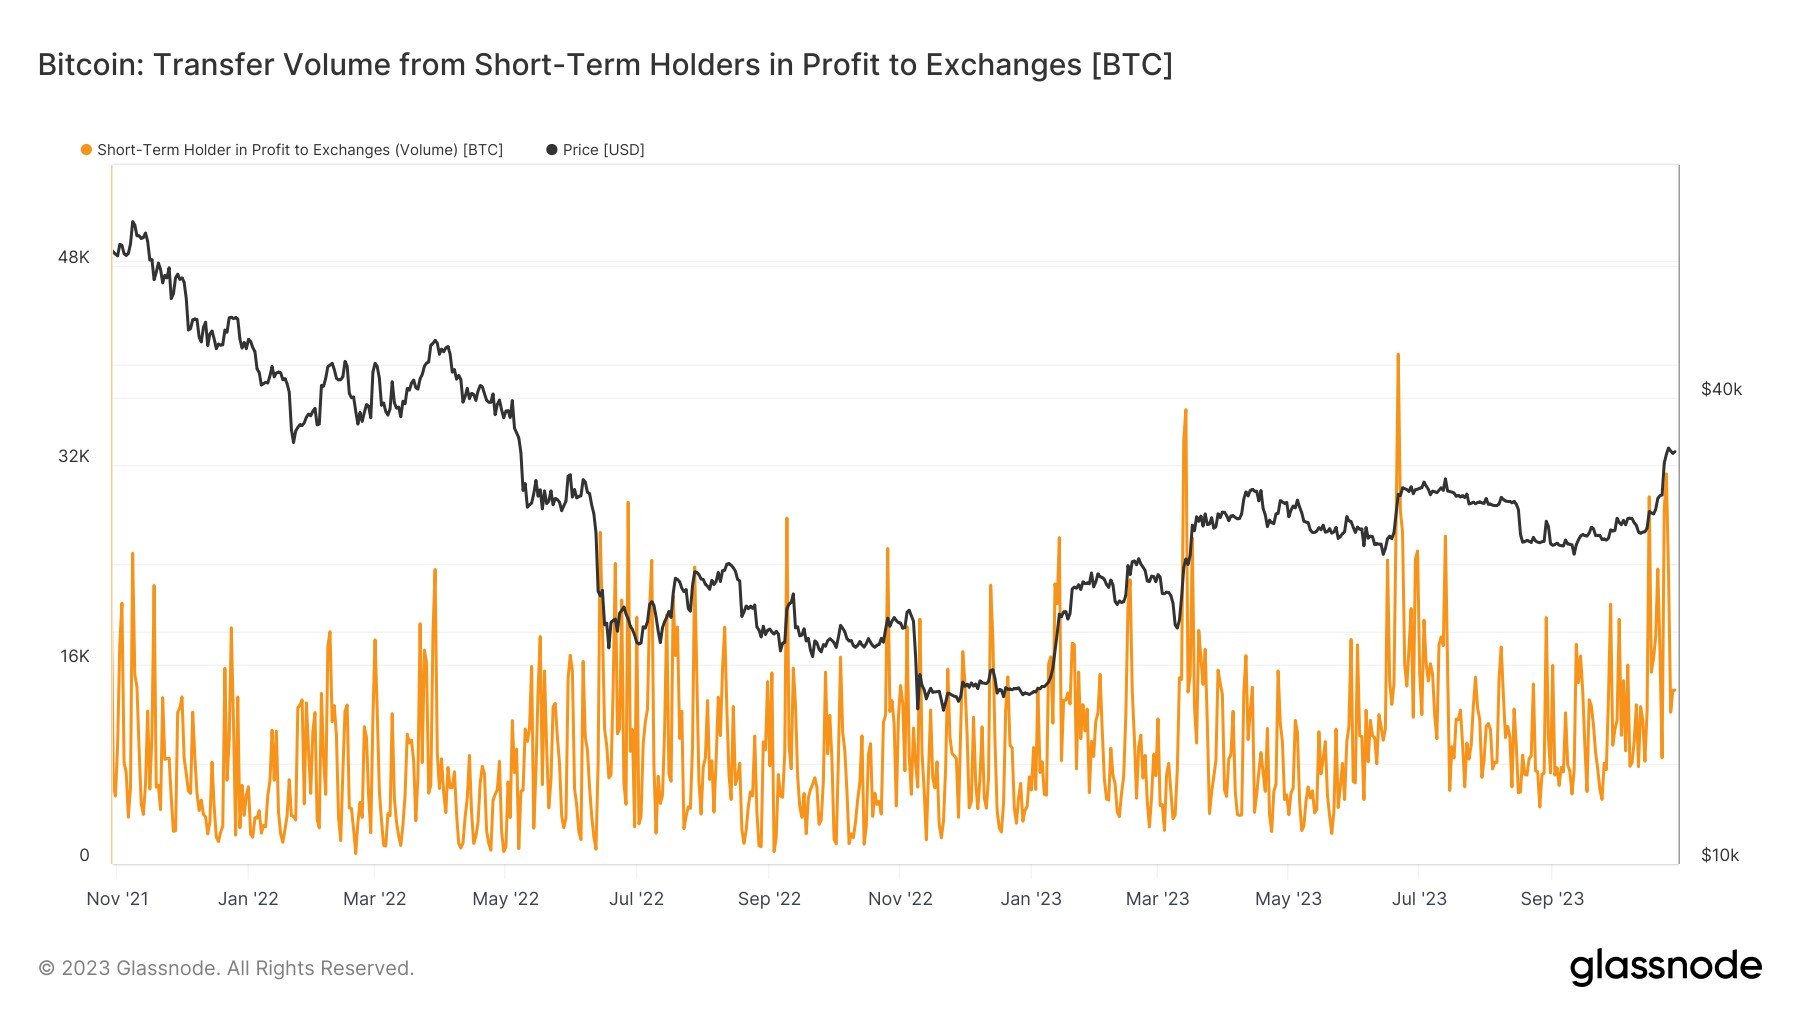
On the other hand, short-term holders are known to buy cryptocurrencies during sporadic price surges, often signaling that a cryptocurrency is nearing its peak. 

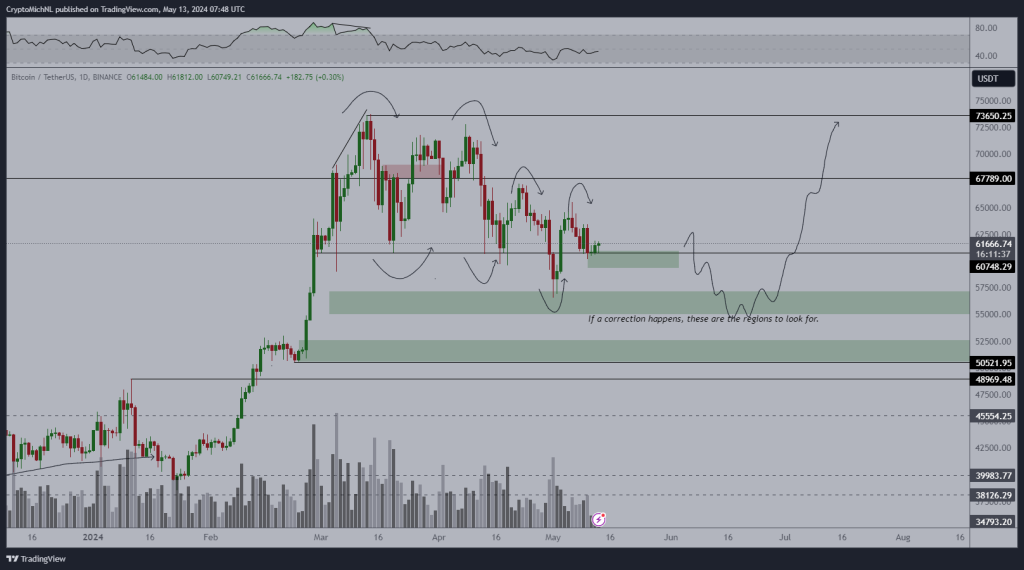
With Bitcoin presently stabilizing above $61,000, long-term Bitcoin holders probably see the cryptocurrency’s value as a prime buying opportunity. They have recently added a staggering 70,000 BTC valued at over $4.3 billion to their holdings.  

Bitcoin holders

This sentiment for Bitcoin’s potential rally is also shared by a few crypto analysts who have predicted that the cryptocurrency would surge to new all-time highs during the approaching bull market. Earlier in March, before Bitcoin’s halving event, the cryptocurrency skyrocketed above $73,000, marking a new historic all-time high. 

With the bull market still on the way, Bitcoin could see further upsides as market conditions improve and investor demand rises. This could potentially lead to profits for long term holders who had purchased the cryptocurrency earlier. 

Moreover, the upcoming United States inflation report, set for release on May 15, could also be another primary factor driving long-term investors’ substantial BTC accumulation. With the US Consumer Price Index (CPI) remaining historically high, and the Federal Reserve (FED) unchanged rates, Bitcoin is seen as a possible hedge against inflationary pressures, protecting investors’ wealth against decline.  

Bitcoin Whales Display Opposite Trend

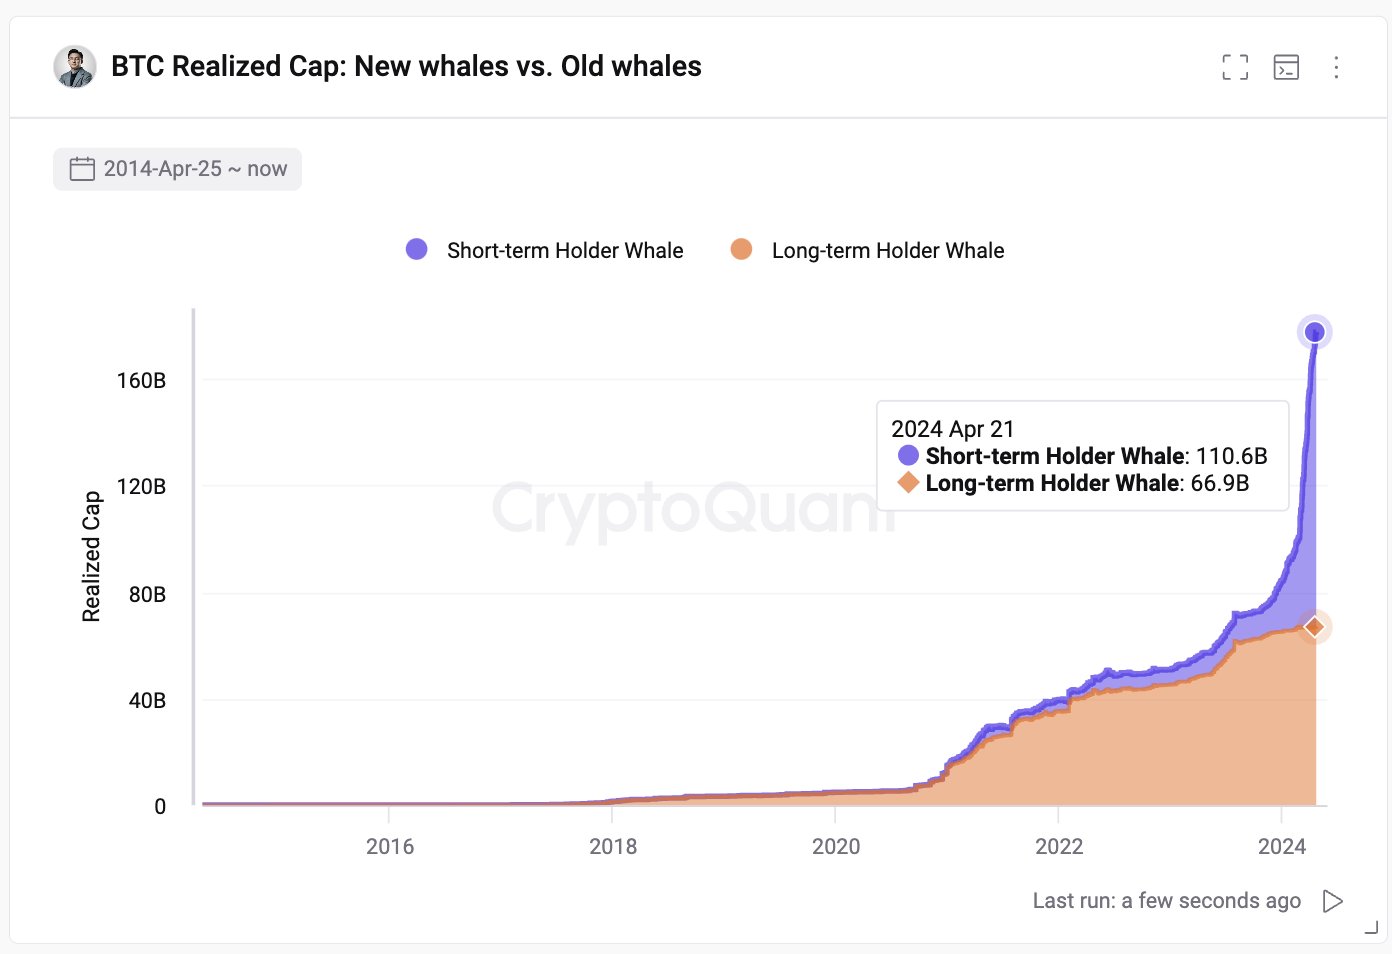
Reports from blockchain analytics platform Santiment reveal that Bitcoin whales are showing an opposite trend from long-term holders. 

The analytics platform noted that Bitcoin whales appear to be taking a break from accumulating BTC, as the number of large-scale transactions has been decreasing significantly. 

This trend coincides with the cryptocurrency’s reduced on-chain activities and its declining value over the past few weeks.

Crypto analyst Ali Martinez has also shared a similar report, emphasizing that Bitcoin’s accumulation trend score is currently displaying a value closer to zero, indicating that larger investors were distributing their holdings rather than buying. 

Despite the downtrend, Martinez has disclosed that Bitcoin’s current TD sequential is signaling a buying opportunity and the cryptocurrency was poised for a rebound soon. At the time of writing, the cryptocurrency’s price is trading below $62,000, receiving a decrease of about 6.38% in the last month, according to CoinMarketCap. 

Bitcoin price chart from Tradingview.com

Bitcoin Long-Term Holders Accumulating Like In 2021: Is BTC Ready For A 15X?

Bitcoin is moving sideways, posting drab price action, forcing participation to taper. But amid this consolidation and even fear of more losses, one analyst has shared data suggesting that long-term holders are accumulating at spot rates. 

Are We Back To 2021? Bitcoin Long-Term Holders Accumulating

In a post on X, the analyst noted that this re-accumulating pace is picking up momentum, mirroring a welcomed trend that preceded the impressive 2021 bull run.

Therefore, if long-term holders, or HODLers, accumulate, the probability of BTC rallying in the sessions ahead is elevated. Thus far, BTC has been trending above $60,000, up 10% from the May 2024 lows. 

BTC long-term holders accumulating | Source: Analyst on X

For clarity, the data shared by the analyst uses Unspent Transaction Outputs (UTXOs) to classify long-term and short-term holders. Analyzing the age of UTXOs makes it easier to gauge the behavior of different investor groups. 

Usually, UTXOs older than 155 days have “diamond hands” or long-term holders. Meanwhile, those who hold BTC for less than 155 days are short-term holders or often classified as “weak” hands.

They are usually traders or speculators interested in riding on price volatility, like in the first half of Q1 2024. 

When long-term holders stopped distributing BTC in 2021, prices rose sharply. By November 2021, the coin had peaked at around $70,000, lifting prices by nearly 1,500% from 2020 lows. It is unclear if BTC is ready for another 15X surge from spot rates, a move that would propel it to over $700,000.

BTC Has Strong Support At $60,000, Analyst Urges Patience

While the on-chain data paints a bullish picture, some analysts advocate caution. Taking to X, one analyst notes that Bitcoin has strong support at around the psychological $60,000 mark. The coin could stabilize if bulls soak in selling pressure and reject attempts for lower lows.

However, if prices dump below $60,000, triggered by a news event, BTC may fall to as low as the $52,000 to $55,000 zone.

BTC at key support | Source: Analyst on X

Despite the potential for short-term volatility, the analyst encourages investors to maintain a long-term perspective. Accumulating Bitcoin at these levels and exercising patience could be a winning strategy, the analyst says.

This preview would be especially true now that on-chain data shows that long-term holders are accumulating. 

Bitcoin price trending sideways on the daily chart | Source: BTCUSDT on Binance, TradingView

Before then, traders should watch price action. The coin is moving sideways, finding rejection at $66,000. Even though prices are lower, the last day’s series of higher highs is encouraging and might spark demand.

Newbie Bitcoin Whales Hold 2x As Much As Veterans: What’s Behind This Trend?

On-chain data shows the new whale entrants in the Bitcoin market now hold almost twice as much as the veterans. Here’s what could be behind this shift.

Bitcoin Newbie Whale Holdings Have Been Rapidly Growing Recently

In a new post on X, CryptoQuant founder and CEO Ki Young Ju has discussed about how the holdings of the new whales compares against the old ones in the market right now.

The on-chain indicator of interest here is the “Realized Cap,” which, in short, keeps track of the total amount of capital that the investors have used to purchase their Bitcoin.

This capitalization model is in contrast to the usual market cap, which simply measures the total value that the holders as a whole are carrying based on the current spot price.

In the context of the current topic, the Realized Cap of the entire market isn’t of interest, but rather specifically that of two segments: the short-term holder whales and long-term holder whales.

Whales are defined as entities on the network who are holding at least 1,000 BTC in their balance. At the current exchange rate, this amount is worth $66.6 million, so the whales are clearly quite massive holders. Because of these large holdings, these investors can hold some influence in the market.

Based on holding time, the whales can be subdivided into two categories. The short-term holder (STH) whales are those who acquired their coins within the past 155 days, while the long-term holder (LTH) whales have been holding since longer than this timespan.

Now, here is the chart shared by Ju that reveals the Realized Cap breakdown between these two Bitcoin whale cohorts:

Bitcoin Realized Cap

As is visible in the above graph, the Realized Cap of the STH whales has historically not been too different from that of the LTH whales, but that appears to have changed recently.

The metric has pulled away for these new whales this year with some very sharp growth, as its value has now reached the $110.6 billion mark. This means that the STH whales have collectively bought their coins at an initial investment of a whopping $110.6 billion.

The Realized Cap of the LTH whales, on the other hand, has continued its usual trajectory, floating around $66.9 billion currently. This means that there is now a massive gap between the indicator for these two cohorts.

But what’s the reason behind the sudden emergence of this brand-new trend? As mentioned before, the STH cutoff stands at 155 days, which means that the Realized Cap of the STH whales would signify the total value of the purchases made by the whales over the last five months.

In the past five months, there has been one event in particular that has stood out, which has also never been present in any of the prior cycles: the approval of the spot exchange-traded funds (ETFs).

The spot ETFs provide an alternative mode of investment into the asset through a means that’s familiar to traditional investors. These funds have been bringing in some unprecedented demand into BTC and as their holdings also fall under the 155 days mark, they would count as STH whales.

Bitcoin has also been rallying this year, so all this new investment would have had to purchase at relatively high prices, thus causing the Realized Cap, which correlates to direct capital flows, to inflate even further.

BTC Price

Bitcoin is now trading at $66,400 after witnessing a surge of more than 6% over the past week.

Bitcoin Price Chart

Is The Bitcoin Top Already Here? This Historical Pattern Says So

A historical pattern currently forming in a Bitcoin on-chain indicator could suggest that a top may be near for the asset, if not already in.

Bitcoin SOPR Ratio Is Forming A Historical Top Pattern Right Now

In a CryptoQuant Quicktake post, an analyst has discussed about a pattern regarding the SOPR Ratio. The “Spent Output Profit Ratio” (SOPR) is an indicator that tells us whether the Bitcoin investors are selling their coins at a profit or loss right now.

When the value of this metric is greater than 1, it means that profit-selling is dominant in the market currently. On the other hand, the metric being under the threshold suggests the average holder is moving coins at some net loss.

In the context of the current topic, the SOPR itself isn’t of interest; rather, it is a different version called the SOPR Ratio. The name may be a bit confusing as SOPR already contains a “ratio,” but the latter ratio here corresponds to the fact that this indicator compares the SOPR of two Bitcoin cohorts: the long-term holders (LTHs) and short-term holders (STHs).

These investor groups make up for the two main divisions of the BTC market done based on holding time, with 155 days being the cutoff between the two. The STHs are those who bought within the past 155 days, while the LTHs include the HODLers carrying coins for longer than this timespan.

Now, here is a chart that shows the trend in the 7-day moving average (MA) of the Bitcoin SOPR Ratio over the history of the cryptocurrency:

Bitcoin SOPR Ratio

As displayed in the above graph, the 7-day MA Bitcoin SOPR Ratio had been heading up throughout 2023 and early parts of 2024, but recently, the metric has hit a top and reversed its direction. Whenever the SOPR Ratio is higher than 1, it means the LTHs, who are generally known to be resolute hands, are participating in a higher degree of profit-taking than the STHs.

It would appear that as BTC had observed its rally and approached a new all-time high (ATH), these diamond hands had started harvesting some of the gains they had earned over their long holding time. And once the price set a new ATH, these investors participated in peak profit-taking. Since then, their profit-selling has been dropping off, although they are still harvesting notably higher gains than the STHs.

In the chart, the analyst highlights how this pattern has been repeated at different points in the asset’s history. While the scale of the peak LTH profit-taking has been heading down over the cycles, it’s still true that the metric’s top has coincided with tops in the price during each of them.

As the line drawn by the quant suggests, it’s possible that the latest peak in the metric may have in fact been the top for this cycle. This is only, however, assuming that the pattern of diminishing returns in the indicator holds to the exact degree judged by the line.

It’s possible that the peak will still be higher than the current levels, while at the same time being lower than the previous cycle’s peak, thus still being in-line with the historical Bitcoin pattern.

Whatever the case be, though, the fact that the SOPR ratio has apparently hit a top could still be a bearish signal, if only in the short term.

BTC Price

Bitcoin has been making some steady recovery over the last few days as its price has now surged back above $66,100.

Bitcoin Price Chart

Bitcoin Long-Term Holders Slow Down After 700,000 BTC Selloff, Reversal Sign?

On-chain data shows the Bitcoin long-term holder selling pressure has been running out recently after an extended selloff from the group.

Bitcoin Long-Term Holders Have Sold Huge In Past 4 Months

As analyst James Van Straten explained in a post on X, the long-term holders have massively reduced distribution during the last ten days. The “long-term holders” (LTHs) here refer to the Bitcoin investors carrying their coins since more than 155 days ago.

The LTHs comprise one of the two main divisions of the BTC sector, with the other cohort known as the “short-term holders” (STHs). The STHs are naturally the investors who bought within the past 155 days.

Statistically, the longer an investor holds onto their coins, the less likely they become to sell at any point. As such, the LTHs represent the more committed part of the BTC market.

The STHs, on the other hand, are fickle-minded hands who may sell at the first sight of any FUD or profit-taking opportunity. As such, selling from the STHs is usually not that noteworthy. However, Selloffs from the LTHs can be something to watch for, as they rarely occur.

One way to track the behavior of these Bitcoin cohorts is through the total amount of supply they carry in their respective combined wallets. The chart below shows the STH and LTH supply trend over the past year.

Bitcoin STH & LTH Supply

As displayed in the above graph, the supply of Bitcoin LTHs increased through most of 2023. At the same time, the supply of STHs naturally decreased.

Something to note here is that this increase in the LTH supply didn’t mean that these HODLers were buying then. Instead, some STHs bought 155 days ago and have finally held long enough to qualify for the cohort.

Thus, there is a 155-day delay between accumulation and the increase registered in the LTH supply. When it comes to selling, though, no such time lag exists, as the LTHs who transfer coins on the blockchain immediately eject from the group and become part of the STHs.

The chart shows that this trend of the supply of these diamond hands going up flipped this year, and the LTHs have been selling instead. In the past four months, these investors have distributed 700,000 BTC.

This excludes the selloff from Grayscale Bitcoin Trust (GBTC), which has constantly been bleeding coins since the US SEC approved the spot exchange-traded funds (ETFs) in January. These coins had also matured enough to become part of the LTHs.

Recently, as the price has gone through some bearish action, the LTH supply has flatlined, implying that the selling from these HODLers has finally stopped, at least for now. Given this new trend, it now remains to be seen how BTC’s value develops from here.

BTC Price

Following the latest drawdown in Bitcoin, its price has dropped towards the $63,200 level.

Bitcoin Price Chart

Bitcoin 40% Of Way Through Bull Run If This Metric Is To Go By

A pattern in the holdings of the Bitcoin long-term holders may suggest that the current bull run is 40% of the way to completion.

Bitcoin Long-Term Holders Have Been Distributing Recently

In a new post on X, Glassnode lead analyst Checkmate discussed the recent behavior of the long-term Bitcoin holders. The “long-term holders” (LTHs) here refer to the BTC investors who have been holding onto their coins for over six months.

Statistically, the longer an investor holds onto their coins, the less likely they become to sell them at any point. Since the LTHs hold for significant periods, they are considered quite resolute.

And indeed, they display this resilience in their behavior, rarely selling despite whatever is happening in the broader market. As such, the times they sell are all the more noteworthy.

Historically, the LTHs have taken to distribution during bull runs when the asset has broken its previous all-time high (ATH) price. Due to their long holding times, these investors amass large profits, which they start to spend when a high amount of demand comes in during bull rallies that happily take coins off their hands at high prices.

Checkmate explained that the recent ATH break of the cryptocurrency has looked similar to any other past one, with the LTHs already having started spending for this round.

The chart below shows the trend in the supply of Bitcoin LTHs over the past few years.

Bitcoin Long-Term Holders

As displayed in the above graph, the Bitcoin LTHs have recently observed their supply heading down. Remember that when it comes to increases in this metric, there is a delay associated with when buying is happening and when this supply is going up.

This is natural because the newly bought coins must age for six months before they can be considered a part of the cohort’s holdings. When it comes to drawdowns, though, the same delay doesn’t emerge, as the age of the coins instantly resets back to zero, and they exit the group.

Thus, the latest distribution from the LTHs is indeed happening. “In the prior two cycles, new demand for Bitcoin was able to absorb this LTH sell-side for around 6-8 months while pushing prices multiples higher,” explains the Glassnode lead.

The chart below shows that the LTH supply has typically gone through a drawdown of around 14% during these bull run selloffs.

Bitcoin LTH Selloff

Checkmate notes that, based on this historical average drawdown in the LTH supply, the current Bitcoin cycle would be around 40% completion for this process.

BTC Price

Bitcoin has surged during the past 24 hours as its price has now returned to $71,800.

Bitcoin Price Chart

Bitcoin Long-Term Holders & Price Top: Glassnode Reveals Pattern

The on-chain analytics firm Glassnode has explained that Bitcoin tends to reach a potential top when the long-term holders show this pattern.

Bitcoin Long-Term Holders Have Been Ramping Up Distribution

In a new report, Glassnode discussed the influence that the BTC long-term holders have on the cryptocurrency’s supply dynamics. The “long-term holders” (LTHs) here refer to the Bitcoin investors who have been holding onto their coins for more than 155 days.

The LTHs comprise one of the two main divisions of the BTC user base based on holding time, with the other cohort known as the “short-term holders” (STHs).

Historically, the LTHs have proven themselves to be the persistent hands of the market. They don’t quickly sell their coins regardless of what is happening in the broader sector. The STHs, on the other hand, often react to FUD and FOMO events.

As such, it’s not unusual to see the STHs participating in selling. However, the LTHs showing sustained distribution can be something to note, as selling from these HODLers, who usually sit tight, may have implications for the market.

There are many different ways of tracking the behavior of the LTHs, but in the context of the current discussion, Glassnode has used the “LTH Market Inflation Rate” metric.

As the report explains:

It shows the annualized rate of Bitcoin accumulation or distribution by LTHs relative to daily miner issuance. This rate helps identify periods of net accumulation, where LTHs are effectively removing Bitcoin from the market, and periods of net distribution, where LTHs add to the market’s sell-side pressure.

Now, here is a chart that shows the trend in the BTC LTH Market Inflation Rate over the past several years:

Bitcoin LTH Market Inflation Rate

In the chart, the analytics firm has also attached the data for the asset’s Inflation Rate, which is basically the amount that the miners are introducing into the circulating supply by solving blocks and receiving rewards for them.

When the LTH Market Inflation Rate equals 0%, these HODLers are accumulating amounts exactly equal to what the miners are issuing.

This implies that the indicator below the 0% mark suggests the LTHs are pulling coins out of the supply, while it being above is a sign that they are either distributing or just not buying enough to absorb what the miners are producing.

The graph shows that historically, the cryptocurrency’s price has tended to reach a state of equilibrium and potentially even a top when the LTH distribution has peaked.

The LTH Market Inflation Rate has been increasing recently, but it’s yet to reach any significant levels. As for what this could mean for the market, Glassnode says:

Currently, the trend in the LTH market inflation rate indicates we are in an early phase of a distribution cycle, with about 30% completed. This suggests significant activity ahead within the current cycle until we achieve a market equilibrium point from the supply and demand perspective and potential price tops.

BTC Price

Bitcoin has retraced most of its recovery from the past few days, as its price has now declined to $63,800.

Bitcoin Price Chart

Bitcoin Short-Term Holders Panic Capitulate $2.6 Billion In BTC Crash

On-chain data shows that Bitcoin short-term holders have panic sold $2.6 billion worth of coins in the crash following the new all-time high.

Bitcoin Short-Term Holders Have Sent Huge Volume In Loss To Exchanges

As analyst James V. Straten explained in a new post on X, Bitcoin short-term holders have shown signs of capitulation during the latest drop in the cryptocurrency’s price.

The “short-term holders” (STHs) refer to the BTC investors who bought their coins within the past 155 days. The STHs make up one of the two main divisions of the market, the other one being the “long-term holders” (LTHs).

Statistically, the longer an investor holds onto their coins, the less likely they are to sell at any point. This means that the STHs, who are relatively new hands, generally sell quickly whenever an asset crash or rally occurs. The LTHs, on the other hand, usually show resilience, only selling at specific points.

One way to track whether either of these groups is selling is through the transfer volume they are sending to exchanges. First, here is a chart that shows the trend in the Bitcoin exchange inflow volume precisely for the STHs in loss:

Bitcoin Short-Term Holders

As displayed in the above graph, the Bitcoin STHs have transferred around $2.6 billion worth of coins in loss to exchanges in the past day, implying that some members of this cohort have capitulated.

This spike is huge, but it’s less than the loss-taking event that took place back during the price drawdown that followed the BTC spot exchange-traded fund (ETF) approval.

These loss sellers would be those who FOMO’d into the rally that took BTC to a new all-time high beyond the $69,000 level, but their conviction wasn’t strong enough that they were able to hold past the sharp crash that BTC observed shortly after.

The STHs aren’t the only ones who have exited the market in this latest price volatility; it would appear that the LTHs have also done some selling. The difference, however, is that these HODLers have made profits.

The chart below shows how the exchange transfer volume for the LTHs in profit has looked like recently.

Bitcoin Long-Term Holders

The graph shows that the Bitcoin LTHs have participated in their largest profit-taking event since July 2021, transferring tokens worth $1.5 billion to exchanges.

Thus, it would appear that this recent volatility has shaken up the conviction of even some of the diamond hands, although these HODLers have at least still been rewarded with profits.

BTC Price

At the time of writing, Bitcoin is trading around the $65,800 mark, up 8% in the past week.

Bitcoin Price Chart

16,000 Bitcoin Dormant Since 5+ Years Suddenly Moves, What’s Going On?

On-chain data shows 16,000 BTC, which have been dormant for 5-7 years, have finally shown some movement on the Bitcoin blockchain.

5-7 Years Old Bitcoin Age Band Has Made A Large Move

As pointed out by an analyst in a post on X, a large stack of dormant coins has moved across the network today. The relevant on-chain indicator here is the “Spent Output Age Bands” (SOAB), which keeps track of the movements of the various Age Bands on the blockchain.

“Age Bands” here refer to groups of coins divided based on their total holding time. For example, the 1-month to 3-month Age Band would include all coins that have been dormant (that is, staying inside the same address) since between one and three months ago.

If a large number of coins belonging to this holding time range would transfer on the blockchain, then the SOAB for this particular Age Band would register a spike. In the context of the current discussion, the 5-7 years Age Band is of interest.

The chart below shows the recent SOAB data for this Age Band specifically:

Bitcoin Spent Output Age Bands

As displayed in the above graph, a large amount of coins aged between 5-7years old appear to have just been moved on the network as the corresponding Age Band has registered a spike.

This Age Band is a segment of the wider and “long-term holder” (LTH) group, which includes investors who have been holding onto their coins since at least 155 days ago.

Statistically, the longer a holder keeps their coins dormant, the less likely they become to sell at any point. As such, the LTHs are generally considered to be more resolute than the rest of the market (the “short-term holders“).

Since the 5-7 years Age Band would include coins that are old even in LTH terms, their owners would have to be diamond hands among diamond hands. Due to this reason, it can be something notable when such ancient entities finally decide to break their silence.

Related Reading: Cardano (ADA) To Break $8 In Bull Run: Analyst Predicts Timeline

During the latest SOAB spike, these investors have moved a massive stack of 16,000 BTC (around $837.8 million at the current exchange rate). Now, what implications this move may have on the market depends on what these investors intend to achieve with it.

A dive deeper into on-chain data suggests the move was an outflow from the cryptocurrency exchange Coinbase, as the chart below shows:

Bitcoin Coinbase Outflow

The fact that it is an outflow may be a positive sign for Bitcoin, as it means that selling may not have been the goal here. Rather, the move implies the whale entity behind it may be moving towards self-custody to HODL further, or a large buyer like an ETF is gobbling this BTC up.

BTC Price

Bitcoin had made a visit down to $50,600 during the weekend, but the cryptocurrency already appears to have bounced back as its price is now floating around the $52,400 level.

Bitcoin Price Chart

HODLing Rewards: Average Bitcoin Long-Term Holder Now Carries 55% Profit

On-chain data shows the Bitcoin long-term holders (the so-called HODLers) are now carrying an unrealized profit of 55% on average.

Bitcoin Long-Term Holder NUPL Has Hit A Value Of 0.55

According to the latest weekly report from Glassnode, the profit that the BTC long-term holders are holding has gone up recently. The indicator of interest here is the “Net Unrealized Profit/Loss” (NUPL), which keeps track of the difference between the unrealized profit and loss that Bitcoin investors are carrying currently.

By “unrealized,” what’s meant here is that the profit or loss is yet to be harvested, as the investor carrying it hasn’t transferred their BTC on the blockchain yet. Once the holder would eventually move the coins, the profit/loss they were holding would then become “realized.”

In the context of the current discussion, the NUPL of only a specific segment of the market is of relevance: the long-term holders (LTHs). The LTHs are the Bitcoin holders who have been keeping their coins dormant on the network since at least 155 days ago.

These are the diamond hands of the market who are known to hold through periods of uptrends and downtrends alike, only selling when major market events take place.

“This includes periods when the market sets new ATHs, around cycle tops and bottoms, and during large shifts in market structure (e.g. Mt Gox, Halvings, and now the launch of spot ETFs),” explains the analytics firm.

Now, here is a chart that shows the trend in the Bitcoin LTH NUPL over the history of the asset:

Bitcoin LTH NUPL

As displayed in the above graph, the Bitcoin LTH NUPL has registered a rise in the last couple of months as the cryptocurrency’s spot price has gone through a notable surge.

“This metric reached 0.55 this week, which is meaningfully positive, and puts the average long-term investor at a 55% unrealized profit,” notes the report. Interestingly, BTC has registered some resistance around this level during the past.

As Glassnode has highlighted in the chart, the bulls encountered trouble here during August 2012, June 2016, July 2019, and August 2020. In all of these cases, the resulting top was only a local one, except for July 2019, where the recovery rally of the cycle hit a top that BTC wouldn’t surpass for a significant period of time.

Generally, investors in profit are more likely to sell their coins. The higher the gains that they hold, the stronger can be the allure of profit-taking. Thus, it’s not surprising to see that the LTHs holding significant profits has lead to selling pressure in the market during previous cycles.

The LTHs have indeed participated in some selling recently as well, as the data for their supply suggests.

Bitcoin Long-Term Holder Supply

The Bitcoin LTH supply has now come down 75,000 BTC since the all-time high registered in November, while the opposite cohort, the short-term holders (STHs), have naturally gained some share.

“Whilst 75k BTC is a meaningful sum, it should also be viewed within the context of total LTH supply accounting for a whopping 76.3% of the circulating coin supply,” says the report.

BTC Price

Bitcoin has continued its recent sideways trend during the past day as its price currently floats around the $42,600 level.

Bitcoin Price Chart

When Will Bitcoin Bull Run Begin? This Could Be The Metric To Watch

A pattern in the supply of the Bitcoin long-term holders could provide some hints about when the next bull run might begin in earnest.

Bitcoin HODLer Balance Has Followed A Specific Pattern In Previous Cycles

According to the market intelligence platform IntoTheBlock, the supply of the BTC HODLers is “an excellent indicator for measuring market cycles.” The “HODLers” or long-term holders (LTHs) refer to the Bitcoin investors who have held onto their coins since at least a year ago without having sold or transferred them on the blockchain.

The LTHs are the resolute hands in the market, which rarely sell their coins even when a profitable opportunity has presented itself or a deep price crash has occurred.

One way to track the behavior of these diamond hands is through the combined amount of balance they carry in their wallets. The chart below shows this Bitcoin metric trend over the past few years.

Bitcoin Long-Term Holder Supply

As displayed in the above graph, the Bitcoin supply held by the HODLers has been showing some growth over the past couple of years, suggesting that the LTHs have been accumulating.

This rise in the indicator has also continued through the latest rally, implying that the LTHs aren’t yet ready to start taking their profits. Something to note is that when the metric goes up, it doesn’t mean buying is happening in the present.

The indicator naturally has a 1-year lag associated with it, as coins must mature for that long before they can be included in the cohort. However, this only applies to buying as the holders moving their coins to sell instantly reset the age back to zero and, hence, remove them from the group.

In the chart, the analytics firm has highlighted a pattern that the Bitcoin LTH supply has observed during the leadup to past bull runs. It would appear that the HODLers have shown accumulation in such periods.

On the other hand, the start of selling from this cohort coincided with the beginning of the bull rally in proper. So far, the HODLers have only been accumulating recently, implying that the market may be in the pre-bull run phase.

If the historical pattern indeed holds for the current cycle as well, then the HODLer supply could be one to watch, as a significant downtrend in it could turn out to be a signal that the bull run has begun once more.

BTC Price

Bitcoin had plunged towards the $41,700 mark yesterday, but the asset has already seen some sharp recovery as its price is now trading around the $43,000 level.

Bitcoin Price Chart

Bitcoin Solid Above $34,000 Despite High Short-Term Holder Profit-Taking

Bitcoin has shown some impressive strength above the $34,000 mark despite a high amount of profit-taking from short-term holders.

Bitcoin Short-Term Holders Are Selling, While Long-Term Holders Are Still Quiet

As explained by analyst James V. Straten in a new post on X, the short-term holders are currently participating in one of the strongest profit-taking events of the past couple of years.

The “short-term holders” (STHs) here refer to all those Bitcoin investors who have been holding onto their coins since less than 155 days ago. This group comprises one of the two main divisions of the BTC market, with the other being called the “long-term holders” (LTHs).

Statistically, the longer an investor keeps their coins dormant, the less likely they become to sell them at any point. Because of this reason, the STHs are generally the weak-minded hands of the sector, while the LTHs are the strong, persistent holders.

Whenever the sector goes through any significant FUD or FOMO, the STHs budge and participate in at least some amount of selling. The LTHs, on the other hand, usually show little reaction.

Since the Bitcoin price has enjoyed a sharp rally recently that has taken its price above the $34,000 level, the STHs would naturally be selling now. One way to track whether this Bitcoin group is selling their coins can be by tracking the volume that they are transferring to exchanges.

In the context of the current discussion, Straten has decided to choose the version of this indicator that specifically tracks the transactions from investors who are in profit, as profit-taking is generally the behavior of focus during rallies. In contrast, loss transactions play a greater role in price slumps.

Now, here is a chart that shows the trend in the metric for the Bitcoin STHs over the past two years:

Bitcoin Short-Term Holder Profit-Taking

As shown in the above graph, the Bitcoin STHs in profit have sent large amounts to these centralized platforms since the latest rally in the asset.

This confirms that these weak hands have been selling recently. As mentioned before, it’s not unusual for such a thing to happen, but the scale of the profit-taking this time around is particularly significant.

From the chart, it’s visible that there have only been a few times in the past couple of years where the STHs in profit have transferred comparable or higher volumes to exchanges. Given this selloff, it’s impressive that Bitcoin has been able to hold on above the $34,000 level during the last few days.

As expected from the LTHs, they haven’t sold much despite the rally.

Bitcoin Long-Term Holders

The metric is currently at its sixth-largest value for this year, but as is clear from the above graph, the scale of this selloff is still not that much in pure terms.

BTC Price

At the time of writing, Bitcoin is trading at around $34,700, up 13% in the past week.

Bitcoin Price Chart

Bitcoin Long-Term Holders Stay Resolute Despite Rally, Supply Hits New ATH

On-chain data shows the Bitcoin long-term holder supply has set a new all-time high (ATH) despite the rally offering a profitable exit point.

Bitcoin Long-Term Holders Haven’t Given In To The Allure Of Profit-Taking Yet

In its latest weekly report, the on-chain analytics firm Glassnode has discussed how the BTC long-term holders have reacted to the latest rally in the asset towards the $35,000 level.

The “long-term holders” (LTHs) refer to those investors who have held onto their coins since at least 155 days ago. Statistically, the longer a holder keeps their coins still, the less likely they become to move them at any point.

Thus, since the LTHs have been holding their coins for a significant amount, they generally tend to remain quiet in the future. Throughout history, this cohort has shown this conviction regardless of whatever is going on in the market, whether FUD from crashes or FOMO from rallies.

Because of this, the times that the LTHs participate in selling can be ones to watch for, as they show that the market has pushed even these diamond hands towards selling.

Now, here is a chart that shows the trend in the supply held by the Bitcoin LTHs throughout the history of the cryptocurrency:

Bitcoin Long-Term Holder Supply

As displayed in the above graph, the Bitcoin LTH supply has increased recently and has set a new ATH of about 14.9 million BTC. This suggests that a net amount of the supply has continued to mature past the 155-day threshold despite the sharp rally that the asset has enjoyed.

From the chart, it’s visible that at some point during major historical rallies, these LTHs have usually participated in at least a bit of net selling as some members of the cohort look to harvest their gains. Interestingly, that hasn’t happened with this rally so far.

In the chart, Glassnode has also attached the data for another metric: the amount of the LTH supply being held at some loss. It would appear that 29.6% of the supply owned by these HODLers (about 4.28 million BTC) is currently carrying a net unrealized loss.

The on-chain analytics firm notes that this is quite a high value considering the significant uptrend that Bitcoin has seen since the lows in 2022. Such indicator values have rather been seen during the deep bear market phases historically (except the March 2020 spike, which occurred because of the sudden COVID crash).

“This suggests that the LTH cohort may be a more hardened and firm-handed cohort compared to prior cycles,” explains the report.

BTC Price

Bitcoin has seen a sharp 13% jump in the past 24 hours as the cryptocurrency is now trading at $34,500.

Bitcoin Price Chart

Bitcoin Bearish Signal: Long-Term Holders Deposit To Exchanges

On-chain data shows that Bitcoin long-term holders are making deposits to exchanges currently, something that could be bearish for the price.

Bitcoin Exchange Inflow CDD Has Spiked Recently

As explained by an analyst in a CryptoQuant Quicktake post, investors have been making deposits to spot exchanges recently. There are two relevant indicators here: the “exchange inflow” and the “exchange reserve.”

The former of these keeps track of the total amount of Bitcoin that the holders are transferring to centralized exchanges, while the latter one measures the total amount sitting in the wallets of these platforms.

When the value of the inflow metric spikes, it means that the investors are moving a large number of coins to the exchanges. As one of the main reasons why holders may make such transfers is for selling-related purposes, this kind of trend can be a sign that selling is occurring.

Since selling activity occurs on the spot exchanges, the quant has restricted the exchange inflow and reserve indicators to track only the data related to the spot platforms.

The analyst has also chosen another modifier on the exchange inflow: the “Coin Days Destroyed” (CDD). In simple terms, what the CDD checks for is the activity of dormant coins in the market.

Tokens that have been sitting in wallets for a long time accumulate a large number of “coin days” (where 1 coin day corresponds to 1 BTC staying still for 1 day) and when these coins finally move, the coin days are reset or “destroyed,” which is the number that the CDD measures. The exchange inflow CDD naturally only keeps track of the coin days being destroyed through transfers to exchanges.

Now, here are the charts that show the trends in the 7-day simple moving average (SMA) value of this Bitcoin indicator and the 14-day SMA exchange reserve:

Bitcoin Exchange Inflow CDD & Exchange Reserve

From the first graph, it’s visible that the Bitcoin exchange inflow CDD has registered a sharp spike recently. This would suggest that a potentially large number of dormant coins have been moved into these platforms.

Usually, the CDD having large values like these can be a sign that the “long-term holders” (LTHs) are on the move. The LTHs (defined as holders carrying their coins since at least six months ago) are the most resolute bunch in the market, so their depositing to exchanges can be something to watch for, as it implies that the market has made even these diamond hands waver.

As is visible from the second chart, the exchange reserve has also gone up alongside this spike in the exchange inflow CDD, suggesting that there haven’t been enough withdrawals to make up for these inflows.

It now remains to be seen what effect these possible selling moves from the LTHs may have on the Bitcoin price in the coming days.

BTC Price

Bitcoin has continued its stagnant price action recently as its price is still trading around the $26,400 mark.

Bitcoin Price Chart

Bitcoin HODLer Dominance Rises To Record Levels, Bullish Sign?

On-chain data shows the divergence between the Bitcoin long-term holders and short-term holders has grown to record levels recently.

Bitcoin Market Has Been Continuing Its Shift Towards HODLing

As an analyst in a post on X explained, the gap between the speculators and HODLers in the market has only grown wider recently. The “short-term holders” (STHs) and the “long-term holders” (LTHs) are the two primary cohorts that the entire Bitcoin market can be divided into.

The STHs refer to all those investors who purchased their coins less than 155 days ago, while the LTHs include the holders who have been holding onto their tokens beyond that period.

Statistically, the longer an investor keeps their coins dormant, the less likely they become to sell them at any point. Due to this reason, the STHs are usually the group with the weaker conviction of the two.

The LTHs often hold through volatile periods in the asset without moving an inch, which has earned them the popular name “diamond hands.” The STHs, on the other hand, tend to sell quickly whenever FUD emerges in the sector, or a profitable selling opportunity appears.

Now, here is a chart that shows the trend in the supplies of these BTC investor groups throughout the history of the cryptocurrency:

Bitcoin Long-Term & Short-Term Holders

The graph shows that the Bitcoin LTH supply has been on an uptrend during the past couple of years, while the STH supply has been going down recently. This would suggest that the overall supply of the cryptocurrency is continuously becoming more dormant.

The gap between these groups is the widest it has ever been, as the LTH supply is nearing the 15 million BTC mark, while the STH supply has dropped under the 2.5 million BTC level.

The latter’s latest value is the lowest it has ever been since 2011 when the asset was still in its infancy. It would appear that short-term speculators in the market have thinned to record lows.

Last month, Bitcoin witnessed a sharp crash from above the $29,000 level to below the $26,000 mark, and the asset has not recovered. As is apparent from the chart, though, the LTHs haven’t cared about the asset’s struggle at all, as their supply has only continued to head up while the STHs have shrunken down further.

The LTH group remaining strong and continuing its growth may not affect the market in the short-term, but during longer periods, the supply continuing to become locked in the wallets of these HODLers could have a bullish impact due to how supply-demand dynamics work.

BTC Price

At the time of writing, Bitcoin is floating around the $25,700 mark, registering a dip of 6% over the past week.

Bitcoin Price Chart

Bitcoin Bull Run Incoming? This Metric Could Suggest So

On-chain data shows a Bitcoin metric is forming a pattern that may hint that a bull run could be coming next for the asset.

Bitcoin HODLer Growth Rate Has Seemingly Reached The “Plateau” Stage

In a new post on X, the analyst Charles Edwards shared a chart highlighting a pattern that the BTC “HODLer Growth Rate” indicator may be forming.

This indicator keeps track of the 1-year growth in the holdings of the Bitcoin investors who have been keeping their coins dormant (unmoved) in their wallets since at least two years ago.

Generally, an investor who holds onto their coins for at least six months is termed a “long-term holder” (LTH). The LTHs are market participants with a high resolve who don’t usually sell quickly, regardless of whatever happens in the rest of the market.

Statistically speaking, the longer an investor keeps their coins still, the less likely they become to sell at any point. Thus, the holders who make it to the 2-year mark, which is the segment of interest in the current discussion, would then be the most persistent investors, even among these LTHs.

Therefore, whatever these holders are doing can be worth keeping an eye on, as it may have ramifications for the rest of the market. Naturally, these holders aren’t too likely to exert influence in the short term (as they usually remain silent), but in the long term when the effects of their behavior could emerge.

Here is a chart that shows the trend in the Bitcoin HODLer Growth Rate for this particular segment of the LTHs over the past decade:

Bitcoin HODLer Growth Rate

As Charles has marked in the above graph, there appears to be a specific pattern that the Bitcoin HODLer Growth Rate has followed throughout the cycles.

It would seem that during bear markets, the indicator’s value remains positive and in an uptrend, suggesting that these investors expand their holdings in such periods, and as prices dip further, they only up the pace of this accumulation.

As the bear market approaches its end and a transition towards a bull market takes place, the metric’s value goes flat, implying that these investors still accumulate, although at a constant rate, rather than an accelerating one. Then, as the bull run starts, these Bitcoin HODLers slowly stop the accumulation entirely and begin to participate in distribution instead.

The analyst notes that the Bitcoin HODLer Growth Rate now appears to have finished up the rapid bear market expansion phase and is now starting to plateau sideways.

Naturally, if the pattern of the previous cycles is anything to go by, it can mean that the Bitcoin market is now in the middle of the transition towards the next bull run.

BTC Price

Bitcoin remains stuck in a range as its price still trades around the $26,100 level.

Bitcoin Price Chart

Bitcoin Plunges Below $27,000, Which Holder Groups Are Selling?

Bitcoin has plunged below the $27,000 mark during the past day. Here are the market segments that are possibly participating in this selloff.

These Bitcoin Investors Have Been Spending Their Coins Recently

In a new tweet, the on-chain analytics firm Glassnode has broken down the prices at which the average coins sold today were bought. Generally, the BTC market is divided into two main segments: the long-term holders (LTHs) and the short-term holders (STHs).

The STHs comprise a cohort including all investors who acquired their Bitcoin within the last 155 days. The LTHs, on the other hand, are investors who have been holding for more than this threshold amount.

In the context of the current discussion, the relevant indicator is the “dormancy average spending ranges,” which finds out the periods in which the average coins being spent/transferred by these two groups were first acquired.

For example, if the metric shows the 7-day spending range for the LTHs as $20,000 to $30,000, it means that the coins these investors sold in the past week were initially bought at prices in this range.

Here is a chart showing the data for the current 7-day dormancy average spending ranges for the STHs and LTHs, as well for the combined market.

Bitcoin Sellers

The graph shows that the 7-day average spending range for the STHs is quite close to the current prices at $30,400 to $27,300. Some of these sellers bought at higher prices than those observed in the past week, so they must have been selling at a loss (although not a particularly deep one).

The indicator puts the LTHs’ acquisition range at $67,600 to $35,000. As highlighted in the chart, the timeframe of these purchases included the lead-up to the November 2021 price all-time high, the top itself, and the period when the decline towards the bear market first started.

It would appear that these holders who bought at the high bull market prices have budged because of the pressure the cryptocurrency has been under lately and have finally decided to take their losses and move on.

Generally, the longer an investor holds onto their coins, the less likely they become to sell at any point. This would perhaps explain why the acquisition timeframe of the current STHs is so recent; the fickle ones are those who have only been holding a short while.

For the BTC LTHs, however, the probable reason why the acquisition period of the average seller from this group is so far back, rather than nearer to 155 days ago (the cutoff of the youngest LTHs), is that a lot of the younger LTHs would be in profits currently as they bought during the lower, bear-market prices.

As such, the Bitcoin investors more likely to waver in their conviction right now would be those holding the most severe losses, the 2021 bull run top buyers.

The chart also includes the 7-day average spending range for the combined BTC sector, and as one may expect, this range lies in the middle of the two cohorts ($15,800 to $28,500), but the timeframe is closer to the STHs, as a lot of the sellers are bound to be recent buyers.

BTC Price

At the time of writing, Bitcoin is trading around $26,300, down 10% in the last week.

Bitcoin Price Chart

Bitcoin Rally May Not Have Hit Top Yet, Here’s Why

The historical pattern in this Bitcoin on-chain indicator may suggest that the ongoing rally hasn’t reached its top yet.

Bitcoin 1-Year Inactive Supply Has Continued To Go Up Recently

According to a post from the on-chain analytics firm CryptoQuant, the 1-year inactive supply hit a high back in March of this year. The “1-year inactive supply” is an indicator that measures the total percentage of the Bitcoin supply that hasn’t moved on the blockchain since at least one year ago.

This supply belongs to one of the two major cohorts in the BTC market: the “long-term holders” (LTHs). This group includes all investors who bought their coins more than six months ago, so the 1-year inactive supply metric doesn’t measure their entire supply, only a segment of it (although a rather large one).

The LTHs hold a special place in the Bitcoin economy as they comprise the most resolute investors in the market. The selling and buying behavior of this cohort can, therefore, have long-term implications for the sector.

Here is a chart that shows how the 1-year inactive BTC supply has changed over the lifetime of the cryptocurrency and how it has seemingly taken its place in the different price cycles:

Bitcoin 1-Year Inactive Supply

As the above graph shows, the Bitcoin 1-year inactive supply has historically trended up during the bear markets. This means these investors generally participate in accumulation in the leadup to and during the bear markets.

The LTHs then continue to hold onto their filled-up bags and expand as they transition toward a bullish period. These investors show this behavior throughout the bull market buildup phase; when the rally starts reaching its last stages, these holders start selling to take their profits.

This pattern has repeated throughout the different cycles, showing that the LTHs’ behavior hasn’t changed too much. However, one thing that differs between the cycles is that their supply has been going up overall. This would partly be attributed to all the Bitcoin that has been getting lost due to wallet keys becoming inaccessible.

The percentage of the circulating supply held by this Bitcoin investor segment hit an all-time high just back in March of this year, reaching a value north of 67%. These investors have shed some coins since then, but the difference in their supplies between then and now is negligible (13.1 million BTC vs. 13 million BTC).

The April 2019 rally, which resembles the current one, also saw the LTHs holding tight until midway through the rally, when they started selling, and the cryptocurrency reached the top just a while later.

Suppose the Bitcoin price and the 1-year inactive supply will follow the same pattern in this current rally as during all these past bullish periods. In that case, it seems likely that the top hasn’t been hit since the LTHs haven’t started participating in any significant distribution yet.

BTC Price

At the time of writing, Bitcoin is trading around $28,300, down 4% in the last week.

Bitcoin Price Chart

Bitcoin Accumulation: HODLers Are Buying 15,000 BTC Per Month

On-chain data shows the Bitcoin HODLers are currently displaying net accumulation behavior, as they grow their holdings by 15,000 BTC per month.

Bitcoin Long-Term Holders Have Been Accumulating Recently

According to data from the on-chain analytics firm Glassnode, these investors were previously aggressively distributing during the bear market lows. The HODLers, or more formally, the “long-term holders” (LTHs), make up a Bitcoin cohort that includes all investors that have been holding onto their coins since at least 155 days ago.

The LTHs make up one of the two main holder groups in the market; the other cohort is called the “short-term holder” (STH) group and naturally includes only investors that bought their BTC less than 155 days ago.

Statistically speaking, the longer a holder owns a coin, the less likely they become to sell it at any point. This means that the LTHs are the more resolute bunch of the two groups, which is why they are called the “HODLers” or the diamond hands of the market.

As these investors are an important part of the sector, their movements can be worth tracking. An indicator called the “HODLer net position change” measures the monthly rate at which these investors are buying or selling a net amount of Bitcoin right now.

The chart below shows the trend in this metric over the last few years:

Bitcoin HODLer Net Position Change

When the HODLer net position change has a positive value, it means these investors are receiving inflows into their holdings currently. On the other hand, negative values suggest a net number of coins are exiting the supply of the LTHs.

As displayed in the graph, the Bitcoin HODLer net position change had a deep red value during the bear market lows that followed the November 2022 FTX crash. This means that the LTHs had been selling during this period.

This sharp negative spike has been an exception to the long-term trend, however, as the HODLers have actually been showing an overall strong accumulation behavior over the past couple of years. The last time these investors participated in consistent distribution was during the bull rally in the first half of 2021.

From the chart, it’s visible that after the aforementioned brief period of distribution at the bear market lows, the LTHs switched back to accumulation just before the current rally began.

These diamond hands have continued to add to their holdings throughout the rally so far, showing that they haven’t been allured by the profit-taking opportunity. This can be a bullish sign for the long-term sustainability of the rally.

Though, very recently, the monthly amount that they have been adding to their holdings has been trending down. Nonetheless, the indicator’s value still remains positive, as the Bitcoin LTHs are accumulating at a rate of 15,000 BTC per month currently.

BTC Price

At the time of writing, Bitcoin is trading around $29,100, up 1% in the last week.

Bitcoin Price Chart