On-chain data shows a Bitcoin metric is forming a pattern that may hint that a bull run could be coming next for the asset.
Bitcoin HODLer Growth Rate Has Seemingly Reached The “Plateau” Stage
In a new post on X, the analyst Charles Edwards shared a chart highlighting a pattern that the BTC “HODLer Growth Rate” indicator may be forming.
This indicator keeps track of the 1-year growth in the holdings of the Bitcoin investors who have been keeping their coins dormant (unmoved) in their wallets since at least two years ago.
Generally, an investor who holds onto their coins for at least six months is termed a “long-term holder” (LTH). The LTHs are market participants with a high resolve who don’t usually sell quickly, regardless of whatever happens in the rest of the market.
Statistically speaking, the longer an investor keeps their coins still, the less likely they become to sell at any point. Thus, the holders who make it to the 2-year mark, which is the segment of interest in the current discussion, would then be the most persistent investors, even among these LTHs.
Therefore, whatever these holders are doing can be worth keeping an eye on, as it may have ramifications for the rest of the market. Naturally, these holders aren’t too likely to exert influence in the short term (as they usually remain silent), but in the long term when the effects of their behavior could emerge.
Here is a chart that shows the trend in the Bitcoin HODLer Growth Rate for this particular segment of the LTHs over the past decade:
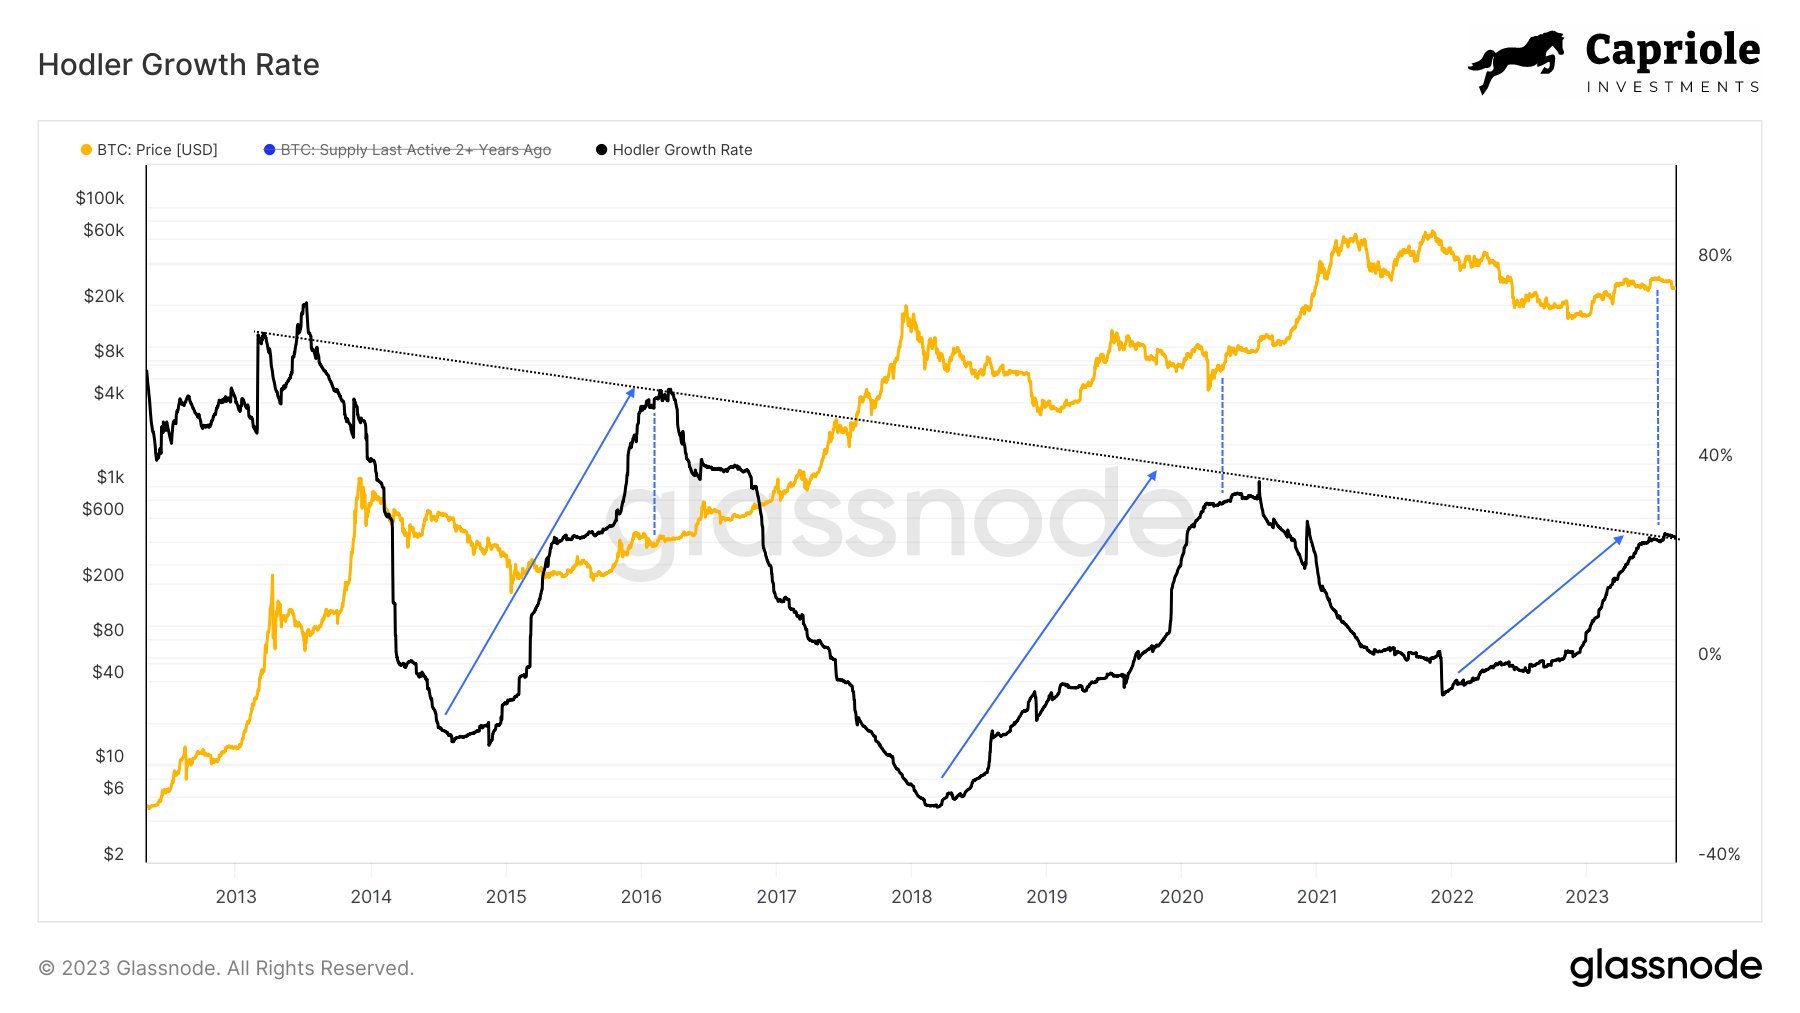
As Charles has marked in the above graph, there appears to be a specific pattern that the Bitcoin HODLer Growth Rate has followed throughout the cycles.
It would seem that during bear markets, the indicator’s value remains positive and in an uptrend, suggesting that these investors expand their holdings in such periods, and as prices dip further, they only up the pace of this accumulation.
As the bear market approaches its end and a transition towards a bull market takes place, the metric’s value goes flat, implying that these investors still accumulate, although at a constant rate, rather than an accelerating one. Then, as the bull run starts, these Bitcoin HODLers slowly stop the accumulation entirely and begin to participate in distribution instead.
The analyst notes that the Bitcoin HODLer Growth Rate now appears to have finished up the rapid bear market expansion phase and is now starting to plateau sideways.
Naturally, if the pattern of the previous cycles is anything to go by, it can mean that the Bitcoin market is now in the middle of the transition towards the next bull run.
BTC Price
Bitcoin remains stuck in a range as its price still trades around the $26,100 level.


