Bitcoin Bulls Roar: Analysts Predict Surge To $82,000 Amid Bullish Pennant Formation

Renowned crypto analyst Jelle has caught the attention of the Bitcoin (BTC) community with his bold prediction of a target price of $82,000.

Notably, despite recent challenges in breaking above the $66,000 mark, Bitcoin currently hovers around $67,780, showing resilience in the face of a short-term pullback.

BTC To $82,000 Soon?

In an X post uploaded earlier today, crypto analyst Jelle shared his latest view on Bitcoin. According to the analyst, the Bitcoin target “remains the same: $82,000”.

It is worth noting that Jelle’s forecast is based on his observation of a “bullish pennant” formation, a technical pattern that suggests a potential surge in the price of BTC. According to the analyst, the asset might experience some volatility this month.

Jelle emphasized that a bullish pattern is forming, coinciding with the upcoming BTC halving in a few weeks. This adds credibility to the emerged bullish pennant formation and the possibility of Bitcoin reaching $82,000 shortly.

Notably, the Halving is a pre-programmed event built into the Bitcoin protocol that occurs approximately every four years or after every 210,000 blocks are mined to reduce the reward for mining new Bitcoin blocks, ultimately decreasing the supply of new coins.

Historically, the event has triggered bullish price movements, as reduced supply often leads to increased demand and speculative buying. The Bitcoin halving is currently less than 20 days away.

Bitcoin Latest Price Action

While BTC has faced challenges in its upward trajectory over the past week, recent movements suggest a shift in momentum. Within the last 24 hours alone, the asset has shown a promising 2.7% increase, rising from a low of $65,135 to its current trading price of $67,628.

Bitcoin (BTC) price chart on TradingView

Despite this positive movement, BTC still reflects a decline of approximately 6.4% over the past 7 days. However, amid this fluctuation, analysts such as Captain Faibik foresee the potential for a significant rebound in Bitcoin’s value before April concludes.

Captain Faibik’s analysis, mirroring the sentiments of fellow analyst Jelle, focuses on Bitcoin’s bullish pennant formation observed on the 12-hour timeframe chart. This formation suggests an imminent breakout towards the upside.

If this breakout materializes successfully, BTC could soar to unprecedented levels, with projected price targets ranging from $88,000 to $90,000 by month’s end, according to Captain Faibik.

Featured image from Unsplash, Chart from TradingView

Bitcoin Next Stop $80,000? Crypto Analyst Sees BTC Soaring Ahead Of 2024 Halving

As the crypto market braces for the upcoming Bitcoin (BTC) halving in April 2024, the discussion surrounding Bitcoin’s price trajectory has continued to gain momentum. Particularly, Michaël van de Poppe, a well-regarded figure in the crypto analysis domain, has shared his latest analysis on Bitcoin.

Next Stop $80,000?

In a post shared on X, Van de Poppe suggests that Bitcoin is on the cusp of a notable rise, eyeing a target range between $75,000 to $80,000 in the lead-up to the halving event.

This prediction is based on the current consolidation phase of Bitcoin, indicating a buildup toward testing its all-time high with the potential for a subsequent correction.

Notably, Bitcoin halving plays a crucial role in this scenario, serving as a pivotal event that historically influences Bitcoin’s market dynamics.

The halving, scheduled to occur in April 2024, will see the reward for mining new blocks halved, thereby reducing the rate at which new BTC are created and entering the market.

This event, occurring approximately every four years, is anticipated to create scarcity, pushing the demand and possibly the price higher than past patterns have suggested.

Bullish On Bitcoin

In addition to Van de Poppe’s predictions, other analysts have shared their optimistic outlooks regarding Bitcoin’s potential price movement. Jelle, another esteemed crypto analyst, posits that Bitcoin is poised for a significant leap, potentially breaching the $100,000 mark sooner than expected.

This bullish sentiment is also echoed by Doctor Profit, who highlights the importance of understanding Bitcoin’s current market behavior, including its recent sideways movement. He identifies this movement as an accumulation phase poised to catalyze a surge past the $80,000 mark, aiming for $100,000.

The significance of accumulation in this context cannot be overstated. As recently reported by NewsBTC, there is an increase in the number of addresses holding at least 1,000 BTC, suggesting that institutions and large-scale investors are gearing up for what may come post-halving.

However, despite this accumulation, Bitcoin over the past 24 hours has declined by nearly 2%, with a current market price below $70,000.

Bitcoin (BTC) price chart on TradingView

Featured image from Unsplash, Chart from Tradingview

The Price Peak Puzzle: Unraveling The Timing Of Bitcoin Bull Market Peak

As Bitcoin (BTC) continues its remarkable ascent, reaching a new all-time high (ATH) of $72,300, investors wonder when the current bull market will peak. Considering historical data and the upcoming halving event scheduled for April 2024, crypto analyst Rekt Capital has provided insights into potential timing. 

Bitcoin Peak Expected Sooner Than Expected?

By examining previous halving cycles and the “acceleration” observed in the current cycle, Rekt Capital suggests that Bitcoin’s bull market may peak within 266-315 days from breaking its old all-time high, potentially occurring in December 2024 or February 2025.

Rekt Capital’s analysis reveals that Bitcoin has historically peaked in its bull market approximately 518-546 days after a halving event. However, the current cycle demonstrates accelerated growth, reducing approximately 260 days. 

According to the analyst, this acceleration has the potential to halve the typical cycle length, indicating that Bitcoin’s peak in the current bull market may occur much sooner than anticipated.

Bitcoin

Rekt Capital’s perspective, measuring the bull market peak from when an old all-time high is breached, provides valuable insights. In this cycle, Bitcoin recently broke to new all-time highs, indicating a potential milestone in the market. 

If the accelerated perspective holds, the next bull market peak is estimated to occur within 266-315 days from this breakout, landing somewhere between December 2024 and February 2025, according to the analysis provided by Rekt. 

Roughly every four years, Bitcoin’s halving events have historically played a crucial role in shaping market cycles. These events reduce the block reward miners receive, thereby reducing the rate of new Bitcoin supply, but this time may be different, according to Rekt, another analyst.  

From Four-Year Cycle To New Horizons

Similar to Rekt’s analysis, market expert Crypto Con suggests that the “conventional four-year cycle” may no longer hold, as Bitcoin is reaching new all-time highs sooner than expected, and as such, Crypto Con believes that the “boundaries of the traditional cycle” are being pushed, potentially signaling a paradigm shift in Bitcoin’s market dynamics. 

Historically, Bitcoin’s price cycles have adhered to a four-year pattern, characterized by market peaks around four years after each halving event. However, Crypto Con challenges this notion, arguing that the current cycle deviates from the “traditional timeline.” 

Bitcoin’s recent entry into “price discovery mode” and the achievement of new ATHs approximately a year earlier than expected suggest that the four-year cycle may no longer hold its predictive power.

Bitcoin

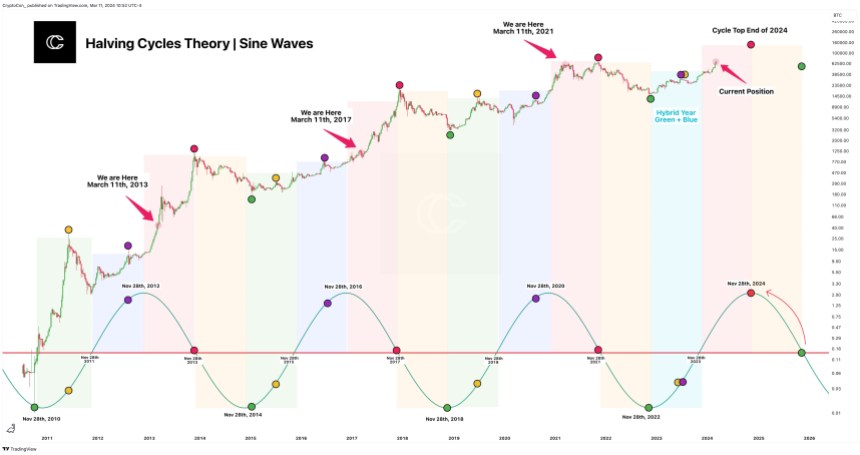
Crypto Con’s analysis indicates that the current market trajectory aligns more closely with the 2017 bull run than with previous cycles. Comparing the first tops of cycles 1 and 3 (2013 and 2021) to the present, both instances were on the verge of forming their initial peaks around April, mirroring the current market conditions. 

This observation supports the possibility of Bitcoin’s next bull market peak occurring in late 2024 rather than the previously anticipated late 2025.

Featured image from Shutterstock, chart from TradingView.com 

Bitcoin Fear & Greed Index Reaches Lowest Level In Three Months, Is The Bleed Over?

Amid the current market turmoil, the Bitcoin Fear & Greed Index has continued on a sharp decline. This decline has seen the index fall to its lowest level in over three months as crypto investors become more fearful and hold their investments from the market.

Bitcoin Fear & Greed Index Takes A Nosedive

In the months leading up to the end of the year 2023, the Bitcoin Fear & Greed Index climbed steadily until it reached high greed levels. Now, this index takes a number of factors into consideration to place investor sentiment across a number of categories ranging from Extreme Fear, Fear, Neutral, Greed, and Extreme Greed.

The Fear & Greed Index represents investor sentiment using scores between 1 and 100, with the lower end of the score representing fear levels and the higher ends representing greed. A score between 1 and 25 puts investor sentiment in Extreme Fear, 26-46 is Fear, 47-52 is Neutral, 53-75 is Greed, and 76-100 is Extreme Greed.

In 2023, the score climbed as high as 74 as Bitcoin rallied toward $50,000. However, as the market has retraced, so has investor sentiment, which is currently trending toward fear. At the time of writing, the Bitcoin Fear & Greed Index is showing a score of 58, which puts it in Neutral territory. It is also two scores down from the previous day’s figures of 50 which means that investor sentiment is trending more toward fear than greed.

Bitcoin Fear & Greed Index

The current figure is the lowest that the index has been since October 2023. The last time the Bitcoin Fear & Greed Index fell below 48 was on October 17 2023. In cases like these, it shows that investors are less inclined to put money into the market. This causes demand to fall, and as a result, prices of assets across the space suffer for it.

Bitcoin price chart from Tradingview.com (Fear & Greed Index)

When Will The Bleed Stop?

So far, the decline in the Bitcoin price has been triggered by massive outflows from the Grayscale Bitcoin Trust (GBTC) as investors redeemed their shares. Over $2 billion in BTC has flowed out from the fund, and this has put a lot of selling pressure on the asset.

However, as the week progresses, the outflows are expected to slow down as investors stop selling. In such a case, the demand would be all to catch up with the supply being dumped on the market, thereby giving Bitcoin and other assets a chance to recover.

At the time of writing, the Bitcoin price is still trending around $40,000 after a bounce back from a dip to $38,500. The price is up 2.6% in the last week, according to data from Coinmarketcap.

Hold On For Four Months: Analyst Predicts When Bitcoin Price Will Reach New ATH

Bitcoin has been experiencing a downward trend recently, dropping from its 2023 all-time high of about $49,000 to below $41,000 at the time of writing. Despite this significant price correction, popular crypto analyst Kevin Svenson has predicted a new all-time high for BTC in the months after the 2024 Bitcoin halving. 

Bitcoin Anticipated To Hit New All-Time High

Svenson released a YouTube video last week, predicting that BTC’S new all-time high is set for June 2024. Despite the hype surrounding the approval and launch of Spot Bitcoin ETFs, the crypto analyst revealed that Bitcoin has been witnessing significant declines and is currently approaching the critical price level of $40,200. 

The crypto analyst compared Bitcoin’s price movements with the recent stock market patterns. Last Friday, Wall Street stocks, particularly the S&P 500 index, achieved an all-time high of 4,839.81, surpassing its previous record in January 2022. 

Svenson pointed out a significant correlation between Bitcoin and the S&P 500 index in the months leading up to and following the Bitcoin halving. According to the crypto analyst, the last three Bitcoin halvings illustrated a key price pattern for BTC as the stock market hit its all-time high.

The analyst explained that after the first Bitcoin halving in November 2012, the S&P 500 index hit its all-time high, and BTC followed after, recording an all-time high two months later. 

Additionally, in the second halving in July 2016, the S&P 500 index achieved a record high, after which Bitcoin hit an all-time high about seven-and-a-half months later. In the third halving in May 2020, the S&P 500 index broke its all-time high in August, with BTC following suit about four months later.

Svenson has suggested that these results reveal a unique correlation between the price of BTC and the S&P 500 index during the halving phases. Using the average time difference observed in the three halving events, he projected the timeline for Bitcoin’s all-time high in the upcoming halving in April 2024. 

According to the crypto analyst, BTC is expected to achieve a new record high in approximately four-and-a-half months after the S&P 500 index hits its own all-time high. 

BTC Overcomes Critical Price Level

In his video, Svenson disclosed that BTC has successfully bounced off the critical price level of $40,200. He revealed that the cryptocurrency had achieved this feat around the same time the S&P 500 index had recorded its new all-time high. 

“Bitcoin is already bouncing, the weekly is now back in the green, and the daily chart, the daily candle is now also back in the green,” Svenson said.

It’s important to note that at the time of writing, the price of Bitcoin was trading at $40,832, reflecting a 2.06% decline in just 24 hours, according to CoinMarketCap. The crypto analyst warned that if BTC had failed to overcome the critical support level, it could have triggered major bearish signals. 

Svenson also noted that the recent gains in the stock market presented a positive development for both Bitcoin and altcoins in the crypto market. He stated that the stock market’s new all-time high would enable Bitcoin to effectively secure its critical position while also potentially influencing speculator sentiment positively within the crypto space.

Bitcoin price chart from Tradingview.com (Crypto analyst)

Bitcoin Bounces Back Before Hitting 2017 Peak, Is The Bottom In?

The price of bitcoin had dropped dangerously close to the 2017 cycle peak on Wednesday. It was a brutal decline for investors who watched their BTC portfolios incur losses after losses. Speculations were rampant in the space on what a touch below $20,000 would have meant for the market. The implications were abundant in their impact but the recovery back above $21,000 has staved off the bears, if only for a little while.

Is The Bitcoin Bottom In?

After the market recovery on Wednesday, it has become apparent that there has been some intervention in the market crash. With bitcoin in the $20,000 level, many had resigned to the fate that there would be no respite until the 2017 high levels were broken. If this had happened, it would have marked a first-of-its-kind event in the history of bitcoin where the digital asset had always managed to never trade below previous cycle peaks. 

Related Reading | Bitcoin Crash Sends Institutional Investors Running For The Hills

As such, significant support forming right above $20,000 has restored some hope in the market that this would be the bottom. So far, this theory has managed to hold as bitcoin has turned back into the green for the first time since the crash began.

More importantly, though is the fact that the recovery has not been significant by any measure. The digital asset still remains well below its 20-day moving average, a sign that bears can easily take hold once more. 

BTC decline triggers fear of hitting previous cycle peak | Source: BTCUSD on TradingView.com

However, bitcoin is said to be at oversold levels. So, the market expects to see fatigue in the sell-offs that have been rocking the digital asset. A slowdown would definitely be good for bitcoin but it would need to see more recovery to ensure this.

Implications Of Falling Below $20,000

The $20,000 level is important for bitcoin to hold for a number of reasons. One of the most major of these are the MicroStrategy bitcoin-backed loans. The way these loans are structured leave open a margin call opportunity if BTC to fall below its previous peak cycle. And although CEO Michael Saylor has assured the market that the firm has more collateral to put towards its loan to avoid a margin call disaster, it remains a very real possibility.

Related Reading | Double-Digits Losses Are The Order Of The Day As Bitcoin Declines To $20,000

Another implication is the Celsius liquidity levels. Now, the first is said to have paid off some of its loans which had pushed its liquidation price back to $14,000 but a break below $20,000 shows no significant support and would quickly see the lending protocol liquidated.

Last but not least is the fact that bitcoin at $20,000 represents an important technical and psychological level. Given that the majority of BTC-denominated open interest are all at the $20,000 level, a break below this would see renewed sell-offs from investors. 

The only major support after this level is at $16,000, after which, it falls to $14,000, the Celsius liquidation price. However, if bitcoin is able to recover above $25,000 by the end of the week, a test of the $29,000 resistance point would quickly follow.

Featured image from Listverse, chart from TradingView.com

Follow Best Owie on Twitter for market insights, updates, and the occasional funny tweet…

Bitcoin Crash Sends Institutional Investors Running For The Hills

Small and retail investors are not the only ones getting hit hard by the Bitcoin crash. Institutional investors are also feeling the heat of the market crash. This has sent the institutional investors running as inflows had halted for the last week. Outflows from crypto and blockchain-related investments grew steadily over the course of the weeks, totaling more than $100. million.

Institutional Investors Stay Away

The institutional outflows for last week have been concerning for crypto investors but in no way surprising. With the emergence of the ‘crypto winter’, it has signaled that the bear market is in full force. Thus, investors are forced to react accordingly.

Outflows had climbed throughout last week and had come out to a total of $102 million. It culminates a long-running outflow trend that had mostly stayed in the altcoins. However, this time around, bitcoin has been drawn into this trend.

Related Reading | Bitcoin Drops To 18-Months Lows, Has The Market Seen The Worst Of It?

The pioneer cryptocurrency saw outflows totaling $57 million last week alone. This was the case across the short-bitcoin investment products which had also recorded outflows. For bitcoin, these weekly outflows bring its month-to-date outflows to $91 million. Short-bitcoin investment products are now only seeing $55 million of total assets under management (AuM) compared to $27 billion for its longer-term bitcoin investment products.

Total market cap drops below $1 trillion | Source: Crypto Total Market Cap on TradingView.com
Outflows All Across Crypto

Ethereum had been recording consistent weeks of outflows over the past several months and this past week was no different. The second-largest cryptocurrency by market cap saw $41 million in outflows this past week. This brought its year-to-date outflows to $387 million, only now making up 4.4% of the total crypto-assets under management. 

Blockchain quiddities have also joined the league of outflows with a total of $5 million in the past week. As well as multi-asset investment products which saw $4.7 million of outflows. The majority of the outflows recorded for last week have been from the Americas, making up more than $98 million outflows. Their European counterparts only recorded $2 million in outflows for the same time period. 

Related Reading | Exchange Inflows Ramp Up As Crypto Investors Clamor To Exit Market

What this shows is the general sentiment of investors towards the crypto market no matter what avenue they have invested through. The bear market is expected to last for at least another year and as such, investors have begun to plan accordingly. 

The crypto market cap has now fallen below $1 trillion for the first time since January 2021. With sentiment skewing powerfully into the negative, there is no sign of recovery or relief for investors.

Featured image from The Financial Express, chart from TradingView.com

Follow Best Owie on Twitter for market insights, updates, and the occasional funny tweet…

Bitcoin Drops To 18-Months Lows, Has The Market Seen The Worst Of It?

Bitcoin is once again leading the market in the most recent descent into the red. This has seen the pioneer digital asset fall to 18-month lows and it has taken the rest of the market down with it. In such climes, it is usually advised that investors remain calm but that is easier said than done. Bitcoin which looked poised to visit the mid-2020 levels has not formed any kind of support and as such the market continues to wonder if the worse is yet to come.

More Bitcoin Dumps Incoming?

With the current bitcoin prices, it is now well below its 50 and 100-day moving averages. This has cemented the bearish trend for the digital asset, regardless of any positive performance over the next few days. In fact, there is every possibility that the price of the digital asset will most likely dump to 2017 all-time high levels before there is a recovery in this regard.

Related Reading | Bitcoin Decline Sees Funding Rates Plunge To Three-Month Lows

It is also important to note that it was said that the cryptocurrency had been at oversold levels, hinting at fatigue on the part of sellers. However, recent trends have shown that this was not the case. Rather, it had been a setup for even worse sell-offs. 

Due to this, it is most logical to view the market from the point of view of a prolonged bear market. Yes, there may be some merit to buying the red right now but if previous bear markets have taught investors anything, it is the fact that it can always get worse.

BTC price dumps to $23,000 level | Source: BTCUSD on TradingView.com

Also taking into account that previous bear markets have seen the price of the leading digital assets dump about 90% in the past. Even with the recent decline, Bitcoin and Ethereum still remain above these levels. This means that if they were to dump completely to follow previous trends, then there might be more pain ahead for investors.

Investor Sentiment In the Gutter

With the decline in the price of bitcoin had come great fear. This has seen the Fear & Greed Index dip toward historical levels. The reading on the index currently stands at 11, one of the lowest it has been in recent times. This indicates that investors do not want to put money in the market. Instead, they are looking to sell off, even at a loss, to mitigate further losses. 

One thing to note, however, is what times like these have bred in the past. When most retail investors are scared to go into the market, larger investors tend to take advantage of this fear and play it for their own gain. Buying up large quantities of BTC, causing the price to spike once more.

Related Reading | Bitcoin Open Interest Falls As Price Dips Below $31,000

This puts the whales in automatic profit. But there is also a risk to following these trends because the spike in price brought about by such large buys can be easily lost. In such cases, prices have been known to decline even more compared to their previous points.

In markets like this, caution needs to be applied to every move made. This is the bedrock of any investing strategy. Bitcoin’s volatility is legendary and true to form, the volatility can swing either way, causing profits or losses.

Featured image from Forbes, chart from TradingView.com

Disclaimer: The following op-ed represents the views of the author, and may not necessarily reflect the views of Bitcoinist. Bitcoinist is an advocate of creative and financial freedom alike.

Follow Best Owie on Twitter for market insights, updates, and the occasional funny tweet…

ARK Invest: Despite The 9 Red Candles, “Bitcoin’s Fundamentals Remain Strong”

The inaugural edition of ARK ’s “The Bitcoin Monthly” report contains some gems. It also contains a simple compilation of facts that paint a clear picture of the bitcoin market as it currently stands. A blockchain is an unalterable fountain of evidence, and ARK put their best analysts to review it in-depth and get stats and insights for us. Get some coffee and take a seat, let’s forget about the Fear & Greed index and see what the numbers are really saying.

Excited to introduce the first official issue of “The Bitcoin Monthly”

Starting this month, ARK will be publishing an in-depth report covering Bitcoin’s market action and sharing where we think the market's headed.

Here are the major highlights from this month’s report:

— Yassine Elmandjra (@yassineARK) June 3, 2022

Over at Twitter, ARK Analyst Yassine Elmandjra described “The Bitcoin Monthly” as: “Starting this month, ARK will be publishing an in-depth report covering Bitcoin’s market action and sharing where we think the market’s headed.” On ARK’s website, they describe the new venture as: “Considering the market’s fast pace of change, ARK publishes The Bitcoin Monthly, an “earnings report” that details relevant on-chain activity and showcases the openness, transparency, and accessibility of blockchain data.”

Related Reading | Bitcoin Price Closes Two Consecutive Weekly Red Candles, First Time Since Bottom

Let’s check the data and insights available in May’s edition.

The State Of The Bitcoin Market, With ARK

According to “The Bitcoin Monthly”:

  • “Bitcoin closed the month of May down 17.2%, declining from $38,480 to $31,835.”

Let’s be honest, this looks like the beginning of a bear market. And the Terra/ Luna crash appears to be the catalytic event. However, subsequent data will show that we might not be in one after all. 

  • “Bitcoin closed the month down 17.2%, printing its ninth consecutive negative weekly decline for the first time in history, suggesting a possible oversold condition.”

Nine consecutive red candles, a new record. That’s a horrific fact no matter how you dress it. However, according to ARK, it suggests “a possible oversold condition.” Which is promising. 

  • “Bitcoin is down 57% since reaching an alltime high in November 2021. For perspective, the average peak-to-trough drawdown during previous bear markets stands at 76%.”

Does this mean things could get worst? Or does it mean we’re not near bear market levels? It definitely feels bear-markety, but the stats are the stats. 

BTC price chart for 06/04/2022 on Exmo | Source: BTC/USD on TradingView.com
The Bitcoin Network Stands Strong

  • “Despite the continued sell-off, bitcoin has not broken below any major trendline. It is trading above its onchain cost basis at ~$24,000 and its 200- week moving average at ~$22,000.”

The bitcoin network absorbed Terra/Luna’s massive sell-off and the market’s subsequent one like a champ. The worst seems to be behind us and bitcoin “has not broken below any major trendline.”

  • “An all-time of nearly 66% of bitcoin’s supply has not moved in over a year, a testament to the market’s longer-term focus and a holder base with stronger conviction.”

Despite the massive market movement, bitcoiners keep HODLing like it’s the only chance at economic freedom that they’ll see in their lifetimes. Because it is.

  • “Short-term holder positions fell -35% below their breakeven price, on average.”

If bitcoiners are HODLing, who’s selling all those cheap sats? Short-term holders, that’s who. And they’re not even close to breaking even. It’s a short-term holders massacre out there.

ARK Sees A Way For The Market To Jumpstart Itself

Look, hear ARK out. First of all, “bitcoin’s open interest in the futures market has reached an all-time high of approximately 450,000 BTC.” Also, “perpetual contract basis typically hints at market direction. Currently, it is trading at a bullish discount to spot.” This is very important because, “given the high open interest outstanding, we believe the perpetual futures discount indicates a potential upward trajectory in BTC’s next major price movement.”

Related Reading | Revisiting Dorsey’s Hyperinflation Tweet: Elon, Wood, Saylor, Balaji, Chip In

That’s right, ARK closes “The Bitcoin Monthly” report predicting “a potential upward trajectory.”

Featured Image by Ricardo Gomez Angel on Unsplash | Charts by TradingView

Quant Explains Similarities Between Current And Summer 2020 Bitcoin Markets

A quant has pointed out some similarities between the current and summer 2020 Bitcoin markets through on-chain data.

Bitcoin Exchange Supply Shock Ratio Has Rapidly Risen Recently

As explained by an analyst in a CryptoQuant post, there seem to be some similarities between the current market trend and that during the summer of 2020.

The “exchange supply” is an indicator that measures the total amount of Bitcoin present on wallets of all exchanges.

This supply is usually assumed to be the selling supply of the crypto as investors generally transfer their coins to exchanges for selling purposes.

The supply in cold wallets of investors, on the other hand, is likely being held for accumulation, and is unlikely to be sold.

The ratio between this investor wallet supply and the exchange reserve is called the “exchange supply shock ratio.”

When the value of this metric goes up, it means the supply on exchanges is dropping and investors are filling up their cold wallets.

Related Reading | Bitcoin Futures Basis Nears One-Year Lows, How Will This Affect BTC?

On the other hand, a downtrend suggests a push to sell from sellers as they deposit their Bitcoin to centralized exchanges.

Now, here is a chart that shows the trend in the BTC exchange supply shock ratio over the past couple of years:

The value of the indicator seems to have been on the rise recently | Source: CryptoQuant

In the above graph, the quant has marked the relevant trends of similarity between the Bitcoin markets of summer of 2020 and of right now.

It looks like during both the periods, the price was trending down or moving sideways, while the exchange supply shock ratio had been rapidly going up.

Related Reading | Institutional Investors Bearish On Bitcoin, Ethereum. Here’s What They’re Buying

Despite the struggling price at the moment, investors have showed demand for the crypto as they have been rapidly accumulating recently (similar to back then).

What followed a few months after the summer of 2020 was the start of a new Bitcoin bull run due to the resulting “supply shock.”

The BTC price is heavily tied to the stock market currently, and the analyst believes it’s possible that once it decouples, a similar shock could be there this time as well.

BTC Price

At the time of writing, Bitcoin’s price is trading around $39.8k, down 7% in the past week. Over the last month, the crypto has lost 15% in value.

The below chart shows the trend in the price of the coin over the past five days.

The price of the crypto looks to be steadily climbing back up after the plunge down a few days ago | Source: BTCUSD on TradingView
Featured image from Unsplash.com, charts from TradingView.com, CryptoQuant.com

Bitcoin Dominance Drops To 42% As Price Declines Below $43,000

Bitcoin has continued its descent towards $40,000 proving that the reversal was only temporary. While there is not enough to rule out another recovery, the current trend does point to more downside before the digital asset can find its footing and recover above $44K. This hard-fought resistance point that the cryptocurrency had managed to beat is becoming more and more elusive.

The decline is also apparent in the market dominance of the digital asset. Bitcoin which maintains a majority share of the crypto market continues to see fierce competition from other digital assets. As investors have moved towards altcoins for the gains, so have the market share gone with them.

Bitcoin Market Dominance Declines

Bitcoin had started out the year 2022 on a low note. It had been a hard month for the digital asset by that point and the effects from the December crash were still being felt across the market. Not only had the price of the digital asset taken a hit, but its market dominance had also suffered too, which saw it drop below 40% for the first tie in over six months.

Related Reading | Top 5 Watershed Moments In BTC On-Chain Analysis’ History. Is Your Favorite In?

It had quickly recovered after that but not by much. It had bounced up to a high of 43.46% at the beginning of the week following the market recovery. This would prove to be short-lived as altcoins once again mounted fierce competition. Networks like Ethereum and Solana lead the charge with a wide range of DeFi and NFT offerings.

Bitcoin’s dominance quickly dropped after that. Crashing from its peak of 43.46% to its current position at 42.51%.

BTC dominance declines to 42% | Source: Market Cap BTC Dominance on TradingView.com

BTC still retains the majority dominance of the market despite this decline. The pioneer cryptocurrency is still a market leader and its movements on the charts are closely mirrored by altcoins in the space.

Losing Footing At $44K

Bitcoin at 44K is an important price point for the asset. It may not signal that the bull rally has returned but it does show significant movement towards the $45K-$46K mark that would mark another entrance into the bull market. Even though the asset had traded above 44K for the better part of yesterday, the early mornings of Thursday saw it lose $2,000 to crash to the low $42,000s.

Related Reading | How Fears Of A Possible Russian Invasion Of Ukraine Is Impacting Bitcoin

This has caused a decline in the strength of the digital asset given that it is now only trading above the 20-day moving average. With the value under the 50-day moving average, it signals a move of strength in favor of the bears.

A close below the 50-day SMA could see bitcoin decline above $40,000. While still a significant price point, there is not enough support for BTC below this point. The next support level lies at $42,027 with major resistance mounting at $44,767.

Featured image from MARCA, chart from TradingView.com

What A Decline Under $35,511 Would Mean For The Price Of bitcoin

Bitcoin has lost its footing at $37,000 and has now slipped into the $36,000 territory, sending the market into another frenzy of fear. It comes on the back of widespread speculations that the digital asset had indeed hit its bottom. But with the current trend, the digital asset may end up sliding down further. To this end, Fundstrat analyst Mark Newton has laid out the possibilities for bitcoin if it declines further than $35,511.

What Happens Below $35,511

Technical analyst Mark Newton has put forward a bullish outlook for bitcoin if it falls below this point. He told Bloomberg that a decline under this would inevitability lead to a test of $32,950. Also adding that the price of the digital asset moving above $40,000 would be an important point for the bulls.

Related Reading | Double Threat: Bitcoin And Ethereum, Start Of Bear Market Or Bullish Consolidation?

However, the market has seen massive sell-offs close to this price point in recent times that Newton’s predicted point for the bulls is yet to be hit. With the digital asset suffering so many price dips in such a short period of time, bitcoin looks more likely to fall below $35,511 than it is to give bulls a much-needed pull above the $40,000 point. The Fundstrat analyst explained that without reaching this point, the asset would remain on a downward trend.

“Until $40,000 is exceeded on a daily close, it remains in a downward sloping pattern, and it’s tough to rule out further weakness technically speaking,” the analyst said.

This reflects the cautious way of thinking that Newton is using to look at the market. At a point like this, there is no way to tell for sure what the market will do, so being wary is the best cause of action.

Bitcoin Bottom Is Not In

The technical analyst also touched on the bitcoin bottom, sharing thoughts that deviated from current trends. Newton said that the bitcoin bottom is not in yet. Instead, the analyst believes that the bottom will come in over the next few months.

Related Reading | Bitcoin Halving To Bring The Subsequent Crypto Frenzy

As for the recovery recorded following the market crash, he explained that it is only temporary. Furthermore, does not believe that it is an indicator that there will be an intermediate-term rally. “This minor two-week bounce might still be premature in expecting a new intermediate-term rally has begun,” Newton added.

BTC trending at $36K | Source: BTCUSD on TradingView.com

Bitcoin’s price still remains firmly in the $36,000 territory, suggesting that the short-term rally might be over. Bearish sentiment is the order of the day with market sentiment falling deep into extreme fear.

Bitcoin is trading at $36,800 at the time of this writing.

Featured image from CCN.com, chart from TradingView.com