Bitcoin Investors Watch Out: Miners Showing Unusual Exchange Inflow Activity

On-chain data shows the Bitcoin miners have been making an unusually high number of transactions to centralized exchanges recently.

Bitcoin Miner To Exchange Transactions Metric Has Just Seen A Spike

As pointed out by CryptoQuant author IT Tech in a new post on X, the Miner to Exchange Transactions indicator has been high recently. The “Miner to Exchange Transactions” keeps track of the total number of transfers that the miner-associated Bitcoin wallets are making to addresses connected with exchanges.

When the value of this metric is high, it means the miners are making a large amount of moves to these platforms. As one of the main reasons why these chain validators would deposit to exchanges is for selling-related purposes, this kind of trend can have a bearish effect on the BTC price.

On the other hand, the indicator being low implies miners aren’t making inflows to exchanges, potentially because they plan to hold onto their coins for a while. Naturally, this HODLing from this cohort can be a positive sign for the asset.

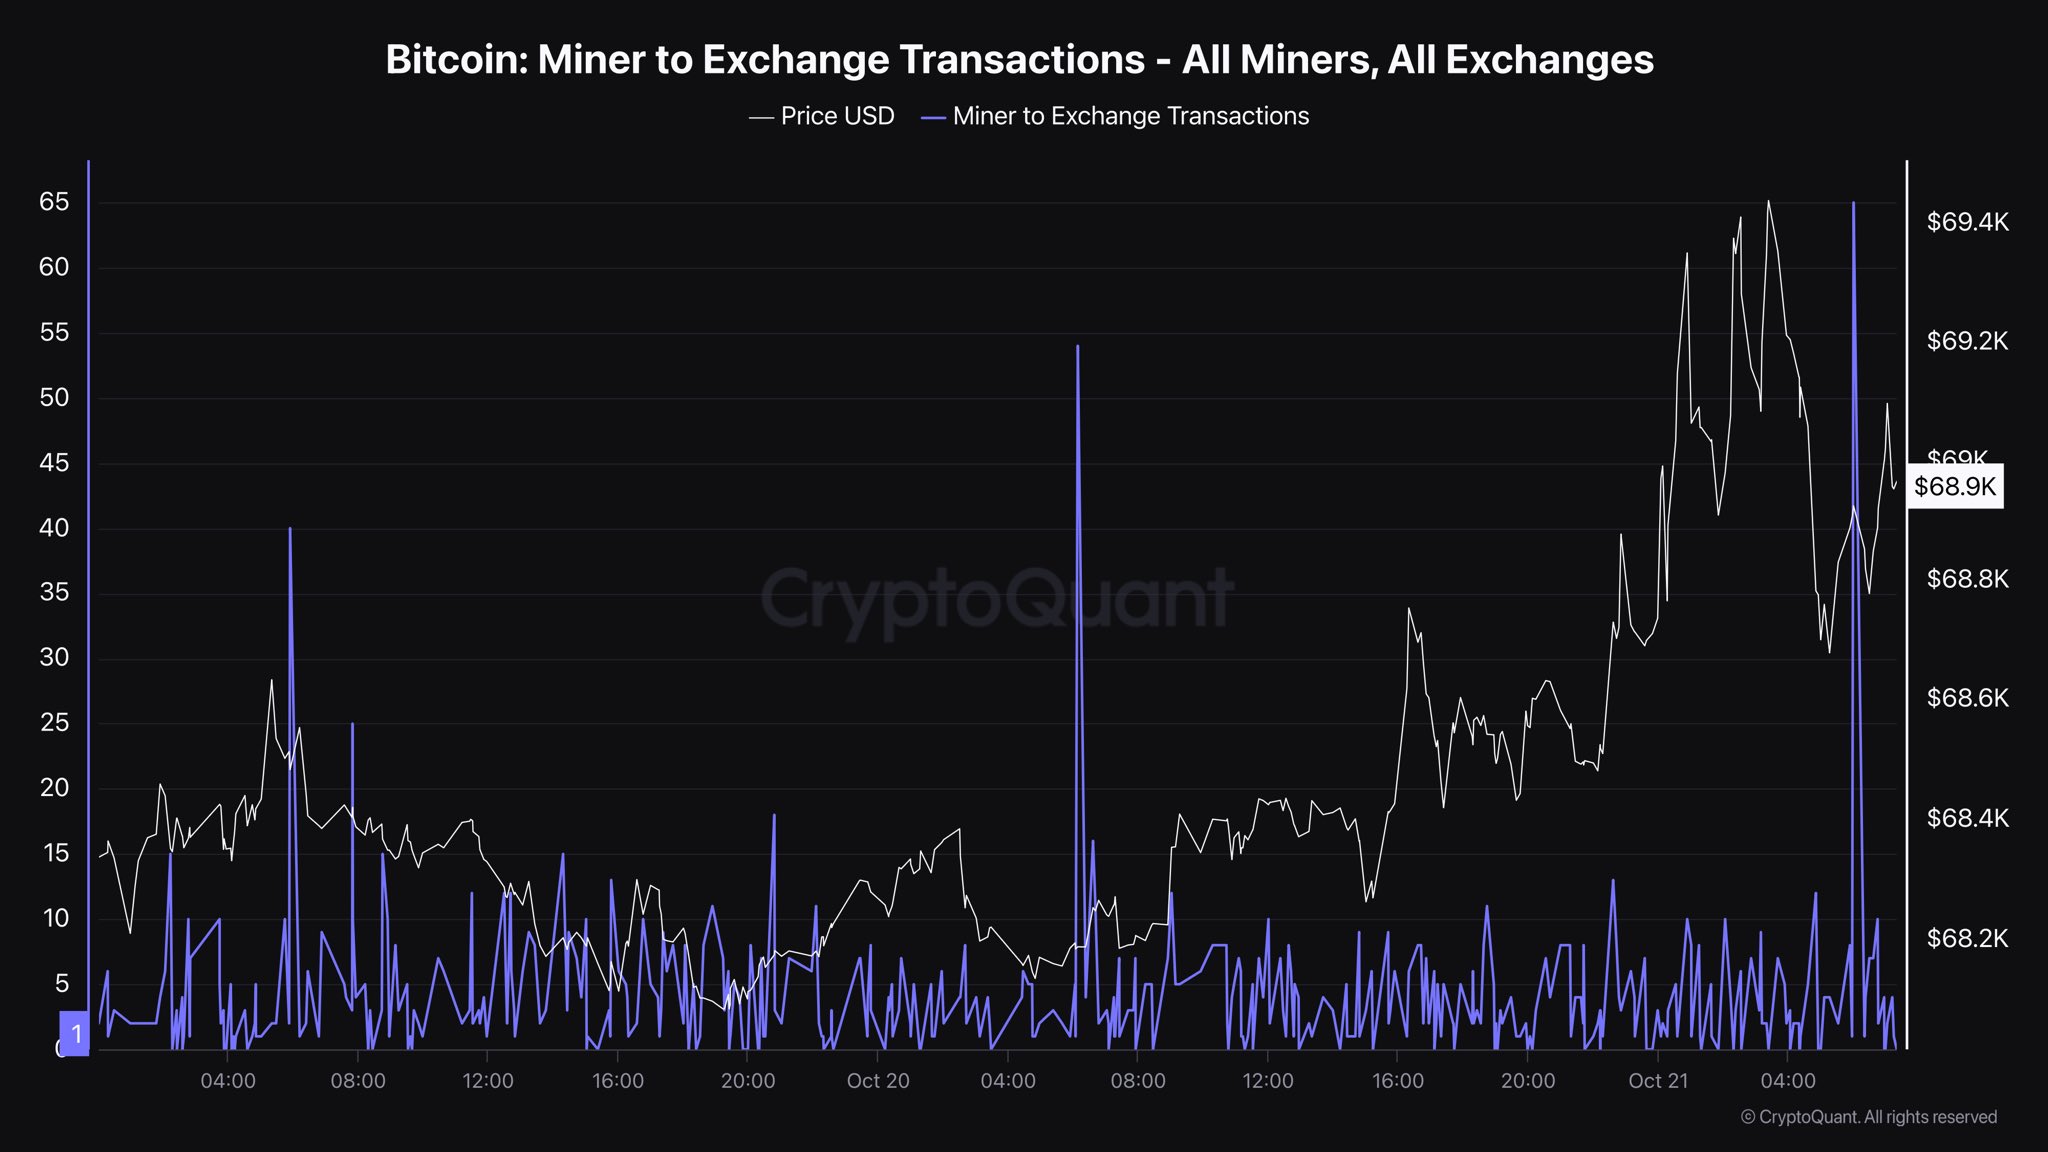
Now, here is a chart that shows the trend in the Bitcoin Miner to Exchange Transactions over the last few days:

Bitcoin Miner to Exchange Transactions

As displayed in the above graph, the Bitcoin Miner to Exchange Transactions has registered a large spike during the past day, suggesting that the miners have just made a large number of moves to these platforms.

It’s possible that this is an indication of a selloff from these chain validators, but whether this potential selling would actually affect the cryptocurrency depends on the exact scale of coins that’s involved in the transactions.

The analyst has also shared the data of an indicator that provides information related to it, called the Miner to Exchange Flow:

Bitcoin Exchange To Miner Flow

From the chart, it’s visible that this metric’s value has also shot up alongside the spike in the Miner to Exchange Transactions. At its height, the metric touched 225 BTC, which is equivalent to a little under $15.4 million at the current price.

This isn’t a small sum in itself, but when considering the scale of the total Bitcoin market cap, these exchange inflows hardly weigh to much. Thus, even if the miners plan to sell these coins, the market should be able to absorb the pressure just fine.

Miners are entities that have constant running costs in the form of electricity bills, so they tend to be regular sellers. Most of the time, their selling remains limited, which would make the recent value of the Miner to Exchange Flow in line with the norm.

The number of individual transfers to exchanges that the miners have made, however, is certainly unusual, so these indicators could be to keep an eye on in the coming days, in case more spikes pop up.

BTC Price

Bitcoin had surpassed the $69,000 level on Sunday, but the asset appears to have dropped back to $68,200 today.
Bitcoin Price Chart

Bitcoin Miner Selloff Is Calming Down: Green Sign For Rally To Continue?

On-chain data shows the Bitcoin miner exchange inflows have been dropping recently, a sign that may be bullish for the asset’s price.

Bitcoin Miner Exchange Inflow Has Been Declining Recently

As explained by CryptoQuant author Axel Adler Jr in a new post on X, miners have gradually been reducing their exchange inflows recently. “Exchange inflows” here naturally refer to transactions heading to wallets attached to centralized exchanges from self-custodial addresses.

In the context of the current topic, the exchange inflows made by miner-related wallets specifically are of interest. Generally, the main reason why miners transfer to these platforms is for selling, so large exchange inflows from them can be a sign that these chain validators are participating in a selloff.

Miners have constant running costs in the form of electricity bills, so selling from them is a regular occurrence, as without it, they can’t keep their operations going.

This regular selling is usually of a scale readily absorbed by the market, so there may be no visible negative effect on the asset’s price. Large and sustained exchange inflows, though, can be something to note, as they may imply unusual selling pressure from this group.

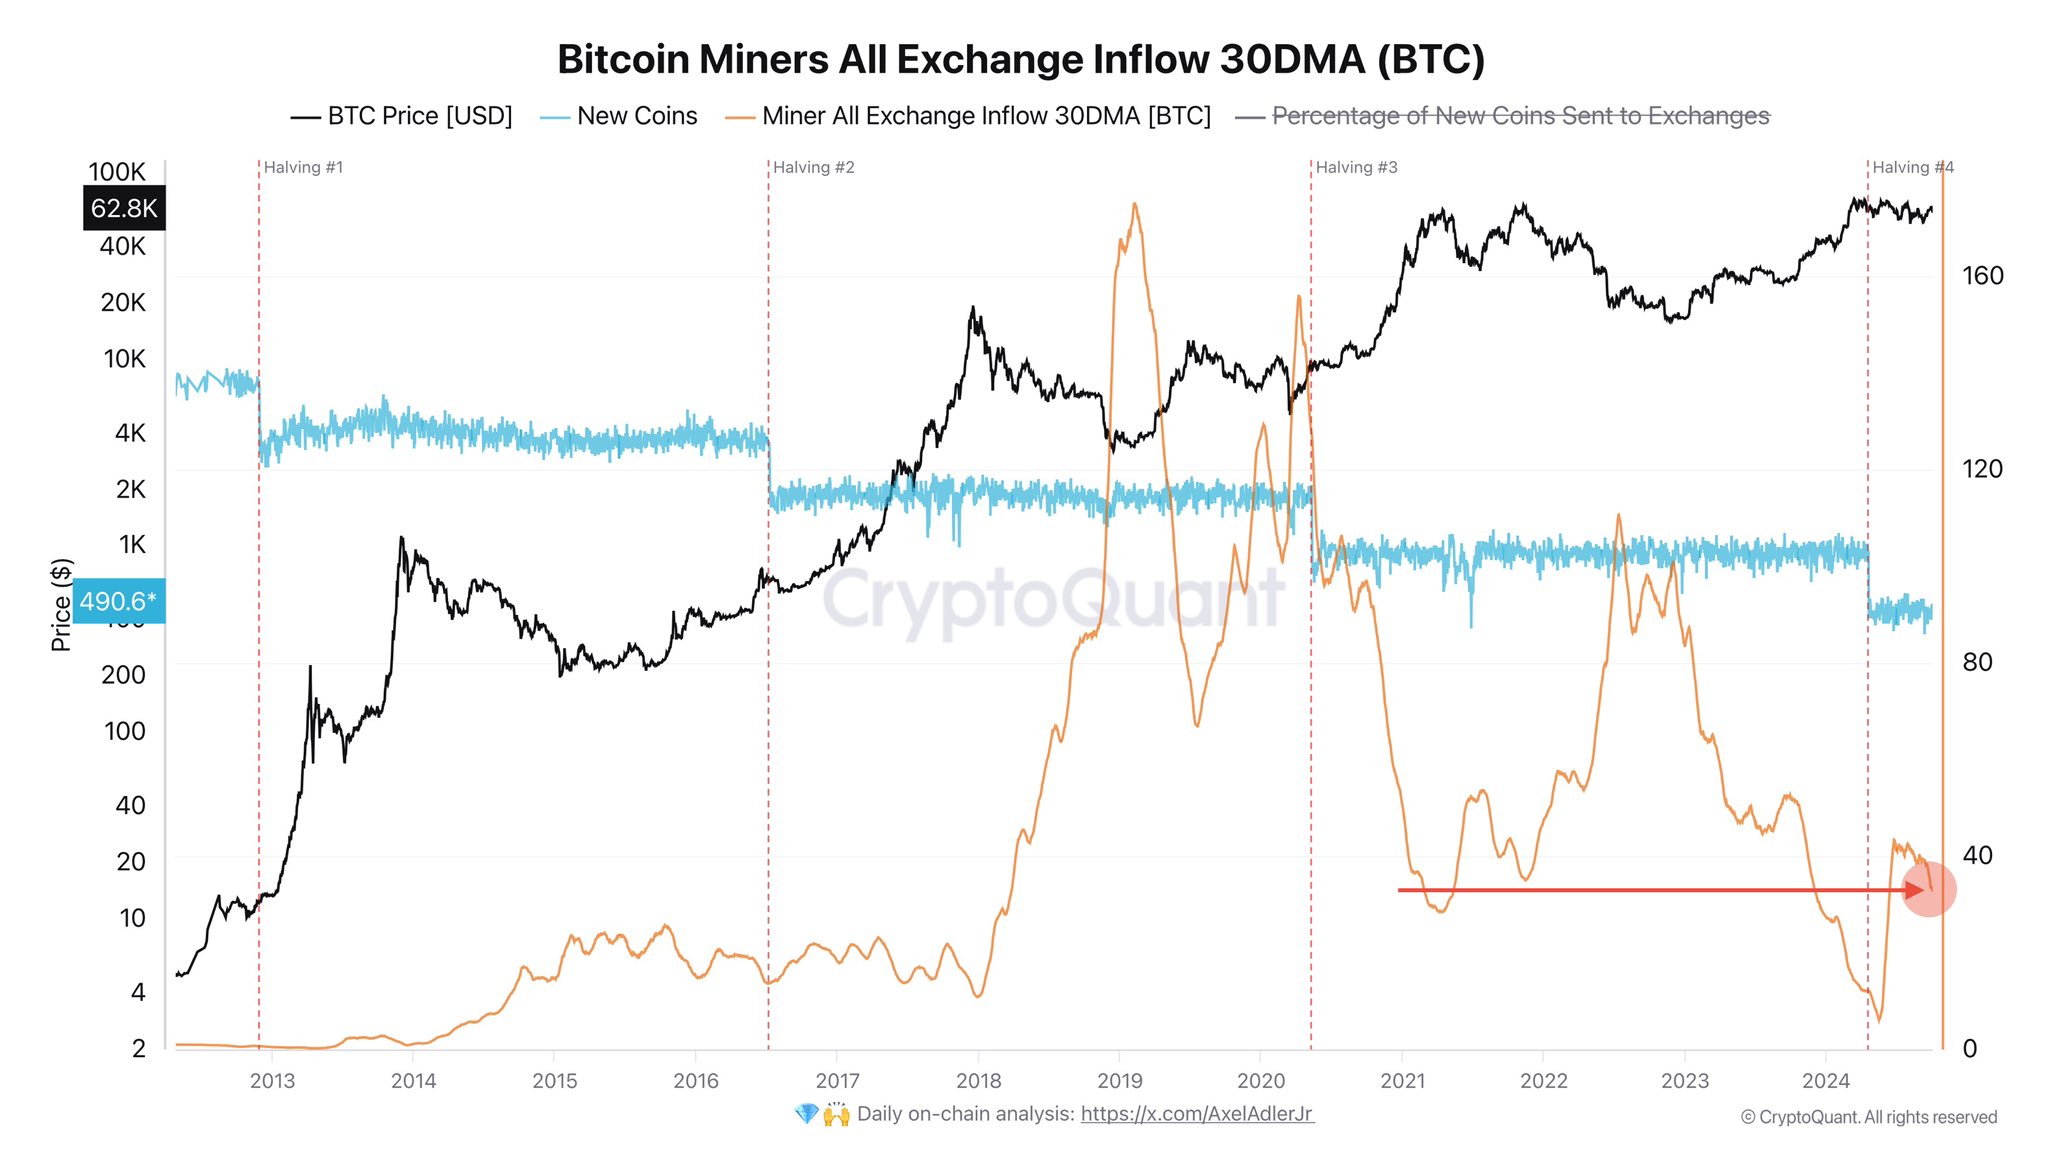
Here is the chart shared by the analyst that shows the trend in the 30-day moving average (MA) Bitcoin miner exchange inflows over the history of the cryptocurrency:

Bitcoin Miner Exchange Inflows

As the above graph shows, the 30-day MA of the Bitcoin miner exchange inflows had plunged to pretty low in the first few months of the year but then underwent a sharp reversal.

The reason for this increase could be that the fourth Halving occurred in April. Halvings are periodic events about every four years that permanently cut the BTC block subsidy in half.

In the chart, the analyst has also attached the data for the coin issuance on the network (colored in blue). From this metric, the effect of the Halving is apparent, as miners can suddenly only mint about half as many coins after each of these events as before them.

Miners make their income through two main sources, the transaction fees and the block subsidy, but most of the contribution generally comes from the latter. Thus, the miners depend on the block subsidy to make their income.

After the latest Halving, the miners naturally came under immense pressure because their revenue took a drastic hit. The exchange inflow trend would suggest that these chain validators had decided to sell off their reserves in response to this income squeeze.

The high inflows from the Bitcoin miners had continued for a while, but the 30-day MA of their exchange inflow has recently reversed, a potential sign that this cohort is finally pulling back on their selling. If this starts a sustained trend, then the cryptocurrency’s price might benefit from it.

BTC Price

Bitcoin has retraced much of its recent recovery during the last few days, as its price is now down to $60,300.

Bitcoin Price Chart

Bullish Reversal For Bitcoin? Retail Investors Flood Back As New Addresses Reach 4-Month Peak

Recently, the price of Bitcoin (BTC) has entered a consolidation phase, fluctuating between $61,000 and $62,000 after a brief drop to $58,000 on June 24. While retail investors have shown renewed interest alongside institutional counterparts, the market faces a mix of bullish signs and potential headwinds.

Retail Investors Return To Bitcoin 

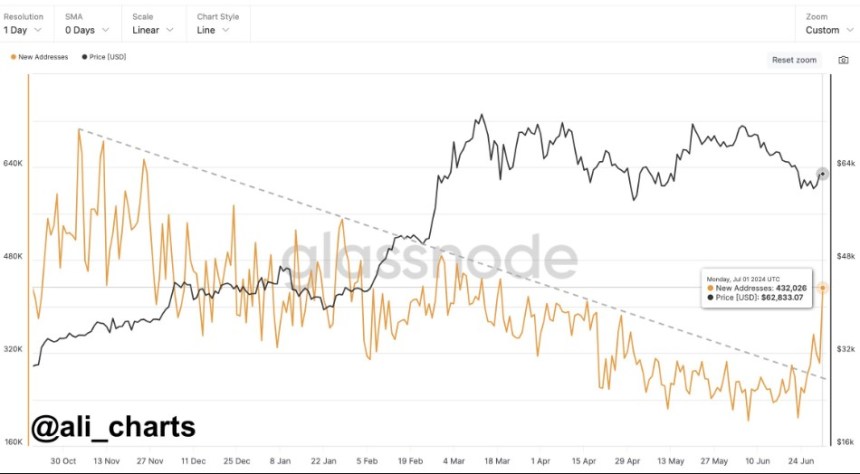
In a recent social media post, crypto analyst Ali Martinez highlights the resurgence of retail investors, as evidenced by a four-month high in new BTC addresses reaching 432,026, adding to the sentiment that investors are betting on a significant price increase for BTC in the coming months, despite recent price volatility. 

Bitcoin

In a separate post analyzing BTC’s recent price action, Martinez also suggested that the largest cryptocurrency on the market is currently confined within a parallel channel, with a potential rebound to $63,200 or $63,800 if the lower bound at $62,500 holds. 

In particular, Martinez cites the critical resistance areas of $65,795 and $78,700 as key targets if BTC breaks above them.

However, not all news is positive for the Bitcoin market. In the past 72 hours, BTC miners have sold over 2,300 BTC worth approximately $145 million. This selling pressure adds to the US and German governments’ ongoing sell-off of confiscated BTC.

Mining Industry Under Pressure 

The mining industry faces challenges due to lower network fees and reduced block rewards resulting from the Halving event in April. 

Kaiko Research notes that average network fees have decreased from $3 to $5, a significant drop from around $45 in January. The halving saw block rewards reduce from 6.25 BTC to 3.125 BTC, impacting miner revenue.

This revenue squeeze has put pressure on miners, eroding profitability while fixed expenses such as energy, wages, and rent remain constant. The decline in network fees has further contributed to the reduction in revenue. 

Historically, Bitcoin price rallies following Halving events have helped miners compensate for the drop in rewards. However, the price of Bitcoin has remained relatively unchanged since the April 19 software update.

In April, fees briefly surged to nearly $150 due to the increased minting of non-fungible tokens (NFTs) on the BTC blockchain. Although this temporarily relieved miners, fees have since returned to average levels. 

According to Bloomberg, Marathon Digital, one of the largest Bitcoin miners, sold 390 BTC in May and plans to sell more tokens to manage its finances.

Kaiko Research warns that the risk of forced selling by miners may persist in the coming months. As a result, the industry is expected to witness consolidation as miners seek to “consolidate assets” and “increase efficiency.” 

Notable examples include miner Riot Blockchain’s “hostile takeover attempt” of Bitfarms Ltd. and CleanSpark Inc.’s recent agreement to acquire Griid Infrastructure Inc. for $155 million in an all-stock transaction.

Bitcoin

At the time of writing, BTC is still consolidating within its range at $61,880, down 2% in the 24-hour time frame, wiping out all gains in the past 30 days, as losses in this time frame amount to 9%. 

Featured image from DALL-E, chart from TradingView.com  

Bitcoin Bearish Signal: Miners Continue To Sell

On-chain data shows that Bitcoin miners have continued to sell recently, a sign that can be bearish for the price of the cryptocurrency.

Bitcoin Miner Reserve Has Been Going Down Since Rally Started

As an analyst in a CryptoQuant post pointed out, BTC miners have continued to shave coins off their reserve recently. The “miner reserve” is an indicator that measures the total amount of Bitcoin that all miners are holding in their wallets currently.

Related Reading: Bitcoin Emerges As the King Of Assets,10X Growth Over Gold During US Banking Crisis

When the value of this metric goes up, it means the miners are depositing a net number of coins into their wallets. This trend suggests these blockchain validators are accumulating the cryptocurrency. As miners are often a source of selling pressure in the market, their holding on and adding to their supply can be bullish for the price.

On the other hand, a decreasing value in this indicator implies that miners are transferring some BTC out of their reserve. Since one of the main reasons why these investors may withdraw from their wallets is for selling-related purposes, such a trend can have bearish consequences for the asset’s value.

Now, here is a chart that shows the trend in the Bitcoin miner reserve over the past year:

Bitcoin Miner Reserve

The above graph shows that the Bitcoin miner reserve saw a sharp plunge just as the rally began in January, suggesting that these investors sold to take advantage of the profit-taking opportunity. The drawdown in the metric was also quite sharp in this case and surpassed the levels seen during the FTX crash last November.

The miner reserve has only moved sideways or down since this selloff, suggesting that these holders haven’t participated in any accumulation in recent months; they have only been looking at chances to exit.

Recently, when Bitcoin plunged from the $30,000 mark, the indicator again saw a sharp leg down, meaning that this cohort was again selling their BTC.

The drawdown in the indicator has also continued through the volatile price action observed in the last few days, suggesting that the BTC miners are still disposing of their coins.

Though these investors may have been selling a net amount of coins recently, the actual scale of their selling isn’t that significant compared to their total reserve (they currently hold upwards of 1.82 million BTC in their wallets).

The quant notes, however, that the miners holding onto their coins for longer periods could be one of the crucial factors for the bullish trend’s health.

It now remains to be seen whether these holders can reverse the trend anytime soon or if they will continue to sell Bitcoin in the short term. Either possibility is likely to have a profound effect on the BTC price.

BTC Price

At the time of writing, Bitcoin is trading around $28,100, up 3% in the last week.

Bitcoin Price Chart

What’s Behind The Recent Bitcoin Drop? Here’s What On-Chain Data Says

Bitcoin on-chain data hints that selling from the miners may have been behind the latest plunge in the asset’s price below the $28,000 mark.

Bitcoin Miners Have Shown Signs Of Selling Recently

As pointed out by an analyst in a CryptoQuant post, miners had been putting on some selling pressure on Bitcoin while the decline had happened. A relevant indicator here is the “miner netflow,” which measures the net amount of Bitcoin entering into or exiting the wallets of all miners.

When this metric has a positive value, it means a net number of coins is being transferred into the wallets of miners right now. Such a trend implies that these chain validators are accumulating currently, which is naturally something that could be bullish for the price.

On the other hand, negative values suggest miners are transferring some BTC out of their holdings at the moment. Usually, miners transfer out their coins whenever they want to sell them. Hence, negative netflow values can have bearish consequences for the asset.

Now, here is a chart that shows the trend in the 30-day simple moving average (SMA) Bitcoin miner netflow over the past week or so:

Bitcoin Miner Netflow

As displayed in the above graph, the 30-day SMA Bitcoin miner netflow registered a very sharp red spike when the cryptocurrency’s price was in the middle of its decline a few days ago.

BTC was just above $28,000 when this spike came, but the asset rapidly plummeted to the low $27,000 level following it. The timing of these large net outflows taking place from the miners may be a sign that it was this cohort’s selling that at least partially contributed to the coin’s drawdown.

The chart for the 30-day exponential moving average (EMA) Bitcoin miner reserve, a metric that measures the total amount of BTC all miners are holding right now, also shows this spike:

Bitcoin Miner Reserve

This plummet in the Bitcoin miner reserve from a few days ago naturally makes sense, as the netflow is nothing but a measure of the changes taking place in this metric. From the chart, it’s visible that while the outflows may have been sizeable, they still haven’t significantly affected this cohort’s total holdings, meaning that many miners are still sitting still on their wallets.

Nonetheless, compared to the average during the last 365 days, the current outflows are very large, as the data for the 14-day EMA Miners’ Position Index (MPI) below displays.

Bitcoin MPI

It looks like the rate at which Bitcoin miners are selling right now (proportional to the past year) is greater than what even the FTX crash back in November 2022 saw.

All these indicators suggest that this extraordinary selling pressure from these holders could be why BTC plunged to low $27,000 levels a couple of days ago, something that the coin is yet to recover.

BTC Price

At the time of writing, Bitcoin is trading around $27,300, down 8% in the last week.

Bitcoin Price Chart

Bitcoin Drops To $20,700 As Miner Outflows Surge

On-chain data shows the Bitcoin miner outflows have surged, suggesting that selling from this cohort may be behind the crypto’s decline to $20,700.

Bitcoin Miner Outflows Have Registered Multiple Spikes Recently

As pointed out by an analyst in a CryptoQuant post, on Wednesday, miners deposited 669 BTC to exchanges. A relevant indicator here is the “miner reserve,” which measures the total amount of Bitcoin that miners as a whole are currently holding in their wallets.

The “miner outflow” is a metric that tells us the total number of coins that these blockchain validators are transferring out of the miner reserve right now. Naturally, the reserve’s value goes down whenever the outflow records a spike, given that an equal or higher amount of the crypto doesn’t flow inside at the same time.

Generally, miners take BTC out of their reserve for selling purposes. Thus, whenever the outflow registers high values (or alternatively, the reserve observes a steep decline), it means this cohort might be participating in large amounts of selling at the moment.

Now, here is a chart that shows the trend in the Bitcoin miner outflow and miner reserve over the past couple of months:

quicktake-image

As displayed in the above graph, the Bitcoin miner outflow saw two very large spikes in the last few days. The spike on January 14 measured around 4,089 BTC, while the one on January 17 amounted to 2,500 BTC.

At the same time as these outflows, their reserves also plunged, which means that there wasn’t much incoming volume to compensate for these outflows. On Wednesday, there was also a third spike, but it was significantly smaller in scale than the other two.

However, there was still something about this outflow that’s worth paying attention to. About 669 BTC from this outflow was headed toward centralized exchanges. This can be seen in the data for the “miner to exchange flow” metric, which is also shown in the chart.

Usually, exchanges are what investors use for quickly swapping their Bitcoin in favor of altcoins or stablecoins, or for simply withdrawing to fiat. While miner outflows alone can be a sign that there is some selling going on (as these holders may just use over-the-counter (OTC) deals instead of exchanges), deposits straight to exchanges do provide more evidence that selling could be the intent behind the outflows.

While a part of the third outflow was headed toward the exchanges, the first two, larger spikes didn’t seem to have coincided with any significant deposits toward these platforms.

Nonetheless, the fact remains that following the first two outflows, the Bitcoin rally slowed down to a crawl, and after the third one (that went towards exchanges), BTC outright declined and hit $20,700. This could suggest that selling from miners may have played some part in these developments in the asset’s price.

BTC Price

At the time of writing, Bitcoin is trading around $20,700, up 14% in the last week.

Bitcoin Price Chart