Bitcoin Extreme Greed Is Nearly Here: Will This Lead To A Top?

Data shows the Bitcoin market sentiment has nearly turned to extreme greed as the cryptocurrency’s price has rallied to the $68,000 mark.

Bitcoin Fear & Greed Index Is Currently Inside The Greed Region

The “Fear & Greed Index” is an indicator created by Alternative that tells us about the average sentiment present among traders in the Bitcoin and wider cryptocurrency markets. This index makes use of the data of the following five factors in order to determine the sentiment: trading volume, volatility, social media sentiment, market cap dominance, and Google Trends. Once found, it represents the market mentality as a score between 0 and 100.

When the metric has a value greater than 53, it means the traders as a whole share a sentiment of greed right now. On the other hand, it being under the 47 mark implies the dominance of fear in the market. The territory in-between these two corresponds to a net neutral mentality.

Besides these three main sentiment zones, there are also two special regions called the extreme fear and the extreme greed. The former of these occurs at 25 and under, while the latter at 75 and above.

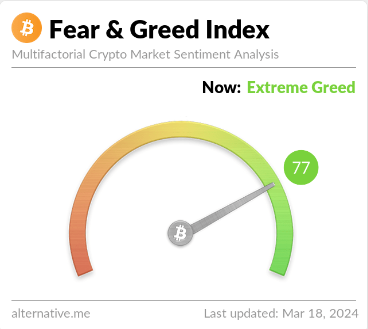
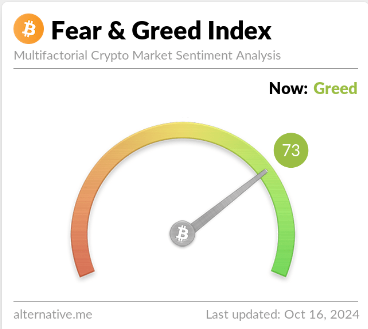
Now, here is what the latest value of the Bitcoin Fear & Greed Index has been like:
Bitcoin Greed

As is visible above, the indicator has a value of 73, which suggests that the investors are currently showing a significant amount of greed. This is a notable change from how the mood in the market was last week, as the index had declined into the fear zone then.

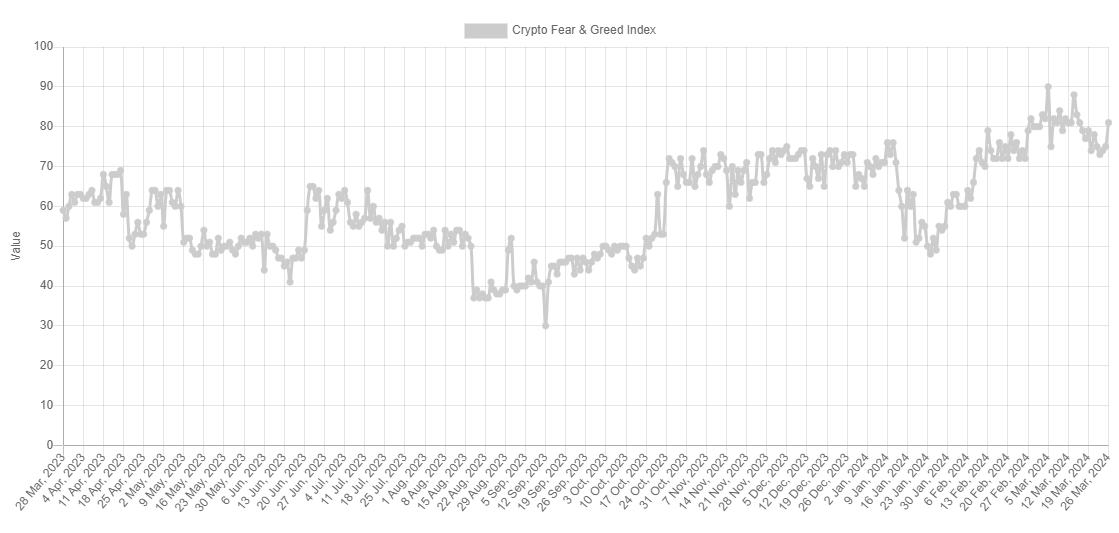
The below chart shows how the value of the Bitcoin Fear & Greed Index has changed over the past year:

Bitcoin Fear & Greed Index

From the graph, it’s visible that this latest uplift in the sentiment, which has come as a result of the asset’s rally to $68,000, has taken the index to the highest value since the end of July. Back then, the high sentiment values had led to a top for the cryptocurrency. This type of pattern is something that has actually been witnessed throughout history.

It turns out that Bitcoin has a tendency to move in the direction opposite to what the crowd is expecting and the probability of such a contrary move increases the more the traders lean towards one side.

In the extreme regions, this likelihood is the strongest, so tops and bottoms have often formed when the investors have shared these sentiments. The current value of the index is just outside the extreme greed zone, so a top could become likely for the asset should the investor mentality continue to improve.

The sentiment may also not even have to improve further for such a scenario to follow out, as the top back in July had occurred when the index had a value of 74, only one unit greater than the current one.

BTC Price

At the time of writing, Bitcoin is trading at around $68,000, up more than 9% over the last week.
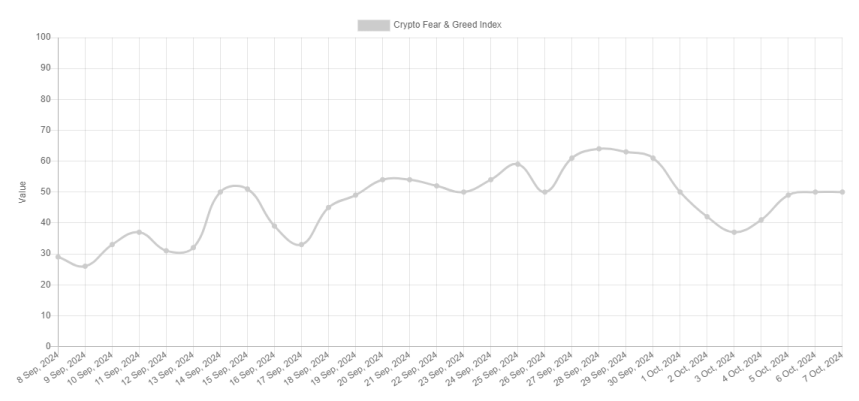
Bitcoin Price Chart

Bitcoin Investors Not Sold On Uptober As Sentiment Remains Neutral

Data shows that the Bitcoin trader sentiment is currently neutral, a sign that investors are indecisive about the direction of the cryptocurrency.

Bitcoin Fear & Greed Index Is Right In The Balance Right Now

The “Fear & Greed Index” is an indicator created by Alternative that tells us about the average sentiment among the traders in the Bitcoin and wider cryptocurrency markets.

This index determines the sentiment by accounting for the data of the following five factors: trading volume, volatility, market cap dominance, social media sentiment, and Google Trends. To represent the calculated sentiment, the indicator uses a scale that runs from zero to hundred.

When the metric’s value is greater than 53, it means the investors are sharing a sentiment of greed right now. On the other hand, the indicator being under 47 suggests the dominance of fear in the sector. Naturally, the region in-between these cutoffs corresponds to a neutral mentality.

Now, here is how the latest value of the Bitcoin Fear & Greed Index has been like:

Bitcoin Neutral Sentiment

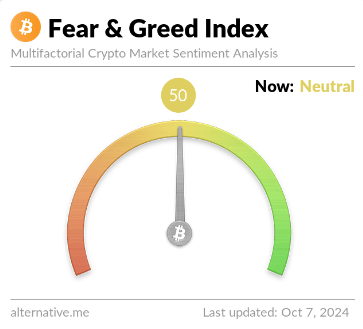
As is visible above, the indicator has a value of 50, which implies that the market sentiment is exactly in the balance at the moment. It’s also not just today that the metric has been in this zone, as it had in fact signaled a neutral market during the weekend as well.

The below chart shows how the index’s value has changed over the past month.

Bitcoin Fear & Greed Index

From the graph, it’s apparent that the Bitcoin Fear & Greed Index had slipped into the fear region during the starting few days of this month, a result of the bearish action that the market as a whole had witnessed.

The traders hadn’t become too fearful in this drop, though, as the indicator had only reached a low of 37. With the price recovery that has followed since then, the sentiment has improved to the current 50 level.

Interestingly, however, despite the month of October being popularly dubbed ‘Uptober,’ a result of BTC historically performing well in this period, the market is yet to embrace greed.

The fact that the investors are still neutral despite a bullish wave seemingly starting with the recovery would suggest the investors are currently hesitant about getting excited over the prospect of a run.

Historically, Bitcoin has tended to move opposite to the expectations of the majority, so a highly bullish sentiment has usually been a bad sign for things to come. In this view, the fact that the investors are currently not displaying hype could actually turn out to be a boon for the coin’s rally.

BTC Price

Bitcoin had broken beyond the $64,000 level earlier in the day, but the asset appears to have seen a pullback since then as it’s back at $63,600.

Bitcoin Price Chart

Bitcoin Hype Bites Back As BTC Crashes Under $64,000

Data shows social media users had become overly excited about Bitcoin after the recent rally, which may be why BTC has retraced.

Bitcoin Topped Out As Hype Around The Coin Shot Up

According to data from the analytics firm Santiment, crowd sentiment around BTC has noted a sharp surge recently. The indicator of relevance here is the “Positive vs. Negative Sentiment Ratio,” which keeps track of the difference between the positive and negative comments related to Bitcoin that are being made on social media platforms.

The indicator separates posts related to negative and positive sentiments by putting them through a machine-learning model devised by the analytics firm.

When the value of this metric is greater than 0, it means the social media users are participating in more positive talks than negative ones. On the other hand, it being under this threshold suggests the dominance of bearish sentiment on these platforms.

Now, here is a chart that shows what the Positive vs. Negative Sentiment Ratio’s recent trajectory has been like:

Bitcoin Sentiment

As displayed in the above graph, the Bitcoin Positive vs. Negative Sentiment Ratio had observed a significant surge during the cryptocurrency’s earlier run toward the $66,000 level.

Yesterday, when Santiment shared the post, social media users made 1.8 bullish posts for every 1 bearish post. Thus, the traders had become quite optimistic after the price surge. This, however, may not have been an ideal development for the coin.

Historically, BTC has tended to move in the direction opposite to what the crowd is expecting, with the probability of a contrary move only rising the more lopsided the sentiment gets.

Today, Bitcoin has retraced back under the $64,000 level, a possible indication that the earlier hype that the social media users had shown has backfired, just like it has done many times.

It’s also not just the social media users that have been excited recently, as the Fear & Greed Index, an indicator created by Alternative that considers more factors than just social media, has also been showing a rising optimism in the sector.

Bitcoin Greed

The Fear & Greed Index currently sits at a value of 61, which suggests that the investors are leaning towards being bullish around Bitcoin and the cryptocurrency sector in general.

The sentiment-related indicators could follow in the coming days, as they may dictate whether BTC can regain its bullish momentum. The crowd calming down would be a sign in the right direction if history is to go by.

BTC Price

After the latest plunge, Bitcoin has returned to the $63,400 level.

Bitcoin Price Chart

Bitcoin Hype Remains Low Even After $63,000 Surge: Green Sign For Rally?

Data shows the social media users have yet to show excessive hype around the latest Bitcoin rally, a sign that could be positive for its sustainability.

Bitcoin Sentiment Ratio Has Spiked, But Value Still Not Too High

According to data from the analytics firm Santiment, Bitcoin Fear Of Missing Out (FOMO) has remained low through the latest rally. The indicator of relevance here is the “Positive Sentiment vs. Negative Sentiment Ratio,” which, as its name suggests, measures the ratio between the positive and negative comments around BTC being made on the major social media platforms.

To separate the posts/threads/messages on these platforms between positive and negative, Santiment’s indicator uses a machine-learning model.

When the value of this metric is greater than 1, it means the social media users are making more posts expressing a positive sentiment than a negative one. On the other hand, it being under 1 suggests bearish messages are the norm on these platforms.

Now, here is a chart that shows the trend in the Bitcoin Positive Sentiment vs. Negative Sentiment Ratio over the last few months:

Bitcoin Sentiment

As the above graph shows, this Bitcoin indicator has observed an uplift alongside the latest recovery run in the cryptocurrency’s price. This rally has come as the US Federal Reserve has announced an interest rate cut.

The indicator is currently decently above the neutral mark, meaning that positive posts notably outweigh the negative ones. Historically, the asset has tended to move in a direction opposite to what the crowd is expecting, with the probability of the contrary move going up the stronger this expectation becomes.

A very bullish market can be a warning sign for the BTC price. Despite the recent surge in sentiment, FOMO is not yet at a level where it would be a problem.

The chart shows that the previous spikes in the indicator that occurred around the tops for Bitcoin were of a significantly large scale. The last few months have also seen the indicator generally maintain a positive level, so the metric’s current value isn’t even that out of place when compared to the norm.

“Markets can roll until we see a bullish sentiment spike similar to what we saw during the April 19th and May 21st tops,” notes the analytics firm. If FOMO does end up spiking to high levels in the coming days, BTC could encounter another top.

When that happens, another foray into the negative sentiment zone could be to wait since, as highlighted in the graph, the last two such instances proved to be profitable buying points into Bitcoin.

BTC Price

Bitcoin has enjoyed a surge of almost 6% over the past week, bringing its price back to the $63,200 mark.

Bitcoin Price Chart

Bitcoin Investors Succumb To Fear As BTC Erases $60,000 Weekend Recovery

Data shows that the sentiment of the Bitcoin market has switched to fear after the retrace. BTC has seen a $58,000 level during the past day.

Bitcoin Fear & Greed Index Is Pointing At ‘Fear’ Now

The “Fear & Greed Index” is an indicator created by Alternative that tells us about the general sentiment among the investors in the Bitcoin and the wider cryptocurrency market.

Market sentiment can be helpful to follow as it can reflect the cryptocurrency’s price. It sometimes plays a role in the asset’s trajectory, which may be unexpected to many investors.

The Fear & Greed Index uses data from the following five factors to estimate the average sentiment among investors: volatility, trading volume momentum, social media sentiment, market cap dominance, and Google Trends.

Based on these factors, the metric represents this mentality as a score between zero and hundred. The index having a value greater than 53 implies the presence of greed among the investors, while under 47 suggests fear in the market. The values in between these two cutoffs suggest a net-neutral mentality.

Now, here is what the latest Bitcoin market sentiment has looked like from the perspective of the indicator:

Bitcoin Fear

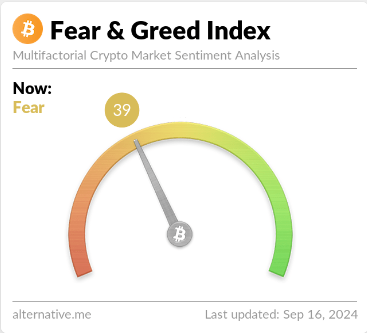
As is visible above, the Bitcoin Fear & Greed Index has a value of 39, which suggests that the majority of the investors in the market are slightly fearful at the moment.

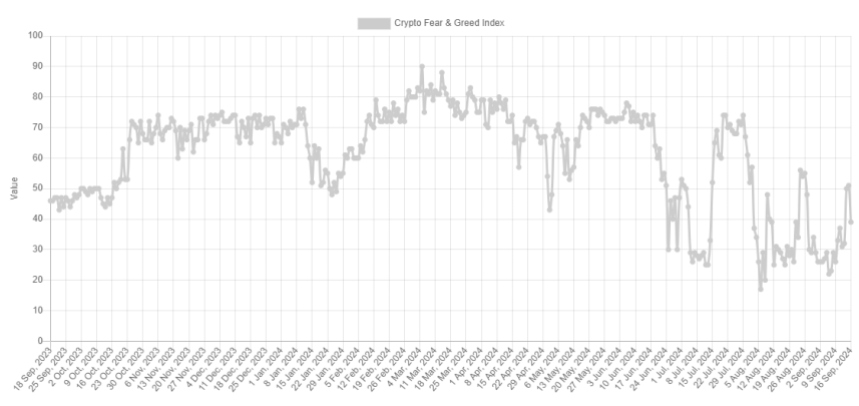
This is a notable change from yesterday, when the index had a value of 51, and the holders had been sharing a neutral mentality. The chart below shows a record of all the changes in the index over the past year.

Bitcoin Fear & Greed Index

As displayed in the graph, the Bitcoin Fear & Greed Index saw a sharp improvement over the weekend, caused by the recovery that the asset price had enjoyed beyond the $60,000 mark.

However, the cryptocurrency has kicked off the new week with a plunge back towards $58,000, which may be why the sentiment has also seen a reset to the fear region.

That said, while the index is back in the fear zone, it’s not yet at the 31 value it was at before the earlier recovery. This fact, however, may not be a good sign for the asset.

Historically, Bitcoin has tended to move against the expectations of the majority. The probability of a contrary move occurring has only increased the more the investors have become sure of a direction.

Thus, when the Fear & Greed Index assumes low values (signifying a special sentiment called the extreme fear), bottoms can be probable to occur. Similarly, it being high (extreme greed) can signal tops.

With the Bitcoin market being only slightly fearful right now, it seems the pullback in the cryptocurrency hasn’t been enough to deal a heavy blow to investor morale. Naturally,  a pullback can still occur for the coin, but it may be less likely if sentiment worsens further.

BTC Price

Bitcoin has dropped more than 3% over the past day, which has taken its price to $58,100.

Bitcoin Price Chart

Bitcoin Sentiment Spikes After Mild Price Jump: Crowd Too Excited Too Quickly?

Data shows that the positive sentiment around Bitcoin has spiked on social media after BTC’s return above $58,000, implying investors may feel FOMO.

Bitcoin Positive Vs. Negative Sentiment Ratio Has Spiked Recently

According to data from the analytics firm Santiment, the crowd has recently shown a sudden burst of optimism around Bitcoin. The indicator of relevance here is the “Positive Sentiment vs. Negative Sentiment Ratio,” which, as its name suggests, keeps track of the ratio between the positive and negative comments on social media related to a given coin.

The analytics firm sources posts/threads/messages from platforms like Twitter, Reddit, Telegram, and 4Chan. To determine whether these posts are negative or positive, Santiment puts them through a machine-learning model.

When the indicator has a value greater than 1, the comments related to positive sentiment outweigh the negative ones. On the other hand, being under the threshold suggests that most social media users share a negative sentiment.

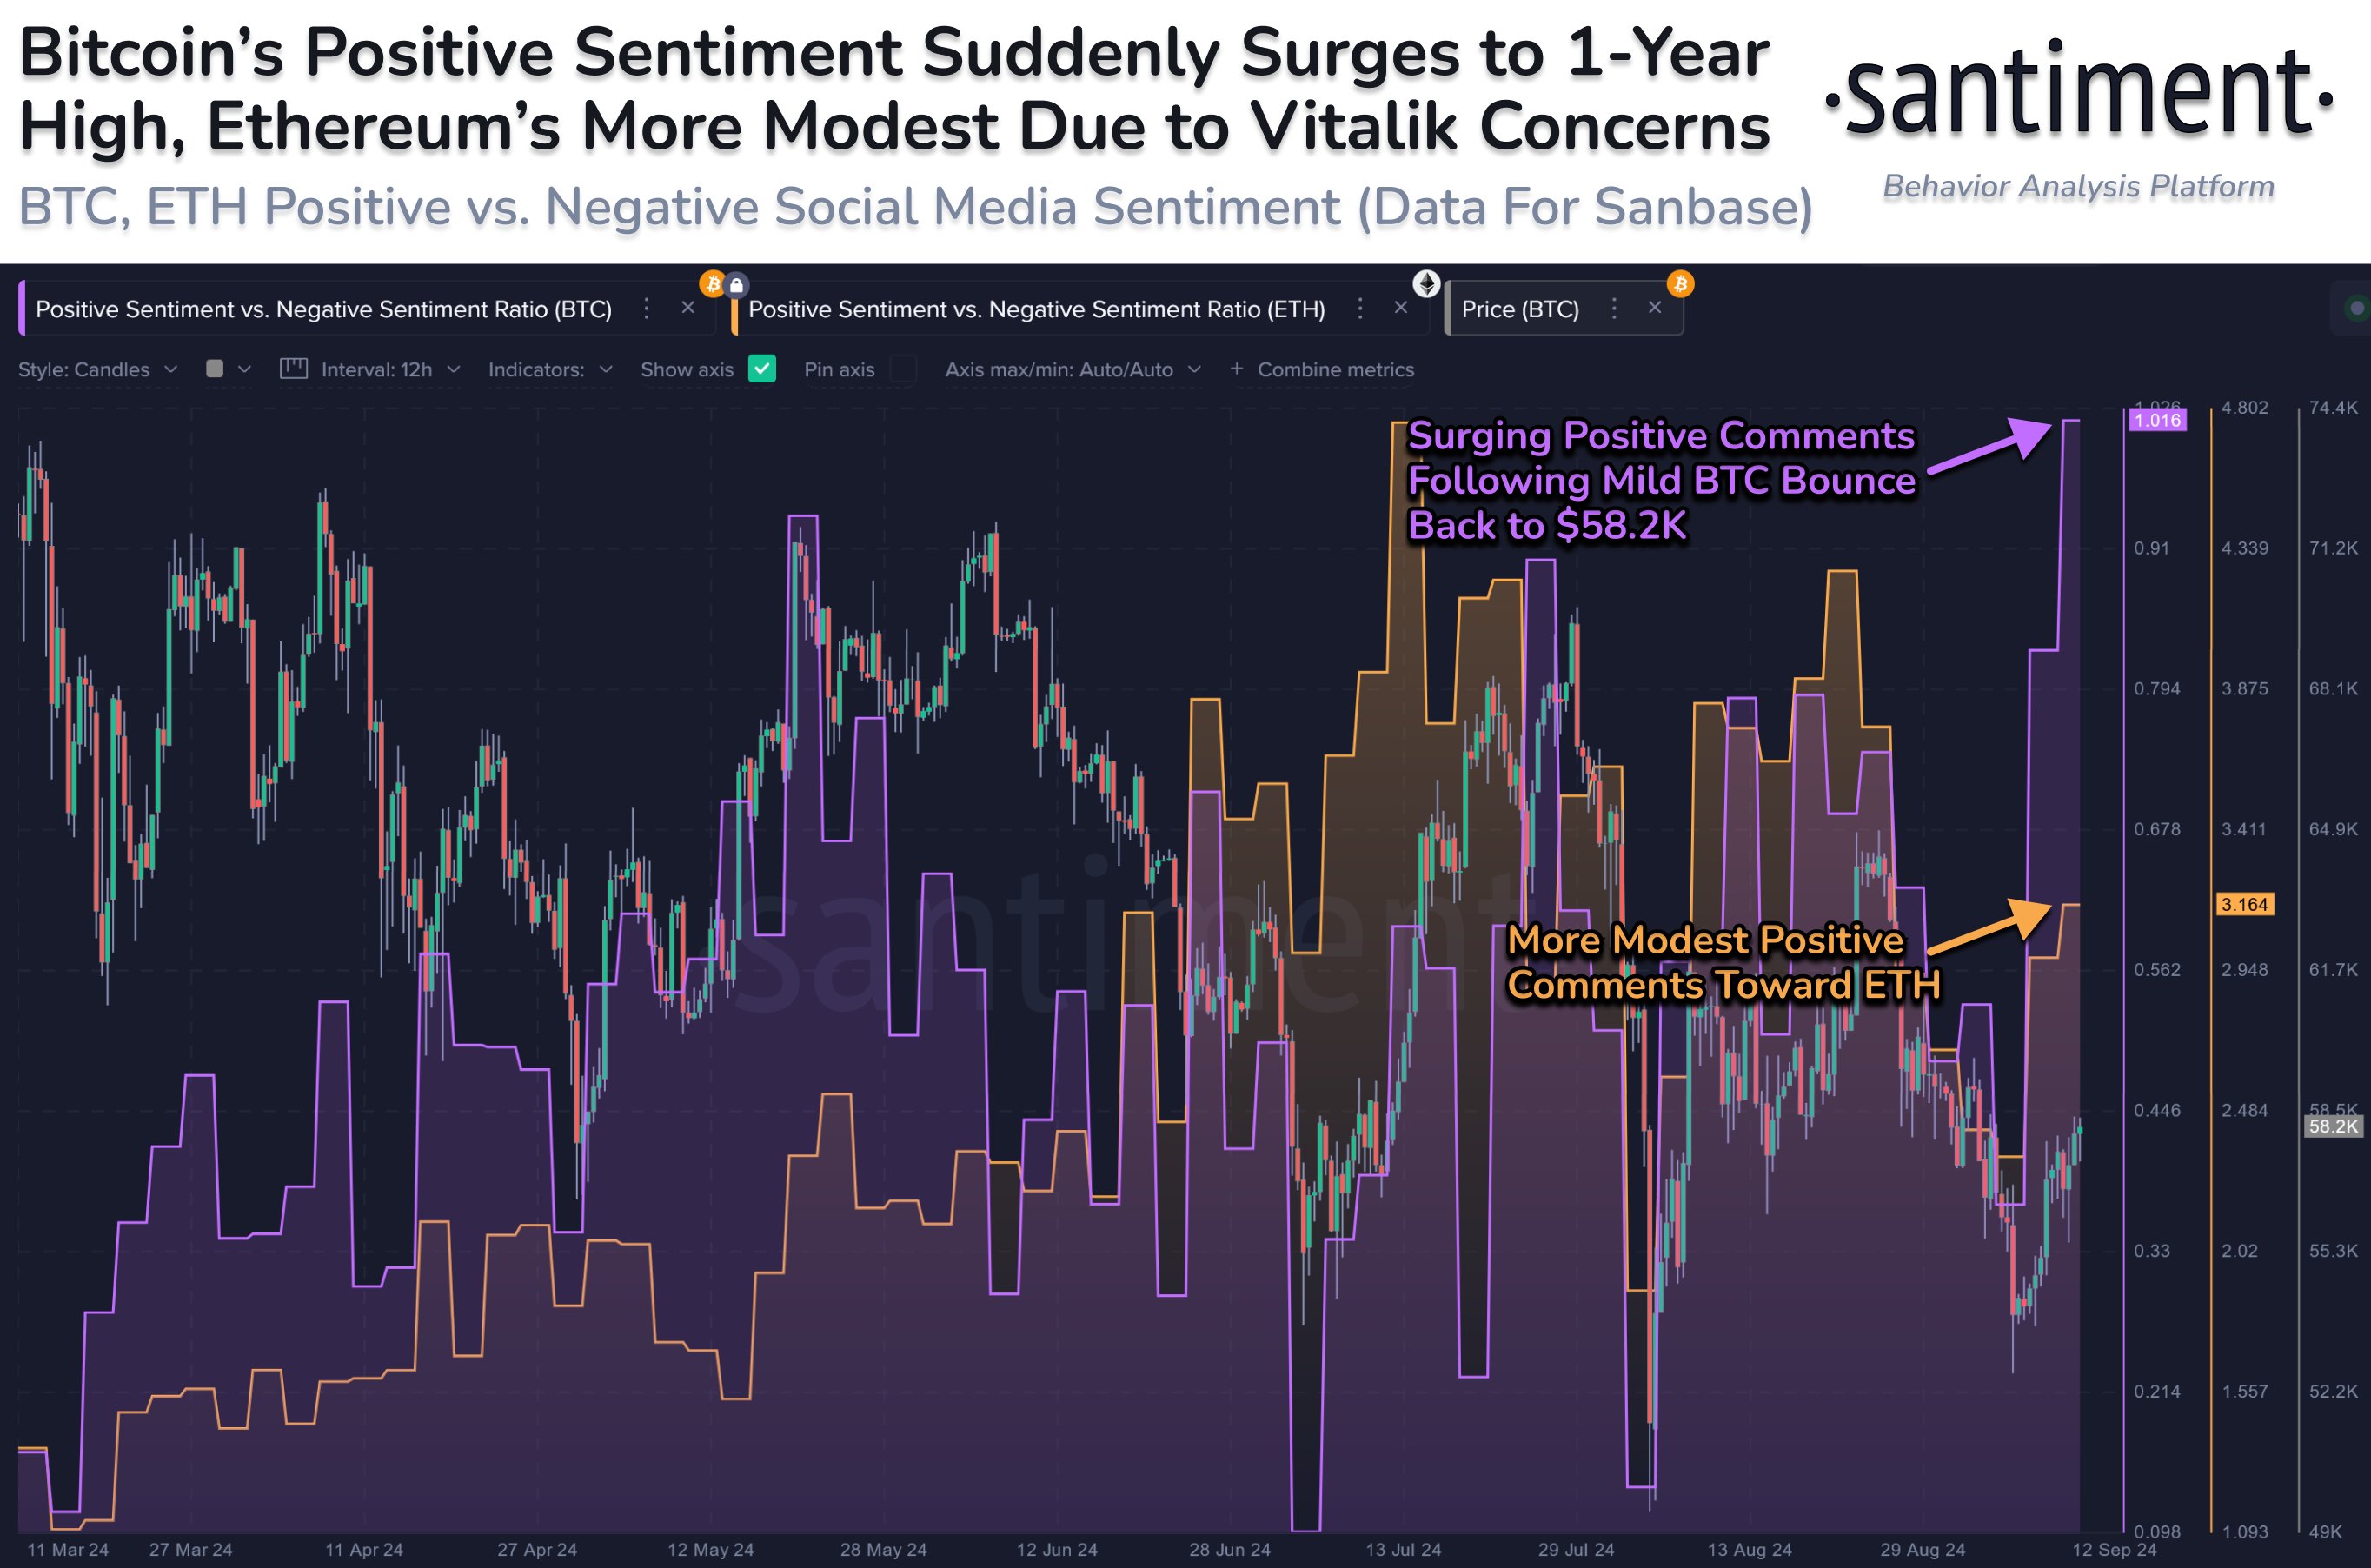
Now, here is a chart that shows the trend in the Positive Sentiment vs. Negative Sentiment Ratio for the top two coins in the sector, Bitcoin and Ethereum, over the past few months:

Bitcoin Vs Ethereum Sentiment

As displayed in the above graph, a huge spike in positive sentiment vs. negative sentiment was observed for Bitcoin after the latest cryptocurrency recovery.

The peak of this spike has corresponded to twice as many positive posts as negative ones cropping up on the major social media platforms. This is the first time the indicator has reached such a high level.

While this indicates that the investors feel bullish about the asset, the optimism scale could be concerning. This is because BTC has historically tended to go against the expectations of the majority, with the probability of a contrary move rising, the more sure the crowd has become of a direction.

Since the positive sentiment has exploded after only a mild jump in the price, FOMO may be taking over the market a bit too soon. This could lead to a potential top for Bitcoin. As for when BTC’s fates might turn bullish again, the analytics firm says:

Look for traders to “slow their roll” and start to express FUD again. When the crowd begins conveying doubt again, BTC will truly begin testing its March all-time high market values.

Interestingly, whereas FOMO around Bitcoin is taking over social media, the users are still only showing a modest amount of optimism towards Ethereum. This could naturally play into the favor of ETH’s price.

BTC Price

Bitcoin has been encountering trouble pulling off a sustained move above $58,000, with the coin seeing another rejection today to $57,800.

Bitcoin Price Chart

Bitcoin Investors Again Show Extreme Fear As BTC Slips To $59,000

Data shows the Bitcoin market sentiment has taken to extreme fear again as the asset’s price has seen a retrace to the $59,000 mark.

Bitcoin Fear & Greed Index Suggests Market Now Extremely Fearful

The “Fear & Greed Index” is an indicator created by Alternative that tells us about the average sentiment that’s currently present in the Bitcoin and wider cryptocurrency markets.

The index uses the following five factors to determine the sentiment: volatility, trading volume, social media sentiment, market cap dominance, and Google Trends. It then represents this estimation using a scale that runs from 0-100

All values of the indicator beyond the 53 mark imply that investors are showing greed, while those below 47 suggest the presence of fear in the market. The region between these two cutoffs naturally corresponds to a neutral mentality.

Besides these three territories, there are also two special sentiments called the extreme fear and the extreme greed. The former of these occurs at 25 and below, while the latter at 75 and above.

Now, here is what the latest value of the Bitcoin Fear & Greed Index looks like:

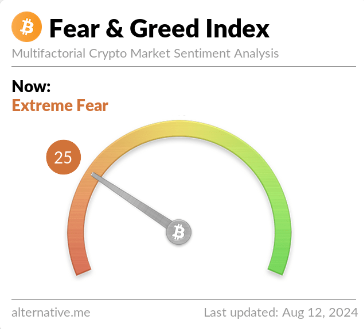
Bitcoin Extreme Fear

As is visible above, the indicator has a value of 25 at the moment, meaning that the market is just inside the extreme fear zone. This is a pretty significant change from how the metric was just yesterday.

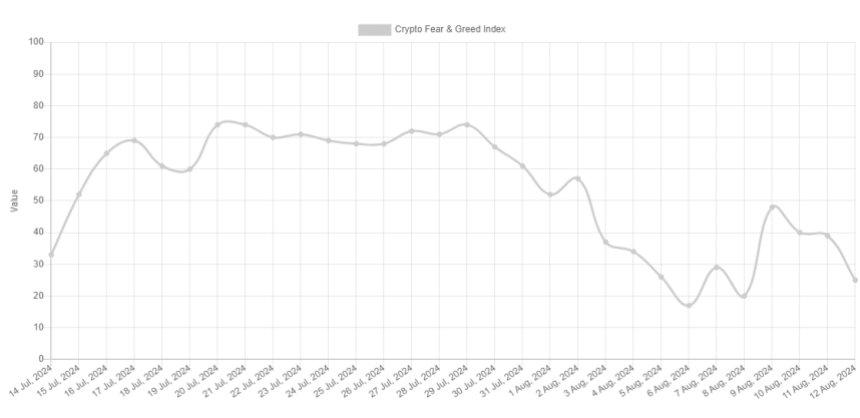
The below chart shows the trend in the Bitcoin Fear & Greed Index over the past month.

Bitcoin Fear & Greed Index

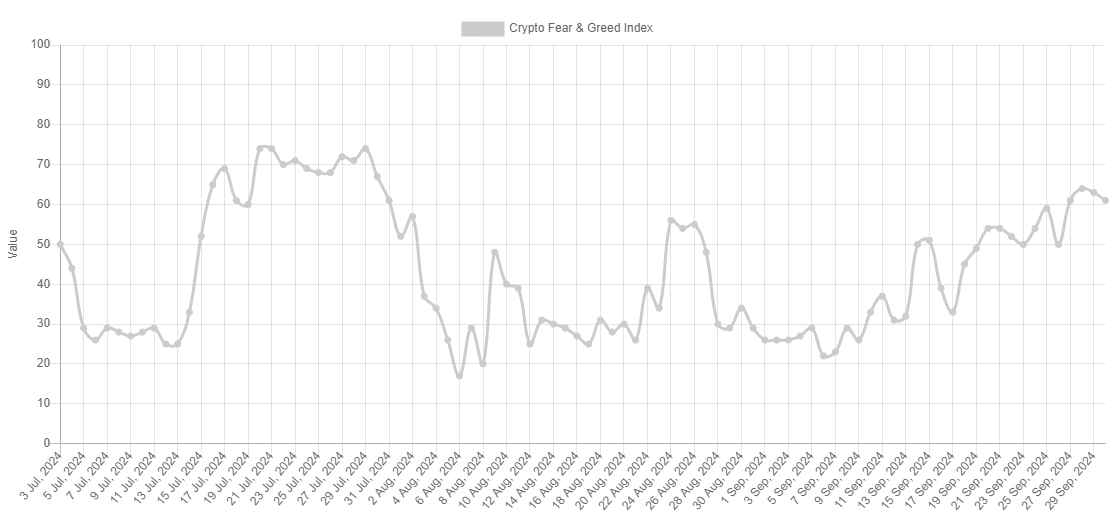
From the graph, it’s apparent that the Fear & Greed Index had been at a high level near the end of July, but during the bearish momentum that had followed in the BTC price, the metric’s value had also gone through a notable drop.

On the 29th, the index was at a value of 74, meaning it was right on the edge of extreme greed, but by the 6th of this month, it had gone into the extreme fear zone with a value of 17.

The asset’s recent recovery did lead to an improvement to the sentiment, with the index traveling back up to 48. It would appear, though, that this growth couldn’t last, as the sentiment has again declined into extreme fear, as the BTC price has seen a retrace.

The fact that the sentiment has worsened, however, may not actually be a bad sign for the cryptocurrency. Historically, Bitcoin has tended to move against the expectations of the majority, and the extreme regions are where this expectation is perhaps the strongest.

As such, tops and bottoms have tended to form whenever the market has been inside these zones. With the Fear & Greed Index now back inside extreme fear, It’s possible that a bottom could be likely to take place. It now remains to be seen if the asset’s decline ends with this drop, or if there is more to come.

BTC Price

Bitcoin appears to already be showing signs of a rebound as its price has climbed back up to $59,700 from its low of under $58,000 earlier in the day.

Bitcoin Price Chart

XRP, Bitcoin Sentiment Remains Very Positive: Bad Sign For Price?

Data shows the sentiment around XRP and Bitcoin is quite bullish currently, something that can actually be to the detriment of their prices.

XRP & Bitcoin Among Coins Observing Positive Sentiment Right Now

According to data from the analytics firm Santiment, the top cap cryptocurrencies are mainly observing the investors hold a bullish outlook. The indicator of interest here is the “Weighted Sentiment,” which basically tells us about the net sentiment around an asset that’s currently present on social media platforms.

The “weighted” in its name comes from the fact that it weighs the sentiment present in the market (the Sentiment Balance) against the amount of discussion that’s happening on social media (the Social Volume).

Because of this feature, this indicator’s value only registers a spike when not only is the crowd tending heavily towards one side as determined by Santiment’s machine-learning model, but also a large amount of posts/threads/messages exist on social media expressing such sentiment.

The advantage of this adjustment is that the indicator is better able to portray what the actual situation in the market is like, as it doesn’t go by the opinion of only a few users (as would be the case in periods where traffic is low).

Naturally, positive spikes in the Weighted Sentiment imply investors are bullish right now, while negative ones imply a bearish market. Values around zero suggest either there aren’t enough discussions happening on social media or the users as a whole are simply neutral.

Now, here is a chart that shows the trend in this indicator for the five top assets in the sector, Bitcoin (BTC), Ethereum (ETH), BNB (BNB), XRP (XRP), and Solana (SOL), over the past few months:

Bitcoin & XRP Weighted Sentiment

As displayed in the above graph, Bitcoin, XRP, Solana, and Ethereum, all have seen the Weighted Sentiment spike into positive territory recently, and these levels have so far persisted into the latest market downturn.

This would imply that social media users hold a bullish sentiment around these coins right now. Bitcoin and XRP particularly stand out in terms of this, as the indicator for them is at the highest levels in 17 months and 14 months, respectively.

BNB is the only cryptocurrency out of these that has the Weighted Sentiment in the negative territory, although the investors currently only hold a slightly fearful sentiment. This negative sentiment may actually play into the favor of BNB, however, as markets have historically been more probable to move in the opposite direction to what the crowd is expecting. Naturally, this means that the highly positive sentiment around Bitcoin and XRP could be bearish for their prices instead.

XRP Price

XRP has extended its drawdown during the past 24 hours with a drop of 6%, which has taken its price to $0.57.

XRP Price Chart

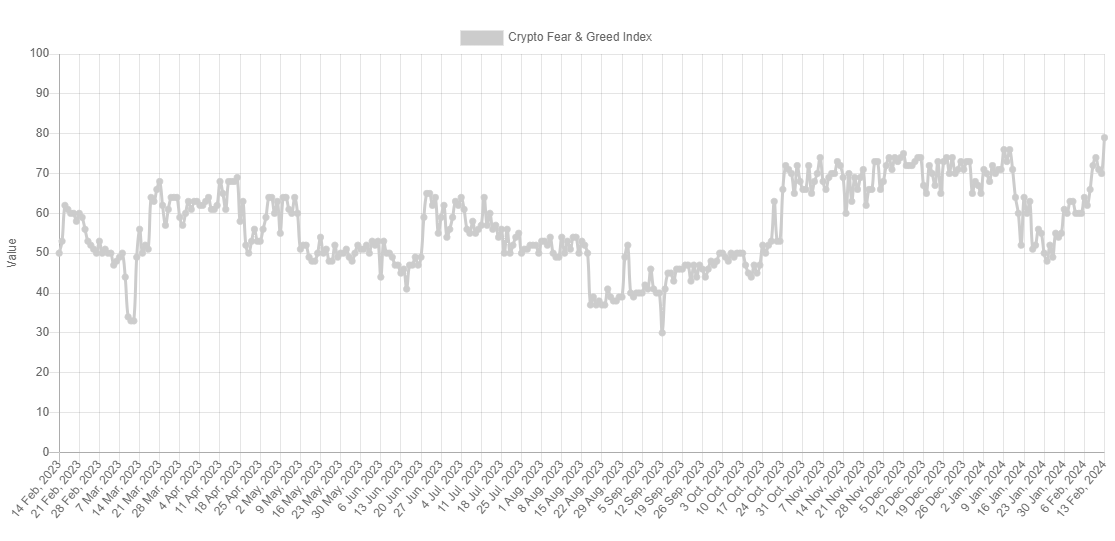
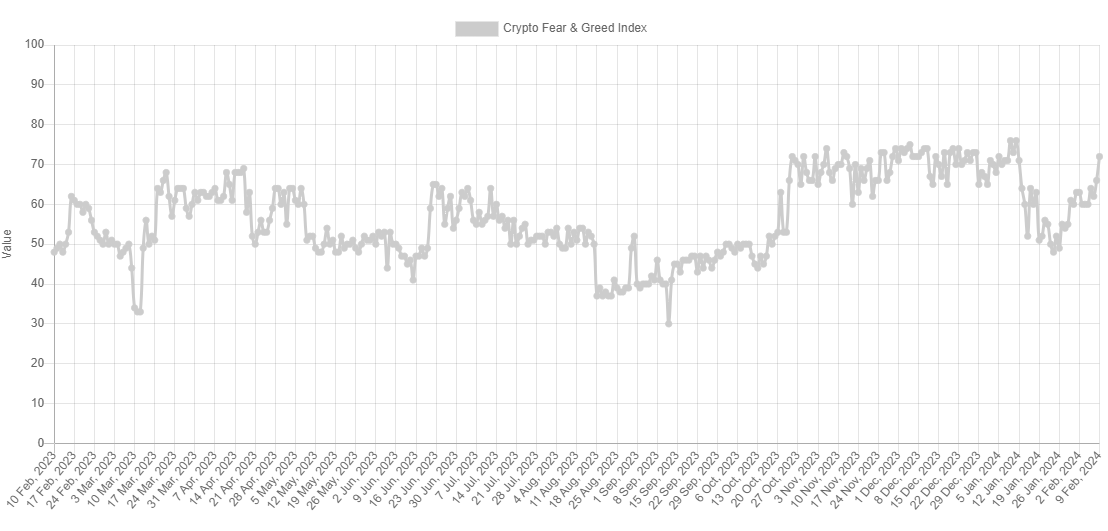
Bitcoin ‘Extreme Greed’ Is Almost Here: Price Bottom Now Close?

Data shows the Bitcoin sentiment is close to entering into the extreme greed zone. Here’s what this could mean for the cryptocurrency’s price.

Bitcoin Fear & Greed Index Has Continued To Decline Recently

The “Fear & Greed Index” is an indicator developed by Alternative that tells us about the average sentiment that traders in the Bitcoin and wider cryptocurrency market currently share.

The index uses five factors to determine this sentiment: volatility, trading volume, social media, market cap dominance, and Google Trends. The metric uses a numeric scale that runs from zero to hundred for representing the mentality.

All values of the indicator above the 53 mark suggest the presence of greed among the investors, while those below 47 imply the dominance of fear. The region in between these two thresholds correlates to a neutral sentiment.

Now, here is what the Bitcoin Fear & Greed Index is looking like right now:

Bitcoin Fear & Greed Index

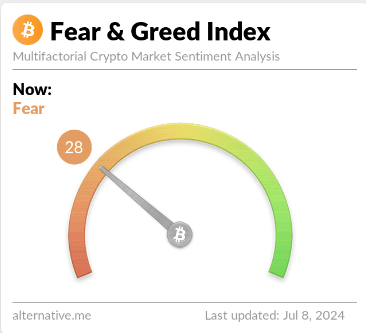
As is visible above, Bitcoin Fear & Greed currently has a value of 28, meaning that the average investor is showing fear. The degree of fearfulness must also be quite notable, as this current value is pretty deep into the territory.

In fact, the latest level of the indicator is quite close to a special region called the “extreme fear.” Investors display extreme fear when the index goes under 25. There is also a similar zone for the greed side as well, which is known as “extreme greed” and occurs above 75.

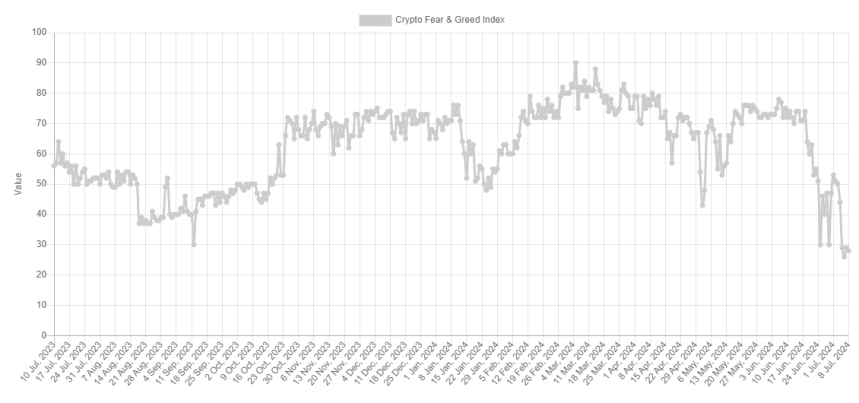
During the first half of last month, the metric had been in or close to the latter region, but the recent downturn in the market has sharply degraded the sentiment to the other end of the spectrum.

Bitcoin Fear & Greed Index

Historically, Bitcoin and other cryptocurrencies have tended to show moves opposite to what the majority are expecting. The stronger the crowd’s expectation gets, the higher the probability of such a contrary move becomes.

The extreme sentiments are where the traders are leaning towards one direction too much. As such, major tops and bottoms in the asset have usually formed when the index has been in these zones.

Because of this fact, some traders prefer to buy when investors are showing extreme fear and sell during extreme greed. This trading philosophy is popularly called “contrarian investing.” Warren Buffet’s famous quote sums up the idea, “be fearful when others are greedy, and greedy when others are fearful.”

As the Bitcoin Fear & Greed index is approaching the extreme fear territory, it’s possible that the cryptocurrency could once again show profitable entry points soon, if the past is anything to go by.

BTC Price

Bitcoin has so far been unable to make too much recovery from its recent crash, as its price is still trading around $56,700.

Bitcoin Price Chart

Bitcoin Traders Sink Into ‘Fear’ As Price Crashes Below $58,000

Data shows that Bitcoin traders’ sentiment has declined into ‘fear’ after the price crash the cryptocurrency has seen during the past 24 hours.

Bitcoin Fear & Greed Index Is Now Suggesting A Fearful Market

The “Fear & Greed Index” is an indicator created by Alternative that tells us about the average sentiment currently held by traders in the Bitcoin and wider cryptocurrency market.

The index uses a scale from zero to a hundred to represent the sentiment. The score is calculated based on five factors: volatility, trading volume, social media sentiment, market cap dominance, and Google Trends.

All values of the indicator above 53 signify the presence of greed among the investors, while those below 47 imply fear in the market. The region between these two cutoffs naturally corresponds to a neutral mentality.

Now, here is what the Bitcoin Fear & Greed Index looks like currently:

Bitcoin Fear

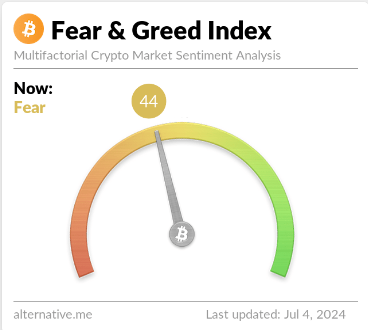
As is visible above, the Bitcoin Fear & Greed Index has a value of 44, suggesting that the sentiment is just inside the fear territory. This is a change from what it has been like during the last few days.

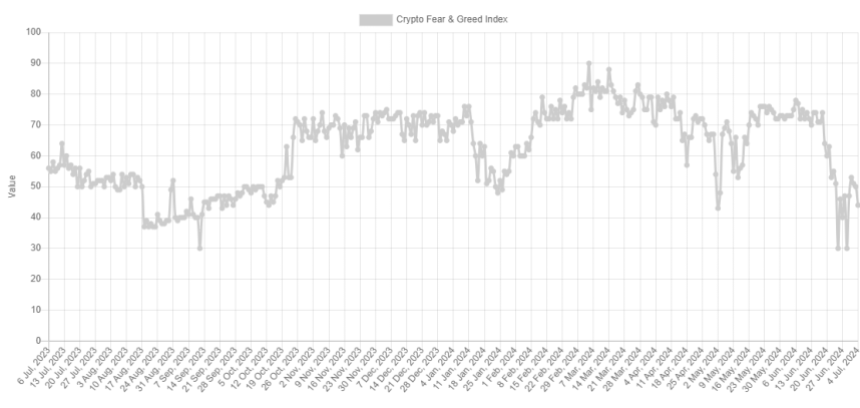
The chart below shows how the indicator’s value fluctuated over the past year.

Bitcoin Fear & Greed Index

The graph shows that the Bitcoin Fear & Greed Index had been in neutral territory during the first three days of this month, but today, on the fourth, the sentiment has plunged.

The reason behind this worsening mentality is the crash that the cryptocurrency’s price has witnessed during the past day, which has taken its price under the $58,000 level.

It’s also visible in the chart that the neutral sentiment in the first three days of July showed a sharp improvement over how June had ended. The metric had hit a low of 30 on two occasions to end the month as a culmination of the bearish momentum BTC had been facing.

As the bearish winds seem to be picking back up for the asset now, the recovery in the sentiment may be lost soon. This may not entirely be, however, bad news for the coin.

The Bitcoin price has historically tended to move against the crowd’s expectations. The chances of such a contrary move to take place grow the larger this expectation becomes. That is the more the Fear & Greed Index points in any direction.

Major tops and bottoms have generally occurred when the asset has been inside the extreme greed and fear regions, respectively. Extreme greed is the territory where the index attains values higher than 75. Similarly, extreme fear occurs under 25.

If the indicator’s value continues to decline from here, it falls into the extreme fear it could be to watch for, as they may also lead towards a potential bottom for Bitcoin this time.

BTC Price

At the time of writing, Bitcoin is trading at around $57,900, down almost 6% in the past seven days.

Bitcoin Price Chart

Bitcoin Investors Beware: Extreme Greed Has Returned In Crypto

Data shows that cryptocurrency investors’ sentiment has surged to extreme greed recently, a sign that may not be ideal for Bitcoin.

Bitcoin Fear & Greed Index Is In The Extreme Greed Territory Right Now

The “Fear & Greed Index” is an indicator created by Alternative that keeps track of the average sentiment present among the traders in the Bitcoin and wider cryptocurrency market.

The index represents this sentiment as a number between zero and 100. To calculate the score, the metric takes into account five factors: volatility, trading volume, social media sentiment, market cap dominance, and Google Trends.

When the Fear & Greed Index has a value greater than 54, the investors are greedy. On the other hand, values under 46 imply that the market is fearful currently. The region between these two cutoffs signifies the territory of a neutral mentality.

In addition to these three core sentiments, the index has two special zones: “extreme greed” and “extreme fear.” The former occurs when the metric surpasses 75, while the latter occurs at levels under 25.

Now, here is what the sentiment in the Bitcoin market looks like right now based on the Fear & Greed Index:

Bitcoin Extreme Greed

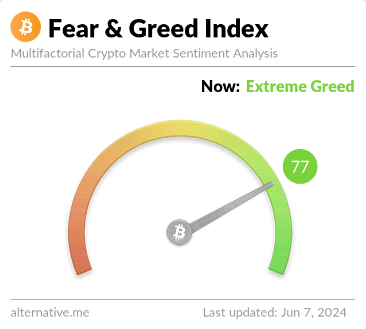
As is visible above, the Bitcoin Fear & Greed Index has a value of 77 at the moment, which suggests that investors as a whole feel extreme greed.

The current value means, however, that the market is only just inside this territory. Earlier, the indicator had a lower value, but the latest price surge beyond the $71,000 level has meant that investors have openly jumped on the bull bandwagon.

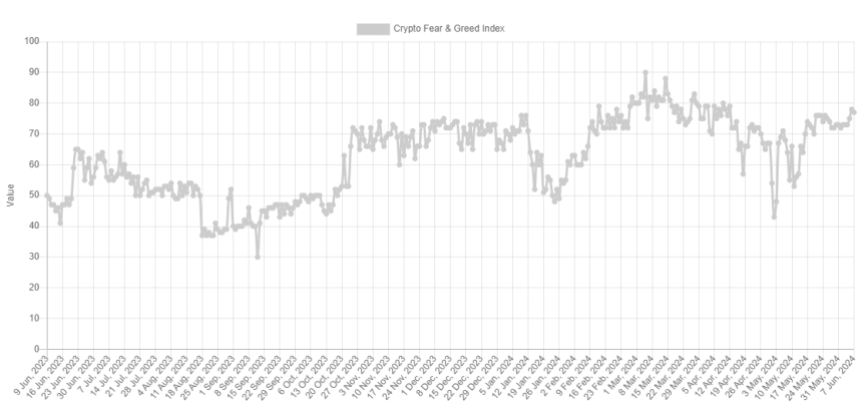
Below is a chart showing how the sector’s sentiment has changed over the past year.

Bitcoin Fear & Greed Index

The graph shows that the latest values of the Fear & Greed Index are the highest that the cryptocurrency has witnessed since the first half of April.

Between then and now, the only other time the indicator stepped inside the extreme greed zone was during a stretch in May. During this phase, 76 was the highest the metric could go, which is right at the region’s boundary.

Historically, the price of Bitcoin has tended to go against the majority’s expectations, and the stronger this expectation has become, the more likely it is that such a contrary move will occur.

Since the extreme sentiment zones are where the market turns the most lopsided, reversals are probable. Naturally, extreme fear is where bottoms happen, while extreme greed can lead to tops.

As such, the latest breach into the extreme greed territory could perhaps be bad news for the recovery rally. It should be noted, though, that the current level of the indicator may still not be too high compared to past bull run levels. For example, the rally to the new all-time high price in March saw the indicator peak at 90.

BTC Price

So far in its recovery run, Bitcoin has risen towards the $71,500 level.

Bitcoin Price Chart

Bitcoin Greed No More: Sentiment Back At Neutral After $57,000 Plunge

Data shows that Bitcoin sentiment has cooled off to neutral from greed following the asset’s latest plunge to the $57,000 level.

Bitcoin Fear & Greed Index Has Returned To Neutral Levels

The “Fear & Greed Index” is an indicator created by Alternative that shows the average sentiment among investors in the Bitcoin and wider cryptocurrency market.

This index estimates sentiment by considering five factors: volatility, trading volume, social media data, market cap dominance, and Google Trends.

The metric uses a scale that runs from zero to 100 to represent this average sentiment. All values under 46 suggest that investors are fearful, while those above 54 imply a greedy market. The zone between these two cutoffs naturally corresponds to the territory of neutral mentality.

Now, here is what the Bitcoin sentiment looks like right now, according to the Fear & Greed Index:

Bitcoin Fear & Greed Index

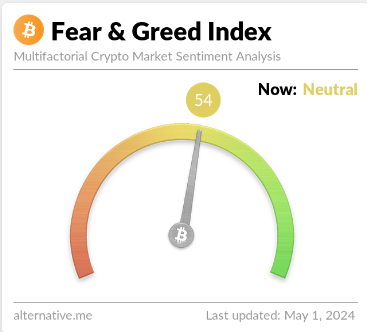
As displayed above, the Bitcoin Fear & Greed Index is at a value of 54, implying that investors share a neutral sentiment currently. However, the neutrality is only just, as the metric is right at the boundary of the greed region.

This is a significant departure from yesterday’s sentiment: 67. The chart below shows how the indicator’s value has changed recently.

Bitcoin Neutral

As the graph shows, the Bitcoin Fear & Greed Index has been declining recently. For most of February and March, as well as the first half of April, the indicator was in or near a special zone called extreme greed.

The market assumes this sentiment at values above 75. As the asset price struggled recently, the mentality cooled off from this extreme zone and entered the normal greed region. With the latest crash in BTC, the index has seen a sharp plunge, now exiting out of greed altogether.

Historically, cryptocurrency has tended to move against the majority’s expectations. The stronger this expectation, the higher the probability of such a contrary move.

This expectation is considered the strongest in extreme sentiment zones, as well as extreme fear and greed. As such, major bottoms and tops have often occurred in these territories.

The all-time high (ATH) price last month, which continues to be the top of the rally so far, also occurred alongside extreme values of the Bitcoin Fear & Greed Index.

With the sentiment now cooled to neutral, some investors may be watching for a fall into fear. This is natural because a rebound would become more probable the worse the sentiment gets now.

BTC Price

During Bitcoin’s latest plunge, its price briefly slipped below $57,000 before surging back to $57,300.

Bitcoin Price Chart

Bitcoin Traders No Longer Extremely Greedy: Rebound Signal?

Data shows that Bitcoin investor sentiment has cooled to the lowest level since February, something that could facilitate a rebound in the price.

Bitcoin Fear & Greed Index Now Points At Just ‘Greed’

The “Fear & Greed Index” is an indicator created by Alternative that tells us about the general sentiment among investors in the Bitcoin and broader cryptocurrency sector.

This metric uses a numeric scale from zero to hundred to represent the sentiment. To calculate the score, the index considers the data of five factors: volatility, trading volume, social media sentiment, market cap dominance, and Google Trends.

All values of the indicator above the 53 mark suggest the presence of greed among the investors, while below the 47 level implies a fearful market. The region between these two corresponds to the neutral sentiment.

Here is how the latest value of the Bitcoin Fear & Greed Index looks:

Bitcoin Fear & Greed Index

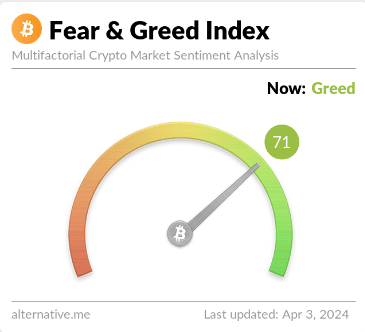
As is visible above, the Bitcoin Fear & Greed Index currently has a value of 71, implying that the investors share a majority sentiment of greed. Just yesterday, the index’s value had been notably higher than this, implying that there has been a bit of a cooldown of sentiment in the past 24 hours.

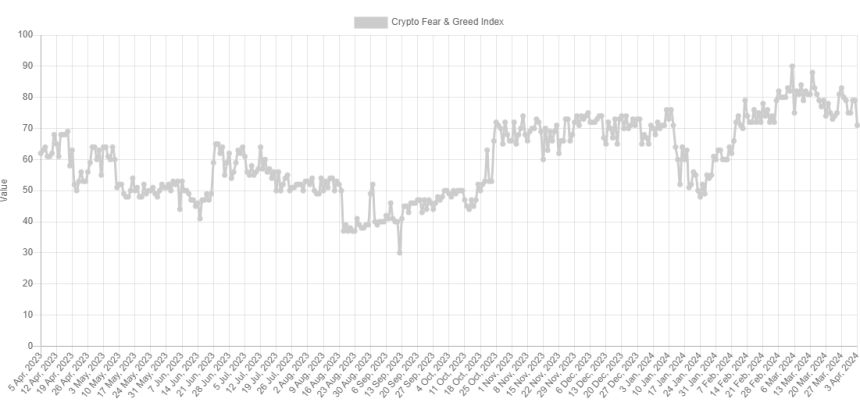
Below is a chart that shows the trend in the index over the past year.

Bitcoin Fear & Greed Index

Besides the three core sentiments, there are also two “extreme” sentiments: extreme greed and extreme fear. The former occurs at values above 75, while the latter occurs under 25.

The Bitcoin Fear & Greed Index was 79 yesterday, implying that the market had been extremely greedy. The indicator has been regularly inside this zone for the past month, so the current normal greed values go against the trend.

The sentiment among investors has naturally been so high recently because the BTC price has gone through a sharp rally in this period and has explored fresh all-time highs (ATHs).

The Bitcoin price has historically tended to go against the majority’s expectations. And the stronger this expectation has been, the more likely such a contrary move will occur.

Due to this reason, the extreme sentiments have been where reversals in the asset have been the most probable to take place in the past. For instance, the current ATH of the asset formed when the index was at a value of 88.

With the recent price drawdown, sentiment has also taken a hit. The fact that it has fallen out of the extreme greed zone, though, may be conducive to a bottom forming. The earlier bottom, around 20 March, also formed when the index exited the zone.

The current level of the Bitcoin Fear & Greed Index is not only lower than it was then but also the lowest since 11 February, when the asset was still trading around $48,000.

BTC Price

Bitcoin is now down to the $65,800 level after facing a drawdown of more than 7% over the last few days.

Bitcoin Price Chart

Bitcoin Traders Spread “Buy The Dip” As Bitcoin Plunges Below $66,000

Data shows “buy the dip” calls for Bitcoin have spiked around social media following the plummet the asset has seen below the $66,000 level.

Bitcoin Social Volume For Terms Related To Buy The Dip Has Shot Up

According to data from the analytics firm Santiment, Bitcoin investors have more heavily reacted with bullish calls than bearish ones despite the sharp decline the asset has observed.

The indicator of relevance here is the “Social Volume,” which tells us about the amount of discussion a given topic or term is receiving on the major social media platforms right now.

This metric works by going through the various posts/threads/messages on these websites to check for mentions of the topic. The indicator, however, doesn’t outright count up these mentions but rather the number of posts that contain at least one mention.

This is naturally due to the fact that a high mention count alone can’t be a reliable indication of whether social media users as a whole are talking about the topic, since talk being limited to just a few threads can also lead to a spike in this count.

In the context of the current discussion, Santiment has filtered the Social Volume for bullish and bearish keywords to find how the two sentiments compare currently.

The below chart shows the trend in the metric for these terms since the start of the year 2024:

Bitcoin Social Volume

For pinpointing bullish sentiment, the analytics firm has made use of terms such as “buy” or “bullish.” Similarly, “sell” or “bearish” are among the keywords for the opposite sentiment.

From the graph, it’s visible that the Social Volume for the former type of terms has exploded following the latest plunge in the Bitcoin price, suggesting that social media users are looking at the drawdown as an opportunity to buy more.

The bearish Social Volume has also seen an uplift, but its peak has only been half as high as one of the bullish terms. While the investors being bullish may sound optimistic at first, the fact is that this has actually not been ideal for rebounds to take place in the past.

As Santiment notes:

Historically, the best dip buy opportunities occur when the crowd consensus is showing a bit of fear toward a further drop. This usually results in small wallets dropping their bags for whales and sharks to scoop them up.

As such, the current market enthusiasm may actually be counterproductive for the chances of a bottom to form. According to the analytics firm, the real “buy the dip” for Bitcoin opportunity may present itself once the red sentiment has caught up to the blue one.

BTC Price

At the time of writing, Bitcoin is floating around $65,700, down more than 7% in the past week.
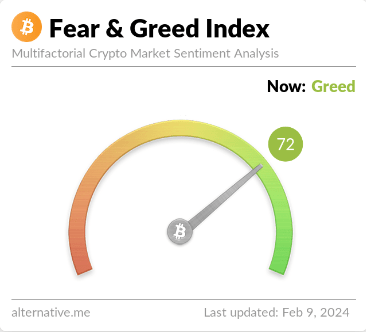
Bitcoin Price Chart

Bitcoin Sentiment Returns To Extreme Greed As BTC Breaks $71,000

Data shows the Bitcoin market sentiment has returned to the extreme greed territory as BTC has registered its rally beyond the $71,000 level.

Bitcoin Fear & Greed Index Now Points To “Extreme Greed”

The “Fear & Greed Index” is an indicator made by Alternative that tells us about the general sentiment among the investors in the Bitcoin and wider cryptocurrency market.

This index represents the sentiment as a score between zero and hundred. To calculate this value, the indicator takes into account the data of these factors: volatility, trading volume, social media sentiment, market cap dominance, and Google Trends.

When the indicator has a value of 46 or less, it means that the average investor holds a sentiment of fear right now. On the other hand, a value of 54 or more implies the market shares a majority mentality of greed. Naturally, the region in-between these two (47 to 53) corresponds to the neutral sentiment.

Now, here is what the latest value of the Bitcoin Fear & Greed Index looks like:

Bitcoin Fear & Greed Index

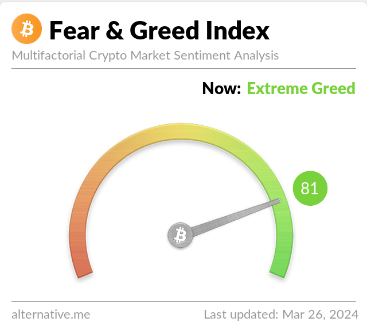
As is visible above, the Bitcoin Fear & Greed Index is at 81 right now, meaning that it’s deep into the greed region. In fact, this value is so deep that it’s inside a territory known as “extreme greed.”

Extreme greed occurs when the index hits values higher than 75. Fear also has its own extreme region; this one occupying values under 25. Historically, these two sentiments have proven to be particularly significant for the market.

BTC and other assets in the sector have often tended to move in the opposite direction from what the majority expect. In the territory of the extreme sentiments, this expectation is naturally the strongest, and hence, the probability of a contrary move taking place is also the highest.

Because of this reason, major tops and bottoms in Bitcoin’s price have typically taken shape when the cryptocurrency has been inside the respective extreme zones.

Earlier in the month, the Fear & Greed Index had assumed especially high extreme greed levels, as the asset’s rally towards new all-time highs (ATHs) had occurred.

Two of the major tops in this period, including the current ATH, coincided with peaks in the indicator, implying that the overheated sentiment may have once again played a role.

Bitcoin Fear & Greed Index

With the recent drawdown in the asset, though, the sentiment also cooled off and exited out of the extreme greed territory, as is visible in the above chart. In bullish periods, the sentiment retreading back to the normal greed region can be a positive sign for fresh upward moves to start.

And indeed, this has followed for the cryptocurrency this time as well, as its price has made notable recovery over the past couple of days. With the coin making a return back towards $71,000, the sentiment has also heated up again, hence why the index’s latest value is pointing at extreme greed.

The aforementioned tops from earlier in the month occurred at Fear & Greed Index values of 90 and 88, respectively, suggesting that the current extreme greed value of 81 may not be too high for another peak to be probable.

BTC Price

Bitcoin had broken above the $71,000 level earlier in the day, but the digital asset has since registered a bit of a pullback towards $70,700.

Bitcoin Price Chart

Bitcoin Sentiment Cools Off, Price Rebound Soon?

The Bitcoin Fear & Greed Index shows that the sentiment around the asset has cooled off a bit recently, something that could pave the way for a rebound.

Bitcoin Fear & Greed Index Has Gone Through Some Decline Recently

The “Fear & Greed Index” is an indicator created by Alternative that tells us about the average sentiment present among the investors in the Bitcoin and wider cryptocurrency market

To determine the trader mentality, the index takes into consideration for these five factors: volatility, trading volume, social media sentiment, market cap dominance, and Google Trends.

The metric uses a numeric scale that runs from zero to hundred for representing this sentiment. A score of 46 or less implies the presence of fear among the investors, while that of 54 and above suggests greed in the market.

The territory between these two (47 to 53) naturally corresponds to the neutral mentality. Besides these three sentiments, there are also two extreme sentiments called “extreme greed” and “extreme fear.”

The extreme greed occurs at values above 75, while the extreme fear takes place below 25. Historically, these two sentiments have been quite relevant for BTC’s trajectory.

Tops have generally tended to form when the investors have held the former sentiment, while bottoms have been probable to happen when the market has been in the latter region.

At present, the traders are holding a mentality of extreme greed, as the latest data of the Bitcoin Fear & Greed Index shows.

Bitcoin Fear & Greed Index

As is visible, the indicator’s value is 77 right now, meaning that while it’s indeed inside extreme greed, it’s only so just. This is a fresh change from how it has been recently, as the chart below displays.

Bitcoin Extreme Greed

From the graph, it’s visible that the Bitcoin Fear & Greed Index has mostly stayed deep inside the extreme greed region recently. On the 14th of this month, the indicator hit the 88 mark, and alongside this high, the BTC price registered its current all-time high of about $73,800.

Since this peak, though, the asset has plunged, and it appears that alongside it, so has the sentiment among the traders. As mentioned earlier, tops have been more likely to occur when the market has shared a mentality of extreme greed and this probability has generally only gone up the more extreme levels the metric has hit.

This could perhaps explain why the recent top occurred when it did. Another top this month, the one that took place on the 5th, also coincided with high values in the Fear & Greed Index (a peak of 90 this time).

Shortly after this earlier peak and the plummet in the cryptocurrency that had followed, the asset found its bottom as the metric briefly exited the extreme greed region.

As the Bitcoin Fear & Greed Index is once again looking to dip outside this territory, it’s possible that a bottom may be near for the price this time as well. It now remains to be seen if the sentiment would cool down enough in the coming days so as to leave the extreme region behind, at least temporarily.

BTC Price

Bitcoin had plunged towards $64,500 during the weekend, but it seems the coin has made some recovery in the past day as it’s now back at $68,000.

Bitcoin Price Chart

Extreme Greed Is Back For Bitcoin, Is It Time To Sell?

Data shows extreme greed sentiment has made a return among the Bitcoin investors after the cryptocurrency’s price has broken above $50,000.

Bitcoin Fear & Greed Index Now Points Towards “Extreme Greed”

The “Fear & Greed Index” refers to an indicator that tells us about the general sentiment among Bitcoin traders and broader cryptocurrency sectors.

The metric represents this sentiment using a numerical scale from zero to hundred. According to Alternative, its creator, the index calculates this score using five factors: volatility, trading volume, social media sentiment, market cap dominance, and Google Trends.

When the Fear & Greed Index has a value of 54 or greater, the investors now share a sentiment of greed. On the other hand, values of 46 or less imply the presence of fear among the traders.

The region between these two ranges (values 47 to 53) corresponds to the territory of “neutral” sentiment. In addition to these three core sentiments, “extreme fear” and “extreme greed” occur at the deep ends of the fear and greed ranges.

Here is what the Bitcoin Fear & Greed index looks like right now to see which of these regions the market is in:

Bitcoin Fear & Greed Index

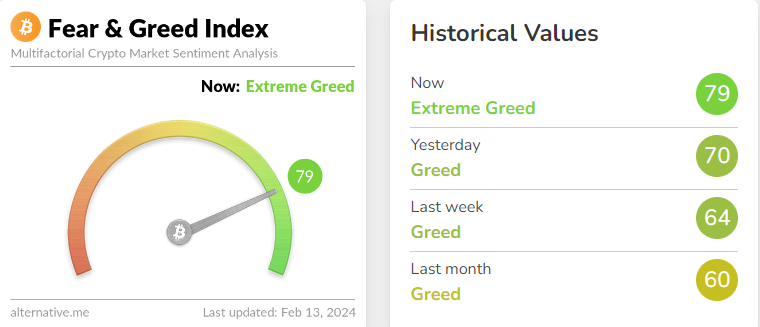
As displayed above, the Bitcoin Fear & Greed Index has surpassed the 75 threshold for extreme greed during the past day and has attained a value of 79. The metric was at 70 yesterday, so it has seen a bit of a jump in just the last 24 hours.

This surge in sentiment from greed to extreme greed has occurred as cryptocurrency broke past the $50,000 barrier for the first time since December 2021.

Historically, the extreme sentiments have been quite significant for the asset, as major bottoms and tops for the price have occurred in these regions. This relationship between the two, however, has been inverse.

Extreme fear has been when bottoms have taken shape, while extreme greed has been where tops have formed. In the past, Bitcoin has usually tended to move against the majority’s expectations. This expectation is the strongest in these ranges, so it makes sense that a reversal is the primarily likely here.

Followers of a trading philosophy called “contrarian investing” exploit this fact to time their buying and selling moves. “Be fearful when others are greedy, and greedy when others are fearful” is a famous quote from Warren Buffet that sums up the idea.

As the chart below shows, the last time the Fear & Greed Index attained extreme greed levels was around the time of the spot ETF approval.

Bitcoin Extreme Greed

As BTC investors are very well aware, the coin hit a top coinciding with the event as the market took to selling the news. Since the sentiment is now back inside extreme greed with its latest surge, another similar reversal point may be close for its price.

Perhaps it’s at a time like this when a contrarian investor would consider moving towards selling, going against the hype and euphoria floating around the market.

BTC Price

Bitcoin has enjoyed a surge of over 4% in the past day, which has taken its price towards the $50,000 mark.

Bitcoin Price Chart

Bitcoin Flies Above $47,300, But Watch Out For Extreme Greed

Bitcoin is finally showing a sustained bullish push as it has now broken above $47,300, but overly positive sentiment can be an obstacle to this rally.

Bitcoin Fear & Greed Index Suggests Market Is Nearing Extreme Greed

The “Fear & Greed Index” is an indicator that tells us about the general sentiment among the investors in the Bitcoin and wider cryptocurrency sector. According to Alternative, its creator, the index takes into account five factors to calculate this sentiment.

These are volatility, market volume, social media sentiment, market cap dominance, and Google Trends. The index outputs the sentiment as a number lying between zero to hundred.

All values of 46 and under imply the investors are fearful, while those of 54 or over suggest the presence of greed in the market. The region between 47 and 53 corresponds to the region of neutral sentiment.

Now, here is what the Fear & Greed Index looks like for Bitcoin right now to see which of these regions the market stands in at present:

Bitcoin Fear & Greed Index

As is visible above, the Bitcoin Fear & Greed Index has a value of 72 at the moment, implying that the majority of the investors in the space share a greedy mentality.

Besides the three core sentiments mentioned earlier, there are also two extreme ones: the extreme fear and extreme greed. The former of these occurs at values of 25 and under, while the latter takes place at 75 and above.

Historically, these two sentiments, in particular, have held great significance for the cryptocurrency’s trajectory. Generally, at any point, the asset is more likely to move against the expectations of the majority, and in these extreme regions, this expectation becomes the strongest.

As such, these sentiments have been where major reversals in the asset have been the most likely to occur. Followers of a trading philosophy called “contrarian investing” exploit this fact to time their buying and selling moves. Warren Buffet‘s famous quote sums up the idea, “Be fearful when others are greedy, and greedy when others are fearful.”

At a value of 72, the Bitcoin market is quite close to entering into the extreme greed region right now. Just yesterday, the metric had a value of 66, which means there has been some jump in just the past 24 hours.

Bitcoin Extreme Greed

This increase in the index has naturally come because of the bullish momentum that the asset has enjoyed in the past day. Any further improvements in sentiment, however, may be alarming, as the metric would then enter into the extreme greed territory.

The last time that the Bitcoin Fear & Greed Index surged into extreme greed values was around the time of the approval of the spot exchange-traded funds (ETFs). As it happened, the coin hit its top, coinciding with this overly bullish mentality.

Thus, if this precedence is anything to go by, any visit into the territory in the coming days may serve as a warning that a top is near for the cryptocurrency.

BTC Price

Bitcoin has enjoyed an uplift of over 6% during the past 24 hours as its price has cleared the $47,300 level.

Bitcoin Price Chart