
BTC price action is causing some to panic, but Bitcoin miner confidence in the network is there for all to see.
Cryptocurrency Financial News
BTC price action is causing some to panic, but Bitcoin miner confidence in the network is there for all to see.

Bitcoin price is closely linked to several financial assets but the reasons for correlation with certain precious metals and stocks can be quite different.
“Sharp upticks in short-term holder supply in loss tend to follow ‘top heavy markets’ such as May 2021, Dec 2021, and again this week,” one observer said.
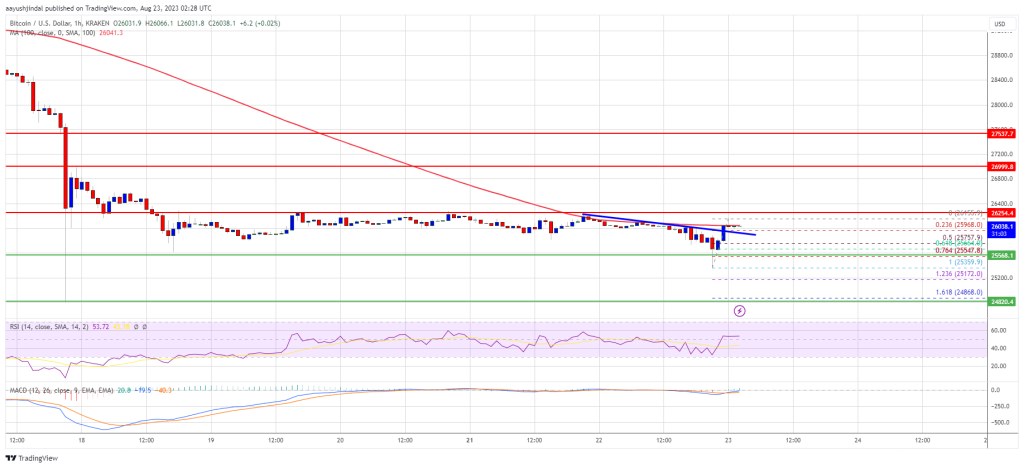
Bitcoin (BTC), the leading cryptocurrency in terms of market capitalization, is displaying persistent indications of an ongoing downtrend. Currently oscillating between the $26,000 level and the $25,800 mark, it is edging closer to a crucial support level at $25,400.
The significance of this threshold cannot be overstated for BTC bulls, as it holds the potential to halt the ongoing decline.
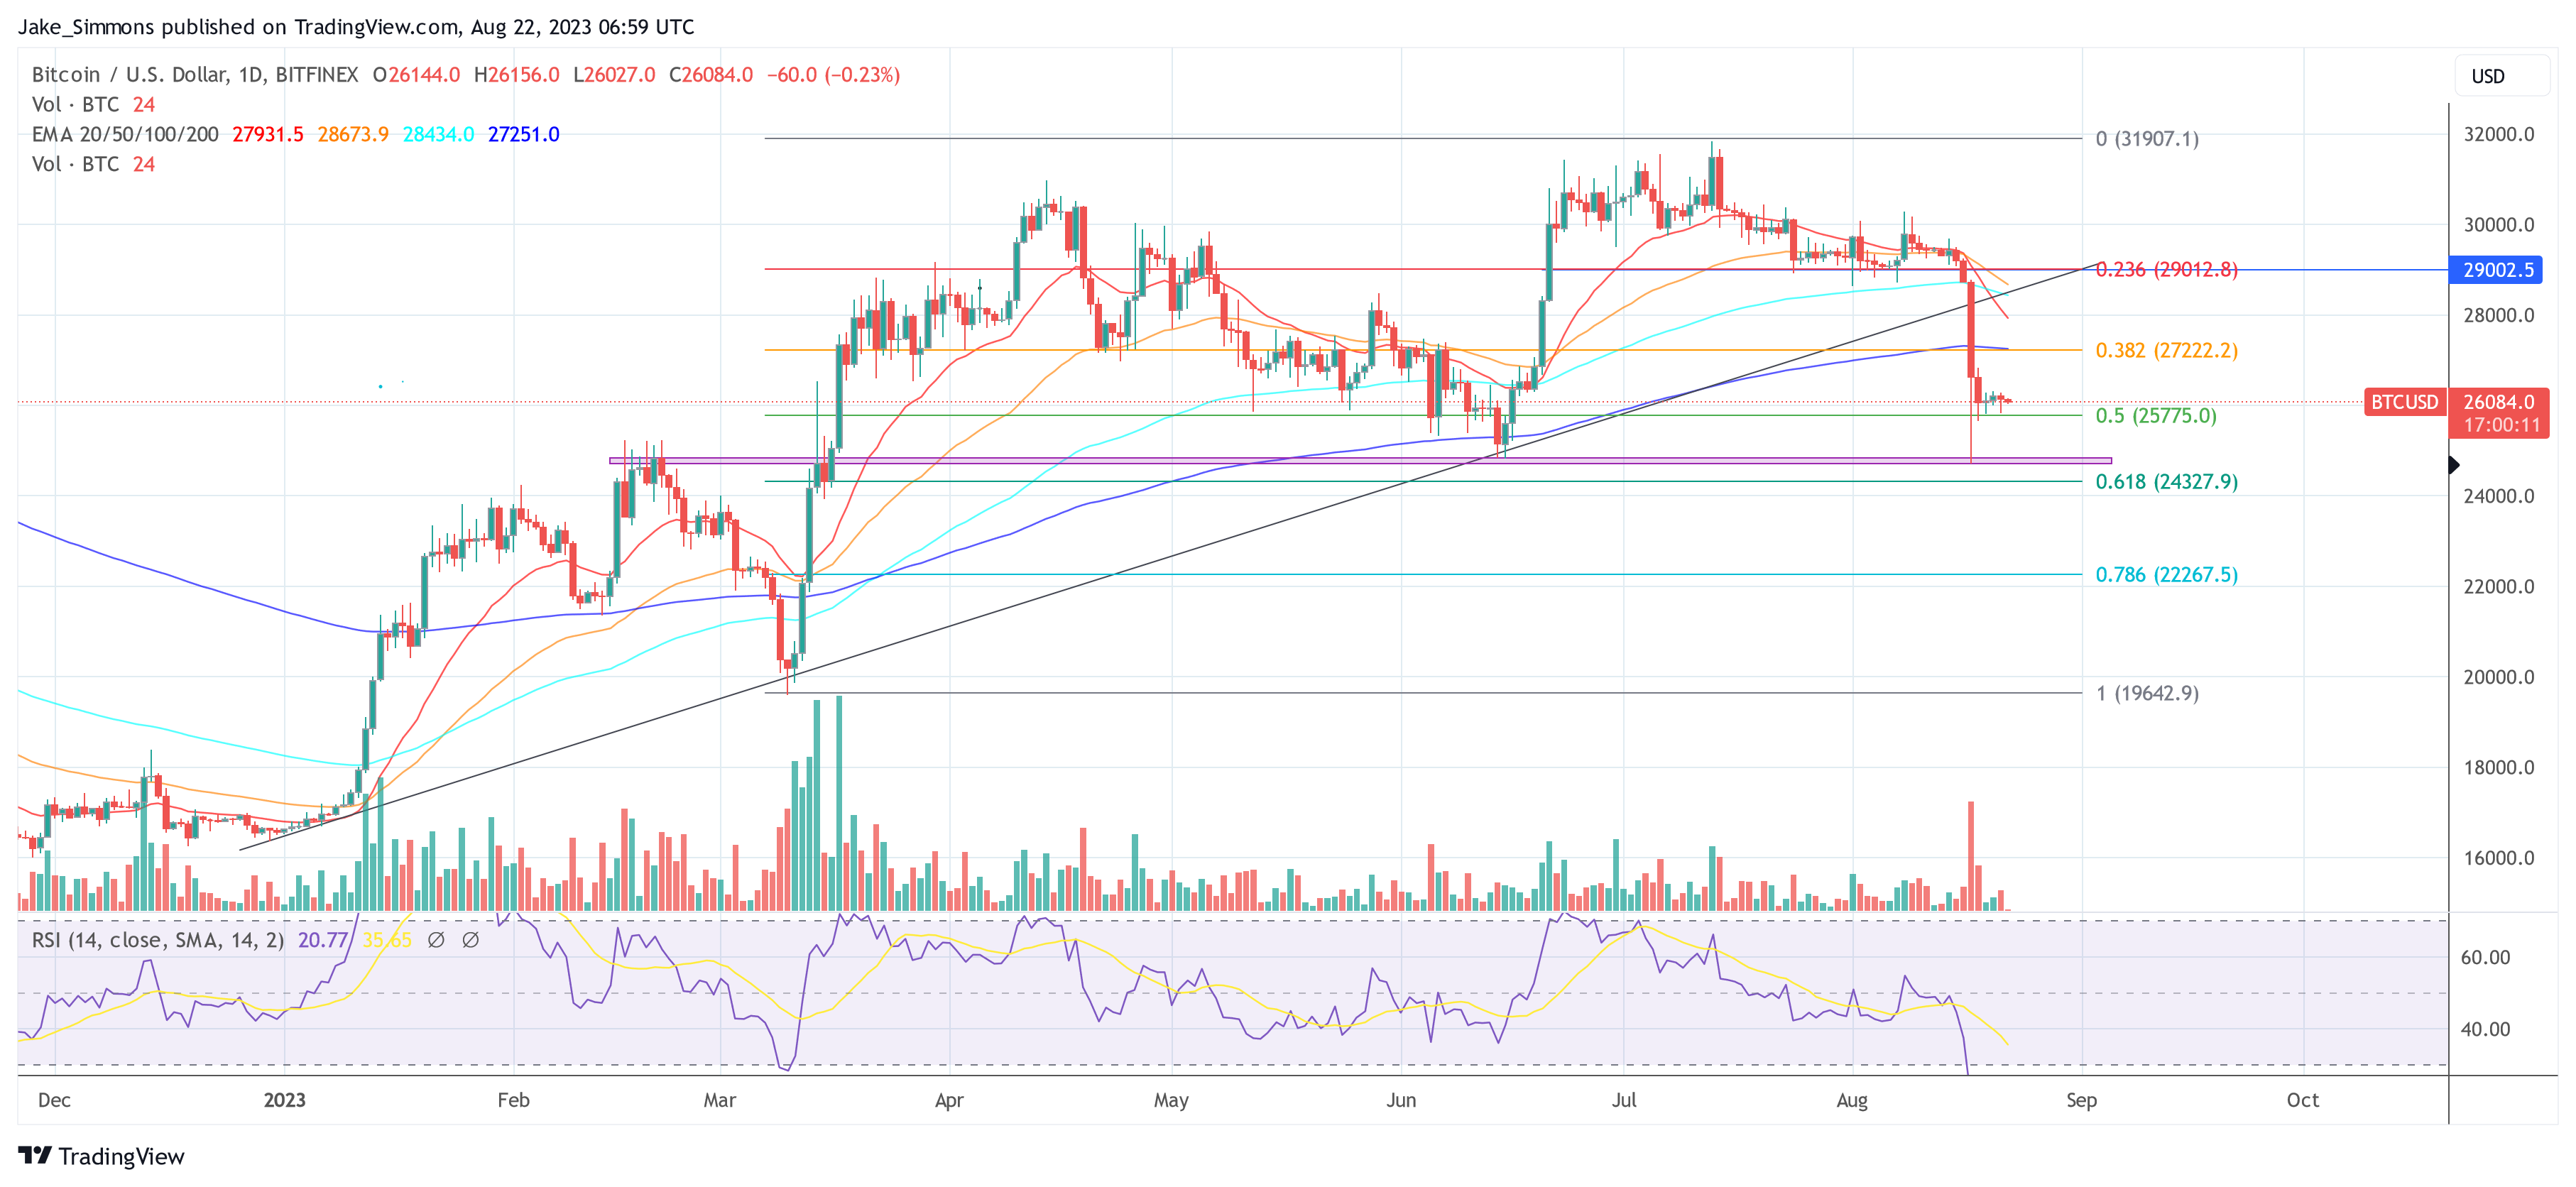
Bitcoin finds itself at a critical juncture as it tests a crucial support level, according to renowned crypto analyst Ali Martinez. The analyst points to the critical support level of $25,400, which serves as a make-or-break threshold for BTC bulls.
According to his analysis, a breakdown below this level could trigger further downside momentum, potentially leading to a dip to $22,650 or even $20,590.
While cautioning about potential downside risks, Martinez also highlights a key resistance level that Bitcoin needs to overcome for a bullish trend reversal. The $28,830 mark emerges as a crucial hurdle that BTC must surpass to shift the market sentiment in favor of the bulls.
A successful breakthrough above this resistance level could trigger renewed buying interest and potentially ignite a sustained upward move for Bitcoin.
However, as depicted in the chart above, Bitcoin briefly lost its crucial $25,400 support on August 17, dipping below the $25,100 mark. The breach triggered an immediate response from Bitcoin bulls, leading to a swift recovery and reclaiming of the $26,000 level.
Nevertheless, what is certain, is that BTC has struggled to consolidate above this line and continue its upward momentum.
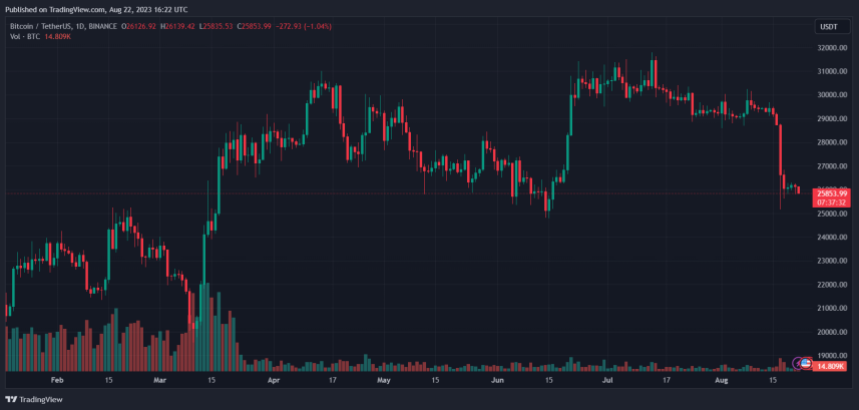
However, many market participants view this as a potential consolidation phase for Bitcoin, a pattern that has occurred historically after significant declines. These consolidation phases are often followed by a resumption of the bull run, as evidenced by previous instances.
For instance, on March 11, Bitcoin experienced a sharp decline from its first yearly high of $25,000, only to recover and conclude a one-month uptrend on April 14 at $30,900. Similarly, on June 14, after falling from its initial yearly high to the $25,000 mark once again, Bitcoin recovered and surged to achieve another yearly high at $31,800.
These historical instances suggest that the current price action for BTC is within the realm of normal. It follows a pattern of temporarily dampening investor hopes and then, under favorable circumstances, rebuilding confidence and propelling investors to new heights of optimism.
Overall, the sustainability of Bitcoin’s upcoming support floor is yet to be determined, and it remains to be seen if this current price action will follow the historical pattern of recovery seen in the past.
Should this trend persist, there is a possibility of a short-term recovery ranging between $5,000 to $10,000 for the dominant cryptocurrency in the market.
Featured image from iStock, chart from TradingView.com
Bitcoin price remained strong above the $25,500 zone. BTC could soon attempt a recovery wave above the $26,500 resistance zone in the near term.
Bitcoin price started another decline below the $25,800 zone. BTC spiked below the $25,600 and $25,500 levels. However, downsides were limited below the $25,350 level.
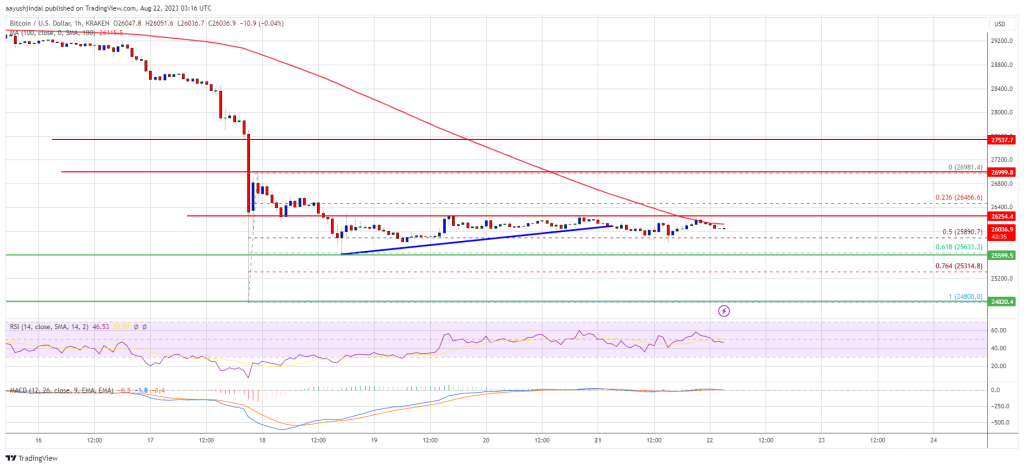
A low was formed near $25,359 and the price started a fresh increase. There was a move above the $25,500 and $25,600 levels. The price climbed above the $26,000 level and tested $26,150. Besides, there was a break above a connecting bearish trend line with resistance near $25,900 on the hourly chart of the BTC/USD pair.
Bitcoin is now trading near $26,050 and the 100 hourly Simple moving average. It is also above the 23.6% Fib retracement level of the recent increase from the $25,359 swing low to the $26,155 high.
Immediate resistance is near the $26,150 level. The next major resistance is near $26,250. A close above the $26,250 resistance might send the price toward the $26,500 resistance zone.
Source: BTCUSD on TradingView.com
If the bulls push the price above $26,500, there could be a move toward the $27,000 resistance zone. Finally, to start a decent increase, the price must settle above the $27,000 zone. A close above the $27,000 resistance could start a decent increase toward the $27,800 resistance zone. Any more gains might set the pace for a larger increase toward $28,150.
If Bitcoin fails to clear the $26,250 resistance, it could start another decline. Immediate support on the downside is near the $25,850 zone.
The next major support is near the $25,550 level or the 76.4% Fib retracement level of the recent increase from the $25,359 swing low to the $26,155 high. A downside break below the $25,550 level might push the price again into a bearish zone. In the stated case, the price could drop toward $25,000.
Technical indicators:
Hourly MACD – The MACD is now gaining pace in the bullish zone.
Hourly RSI (Relative Strength Index) – The RSI for BTC/USD is now above the 50 level.
Major Support Levels – $25,850, followed by $25,550.
Major Resistance Levels – $26,250, $26,500, and $27,000.
Crypto exchange Binance has had a tough few months in terms of market news and pressure from regulatory bodies. Just a few days ago, Binance lost another payment processing partner after Checkout.com terminated its contract with the crypto exchange. And now, another rumor that appears to be spreading is that Binance is selling Bitcoin on the spot market to sustain the price of its native token, BNB.
The rumor originated from a post made by @WhaleChart on X (formerly Twitter), claiming that Binance is allegedly selling Bitcoin on the spot market to support the price of its own token, BNB.
BREAKING:
Binance is allegedly selling Bitcoin to support the price of their own token BNB
— Whale (@WhaleChart) August 22, 2023
This rumor seems to be gaining ground since the tweet first went live, especially as the price of BNB continues to struggle in the market. This is because as one of the biggest holders of both Bitcoin and BNB, Binance is in a unique position to manipulate the market if it wanted.
However, this remains only a rumor as there are currently no signs the crypto exchange is manipulating the price for short-term gains in BNB.
Additionally, data from Coinmarketcap shows that the prices of both cryptocurrencies have been falling together in the past week, with Bitcoin also down by 11.20% in a 7-day timeframe.
This will not be the first time such allegations are being brought against the exchange. Binance has faced similar claims in the past, with crypto analyst JW claiming Binance was selling Bitcoin to prop up the price of BNB in June of this year.
Binance CEO Changpeng Zhao (CZ), however, denied the allegations, dismissing them as an attempt to spread fear, uncertainty, and doubt (FUD).
4. Binance have not sold BTC or BNB. We even still have a bag of FTT.
It is amazing they can know exactly who sold based on just a price chart involving millions of traders. FUD.
pic.twitter.com/M3MUH2bFRE
— CZ
Binance (@cz_binance) June 13, 2023
Whether or not the theories are true, Binance has surely been under intense scrutiny, but it continues to stand strong as the biggest exchange in the world.
BNB and other cryptocurrencies that rely on the BEP20 and BEP2 token standards are very dependent on Binance, as news surrounding the exchange has led to price pumps and dumps in the past. But there has been no solid evidence that the exchange has been manipulating the prices of any of these tokens.
The price of BNB has seen a drastic reduction in the past few days as the entire market goes through corrections signaled by BTC falling by more than 8% in a couple of minutes last week. As a result, BNB has seen its price drop to $209.44, a reduction of 12.33% in the past few days.
To combat a further price drop, the BNB Chain had to manually liquidate a $200 million position on the Venus DEFI protocol, which would have been liquidated after BNB dropped below $220.
At the time of writing, BNB is the fourth biggest crypto with a market cap of $32.2 billion.
The price of Bitcoin has stalled again around its current levels as an explosion in downside volatility broke critical support. The cryptocurrency is trapped between major players waiting and positioning for the next move; which side will prevail in this battle?
As of this writing, Bitcoin trades at $26,000 with sideways movement in the last 24 hours. In the previous seven days, the cryptocurrency recorded a 12% correction which has severely impacted other assets in the sector, notably XRP and Binance Coin (BNB), which recorded losses north of 15% in the same period.
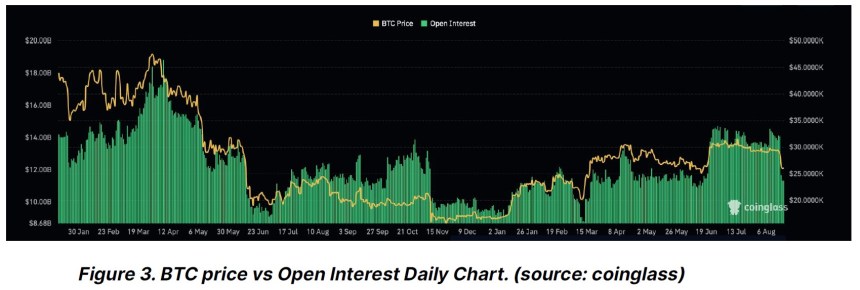
In a report from Bitfinex Alpha, an analyst points out the influence of the derivatives sector on the spot Bitcoin price. Last week, BTC’s volatility was compressed, declining into historical lows, but a negative delta (high selling pressure) persisted, moving the price lower.
At the time, Bitcoin dropped enough to trigger a liquidation cascade, which was potentially worsened by a prominent trader being forced out of their position on a crypto exchange, the report speculated. The chart below shows that Open Interest in the derivatives sector followed BTC’s price action.
This market dynamics left Bitcoin in its current state. Analysts from Material Indicators called it a “game of chicken” between prominent players waiting to see if enough liquidity will be added to support the current levels or if the selling pressure will return.
The analysts indicated that the BTC price orderbook is the thinnest in 6 months while adding the following:
(…) we are seeing small amounts of bid liquidity ladder up from $20k closer to the active trading zone, but no liquidity of any size (new or moved) has been stacked into the range defending price from a Lower Low. Needless to say, printing a LL in this TF has macro implications. Printing 2 LLs would push #BTC down to sub $20k levels.
Material Indicators showed that when the price of Bitcoin broke below critical support, most of the selling was done by relatively small traders. However, whales likely used small selling orders to reduce slippage and push prices down to current levels.
A similar scenario seems likely if the BTC price slowly bleeds into critical support triggering another liquidation cascade. In the meantime, the number one cryptocurrency seems bound to carry on its game of Chicken between large players.
Cover image from Unsplash, chart from Tradingview
This year has been marked by significant volatility across the crypto market, including for Bitcoin, which has seen both gains and losses over the course of the year. Just a month ago in the middle of July, Bitcoin crossed over $30,000 and many investors saw this as the start of another bull run.
However, things seem to have taken a turn, as the price of Bitcoin has plateaued since then. The asset is currently struggling to find a push in price, and it would seem this sentiment has flowed into digital asset funds. According to the weekly report published by digital asset manager CoinShares, Bitcoin outflows from institutional accounts have resumed in the past week.
Outflows from digital asset investment products have spiked in recent weeks to register a three-week run of outflows. This would indicate that institutional investors might be avoiding volatile cryptos. This comes two weeks after a brief period of inflows, where Ripple’s partial victory in court and recent US inflation data led to inflows in digital asset products.
However, data shows that outflows resumed last week, and it appears that the euphoria that followed Ripple’s partial triumph against the SEC has dissipated. Digital asset investment products saw $55 million in outflows last week, with Bitcoin leading the charge with outflows of $42 million.
Other cryptocurrencies like Ethereum registered $9 million outflows, while Polygon, Litecoin, and Polkadot saw outflows of $0.9 million, $0.6 million, and $0.5 million, respectively. On the other hand, XRP and Cardano saw an increase in their respective inflows of $1.2 million and $0.1 million.
In terms of region, Canada had the most outflows of $35.9. million, and Germany followed with $11 million.
Bitcoin outflows from exchanges suggest big investors may be losing faith in the popular cryptocurrency. One factor that fueled this outflow is speculations going around that the SEC might not actually approve applications for spot Bitcoin ETFs in the US. As a result, total assets under management (AuM) declined by 10% to close the week at $32.3 billion.
The speculations come as the SEC has delayed making a decision on Spot Bitcoin ETF applications multiple times. Each postponement casts more doubt on whether they will ever approve one and an outright rejection from the SEC will most likely lead to the price of Bitcoin falling to $20,000 and digital asset investment products registering more outflows.
At the time of writing, Bitcoin is trading at $26,053 and is down by 11.09% in a 7-day timeframe.
Will Bitcoin observe a repeat of the rebound that took place after the crash back in March? Here’s what this on-chain metric suggests.
As an analyst in a CryptoQuant post explained, if the BTC short-term holder SOPR crosses above 1 in the coming days, a rebound might occur. The “Spent Output Profit Ratio” (SOPR) here refers to an indicator that tells us whether the investors are selling their Bitcoin at a profit or a loss right now.
When the value of this metric is greater than 1, it means that the average holder is currently moving their coins at a profit. On the other hand, values under this threshold imply that loss-taking is the dominant behavior in the market.
The SOPR being precisely equal to one naturally suggests that the investors are just breaking-even on their selling currently, as the total amount of profits realized in the market is precisely canceling out the losses.
In the context of the current discussion, the SOPR for only a specific market segment is of interest. Namely, the short-term holder (STH) SOPR is the relevant metric.
Here is a chart that shows the trend in the 7-day simple moving average (SMA) Bitcoin STH SOPR over the past few months:

The STH group includes investors who purchased their BTC less than 155 days ago. This cohort makes up one of the two main segments of the market, the other side being the “long-term holders” (LTHs).
As displayed in the graph, the 7-day Bitcoin STH SOPR had been floating around the neutral mark before the recent crash, but following it, the metric has plunged into the loss territory. This would suggest that the STHs have been panic-selling at a loss after they witnessed the cryptocurrency register a deep drawdown.
The chart shows that the crash back in March of this year also pushed the STHs into selling at a loss. The lowest value that the 7-day STH SOPR has seen in the current crash so far has been similar to what the March crash observed.
Historically, capitulation has allowed the asset to form bottoms, as in such events, the weak hands exit the market, and the more persistent investors may pick up their coins.
This effect seems to have worked in March, as the coin hit its bottom during the STHs’ capitulation. As the loss selling slowed down, Bitcoin rebounded in speculator fashion, as its price jumped below $20,000 to near the $30,000 mark.
Currently, the STHs’ loss selling is slowing down, as the metric’s value is gradually rising. The latest capitulation may have also allowed BTC to form a bottom this time. It remains to be seen whether that was the case, and if Bitcoin can show a rebound similar to back in March.
At the time of writing, Bitcoin is trading around $26,000, down 11% in the last week.

BTC price “death chop” continues to characterize the aftermath of last week’s Bitcoin flash crash.
An unknown Bitcoin wallet has emerged as the global third-largest BTC holder. The wallet used three months to accumulate BTC to climb to its present position in the ranking of holders. Following the recent revelation, some speculations and theories have been trending about the owner of the mysterious wallet.
The crypto statistics platform, BitInfoCharts, provided data regarding the mysterious wallet. The data indicated that the wallet first received some BTC coins on March 8. Within three months and two weeks, the wallet amassed 118,000 BTC. Going by the current prices in the crypto market, the coins are worth $3.08 billion.
Despite holding such a large number of BTC, the whale is still not the largest in the sector. Data from BitInfoCharts disclosed that the current largest Bitcoin wallets in the world belong to Binance and Bitfinex and these top two BTC wallets are currently operating as cold wallets.
Binance’s cold wallet emerged as the global largest BTC holder on March 10, 2021, with 143,528 BTC. It progressed gradually to hit an all-time high of 299,427 BTC by June 2021. But the wallet’s holding as of June 2023 was 248,597 BTC coins worth over $6 billion, according to the current prices.
On the other hand, Bitfinex’s cold wallet is ranked the second-largest BTC holder, while the mysterious wallet occupies the third position currently. Interestingly, the fourth-largest Bitcoin wallet is another Binance cold wallet.
Following the emergence of the mysterious wallet as the third-largest Bitcoin holder, speculations and theories started flowing within the crypto space and many have suggested the possible owner of the wallet.
One X (formerly Twitter) user, DivXMan, pointed out that the mysterious wallet witnessed its initial major transaction of 3,400 BTC tokens on May 16, 2023. One month later, the largest global asset manager Blackrock filed for a spot in Bitcoin ETF on June 15. Another user posted a huge black rock, suggesting that the wallet belongs to BlackRock.
This has triggered a rumor that BlackRock could be the owner of the unknown wallet. This is based on close timing between its Bitcoin ETF filing and the wallet’s key accumulation of BTC. However, the theories about BlackRock being the possible owner of the mysterious wallet lack concrete evidence.
Notably, the application for a spot BTC ETF from BlackRock created a large wave within the crypto market. And if the US Securities and Exchange Commission (SEC) approves the filing, it would become the first Spot Bitcoin ETF to trade in the US.
Besides BlackRock, other prominent companies and entities applied for a spot in Bitcoin ETF. These include Fidelity, Valkyrie, Invesco, and Wisdom Tree, among others.
The current sentiment among Bitcoin investors may hold the key to understanding whether the current drop is a buying opportunity or not.
In a new insight post, the on-chain analytics firm Santiment has looked into how the trader sentiment has shifted in the BTC sector since the crash a few days back.
Related Reading: Will Bitcoin Retest $20,500 Again? This Pattern May Suggest So
First, the analytics firm has checked for the amount of “buy the dip” types of calls that have been happening on social media recently.

Here, Santiment has made use of its “social volume” metric, which finds the unique number of social media posts that are making mentions of a given term or topic.
Naturally, the social volume for Bitcoin/cryptocurrency is taken here, and has then been filtered for terms like ‘buy’ and ‘dip.’ From the chart, it’s visible that the social media users were participating in some heavy discussion around such topics just when the Bitcoin crash toward the $26,000 level occurred a few days ago.
This implies that the traders were optimistic that the asset would quickly recover and they believed that the drop presented an ideal buying opportunity.
As the asset has only continued to move sideways since the crash, however, optimism on social media has appeared to have slowly vanished, as ‘buy the dip’ calls have plunged. However, this is not all bad news as Santiment points out.
“Believe it or not, it’s a good sign that people are no longer certain that this is a dip buy spot,” explains the analytics firm. “It means that pessimism is beginning to take over again as market caps fade.”
Historically, bottoms have become more probable to form the more pessimistic about the market the majority of the traders have been. Thus, this development can potentially allow the coin to recover.
In terms of the social volume broken across the major social media platforms, it would appear that Redditors have still not given up hope for a reversal.

While the overall market sentiment may have cooled down, it would seem that it hasn’t yet happened on all platforms equally. But it may provide a unique opportunity for a good entry point.
“When all four social platforms align and have settled back down to neutral mentions of buying the dip, this is when the actual opportunity has historically presented itself for patient traders,” notes Santiment.
A sign that may not be so positive can be the fact that the “social dominance” of Bitcoin, the percentage share of the total social volume of the top 100 assets, has dropped back to normal levels, after briefly hitting the highest level of 2023 following the crash.

This would mean that social media users are still engaging in discussions related to altcoins, which is a sign that there is still greed left in the market. Ideally, the Bitcoin’s social dominance should remain high.
“High discussion related to the #1 asset coincides with fear, whereas discussions about more speculative assets tends to coincide with greed,” says the analytics firm. “Fear is when markets rise.”
Overall, it would appear that the market sentiment is moving in the correct direction, but it hasn’t yet completely aligned in a way that has historically been favorable for a Bitcoin rebound to occur.
At the time of writing, Bitcoin is trading around $26,000, down 11% in the last week.
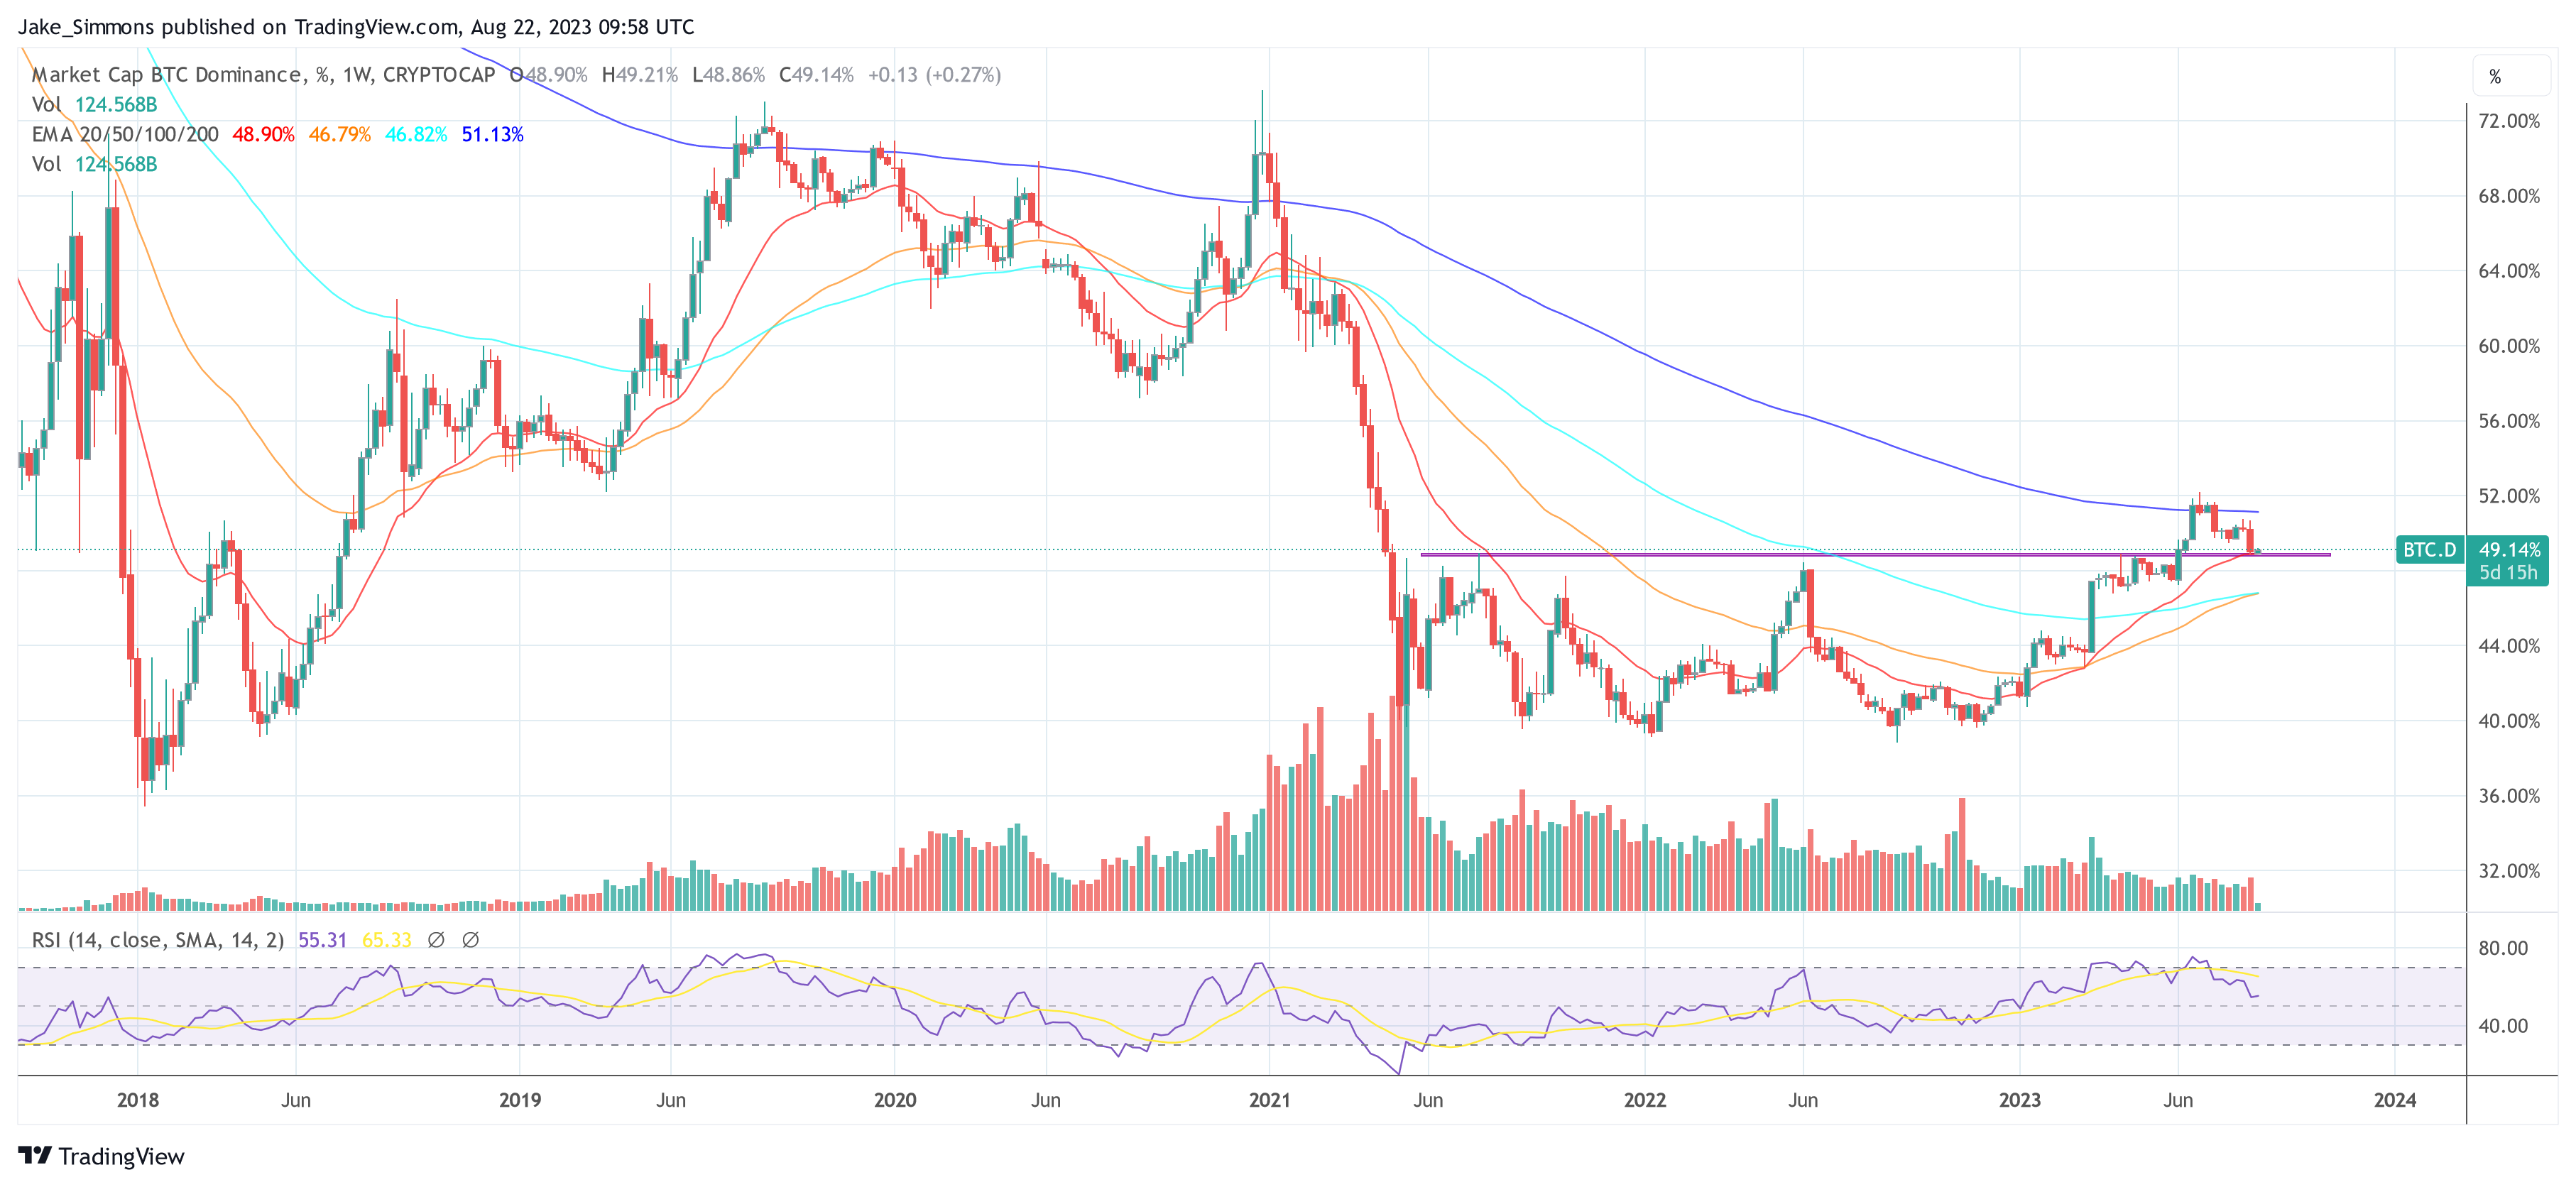
Market observers are closely eyeing the tussle between Bitcoin and its altcoin counterparts. Bitcoin’s dominance, a critical indicator of its market influence relative to the entire crypto market, has reached a pivotal crossroads. This juncture holds the potential to determine whether this year’s trend of Bitcoin outperforming altcoins will persist or if the heralded “altcoin season” is on the horizon.
Bitcoin Dominance (BTC.D) stands as a percentage value that calculates Bitcoin’s market capitalization against the entire global crypto market capitalization. This metric has garnered substantial attention due to its role in reflecting shifts in market sentiment.
Since May 2021, Bitcoin dominance has oscillated within a range of 39% to 49%. However, early June this year marked a breakout from this range, with BTC.D briefly surging above 52% before retracing toward the 49% level in recent weeks. A successful retest of this level could trigger new bullish momentum for BTC against altcoins. On the flipside, a drop below this level could trigger a longer-term drop towards 39%, the range-low which would trigger the start of a new altcoin season.
Daan de Rover, a prominent Crypto YouTuber, emphasizes the importance of understanding the broader market cycle before predicting an “altcoin season.” He argues that the current phase, being the pre-halving stage of the Bitcoin cycle, might not be the optimal time for altcoin investments.
De Rover highlights that a minor retracement in Bitcoin dominance shouldn’t overshadow the overarching upward trajectory, advising that the right time for significant altcoin investments usually occurs after Bitcoin surpasses its all-time high. “We are currently in the pre-halving stage of the cycle, which is generally not the best time to buy altcoins. Bitcoin dominance might drop by 3%, but this is likely just a minor retracement in a larger upward move.” emphasized the crypto YouTuber.
Benjamin Cowen, the founder of ITC Crypto, sheds light on the shifting sentiment, stating, “In June, many said BTC dominance would never break 49% and that alt season was about to begin. Now those same people are dunking on BTC dominance because it had a pullback to 49%. The altcoin casino will remain open until all the money is gone,” indicating that the altcoin market’s potential is far from exhausted.
Michaël van de Poppe, the CEO and founder of MN Trading, delves into historical patterns to discern the optimal time for investing in altcoins. He suggests that the best opportunity emerges around 8-10 months before a Bitcoin halving, during a period of low market confidence. Van de Poppe indicates that the performance of altcoins often hinges on Bitcoin pairs, asserting that they show interest in the markets and initiate rallies when least anticipated.
Highlighting the cyclical nature of the market, van de Poppe references past instances when altcoin strength followed historical patterns despite market variables. He references examples like Ethereum’s cycle low in September ’19 and October ’15, occurring precisely 252 days before Bitcoin halvings, which heralded altcoin bull runs.
The next two or three weeks will probably decide who is right and whether Bitcoin will continue its dominance or if altcoins will make their move and become the favored asset. Investors should therefore watch BTC.D closely.

Bitcoin Realized Cap HODL Waves signal that the current bull market launch is a classic repeat of BTC price history.
Bitcoin and ether held steady over the past 24 hours, data from CoinGecko shows, with few fundamental catalysts to lift markets.
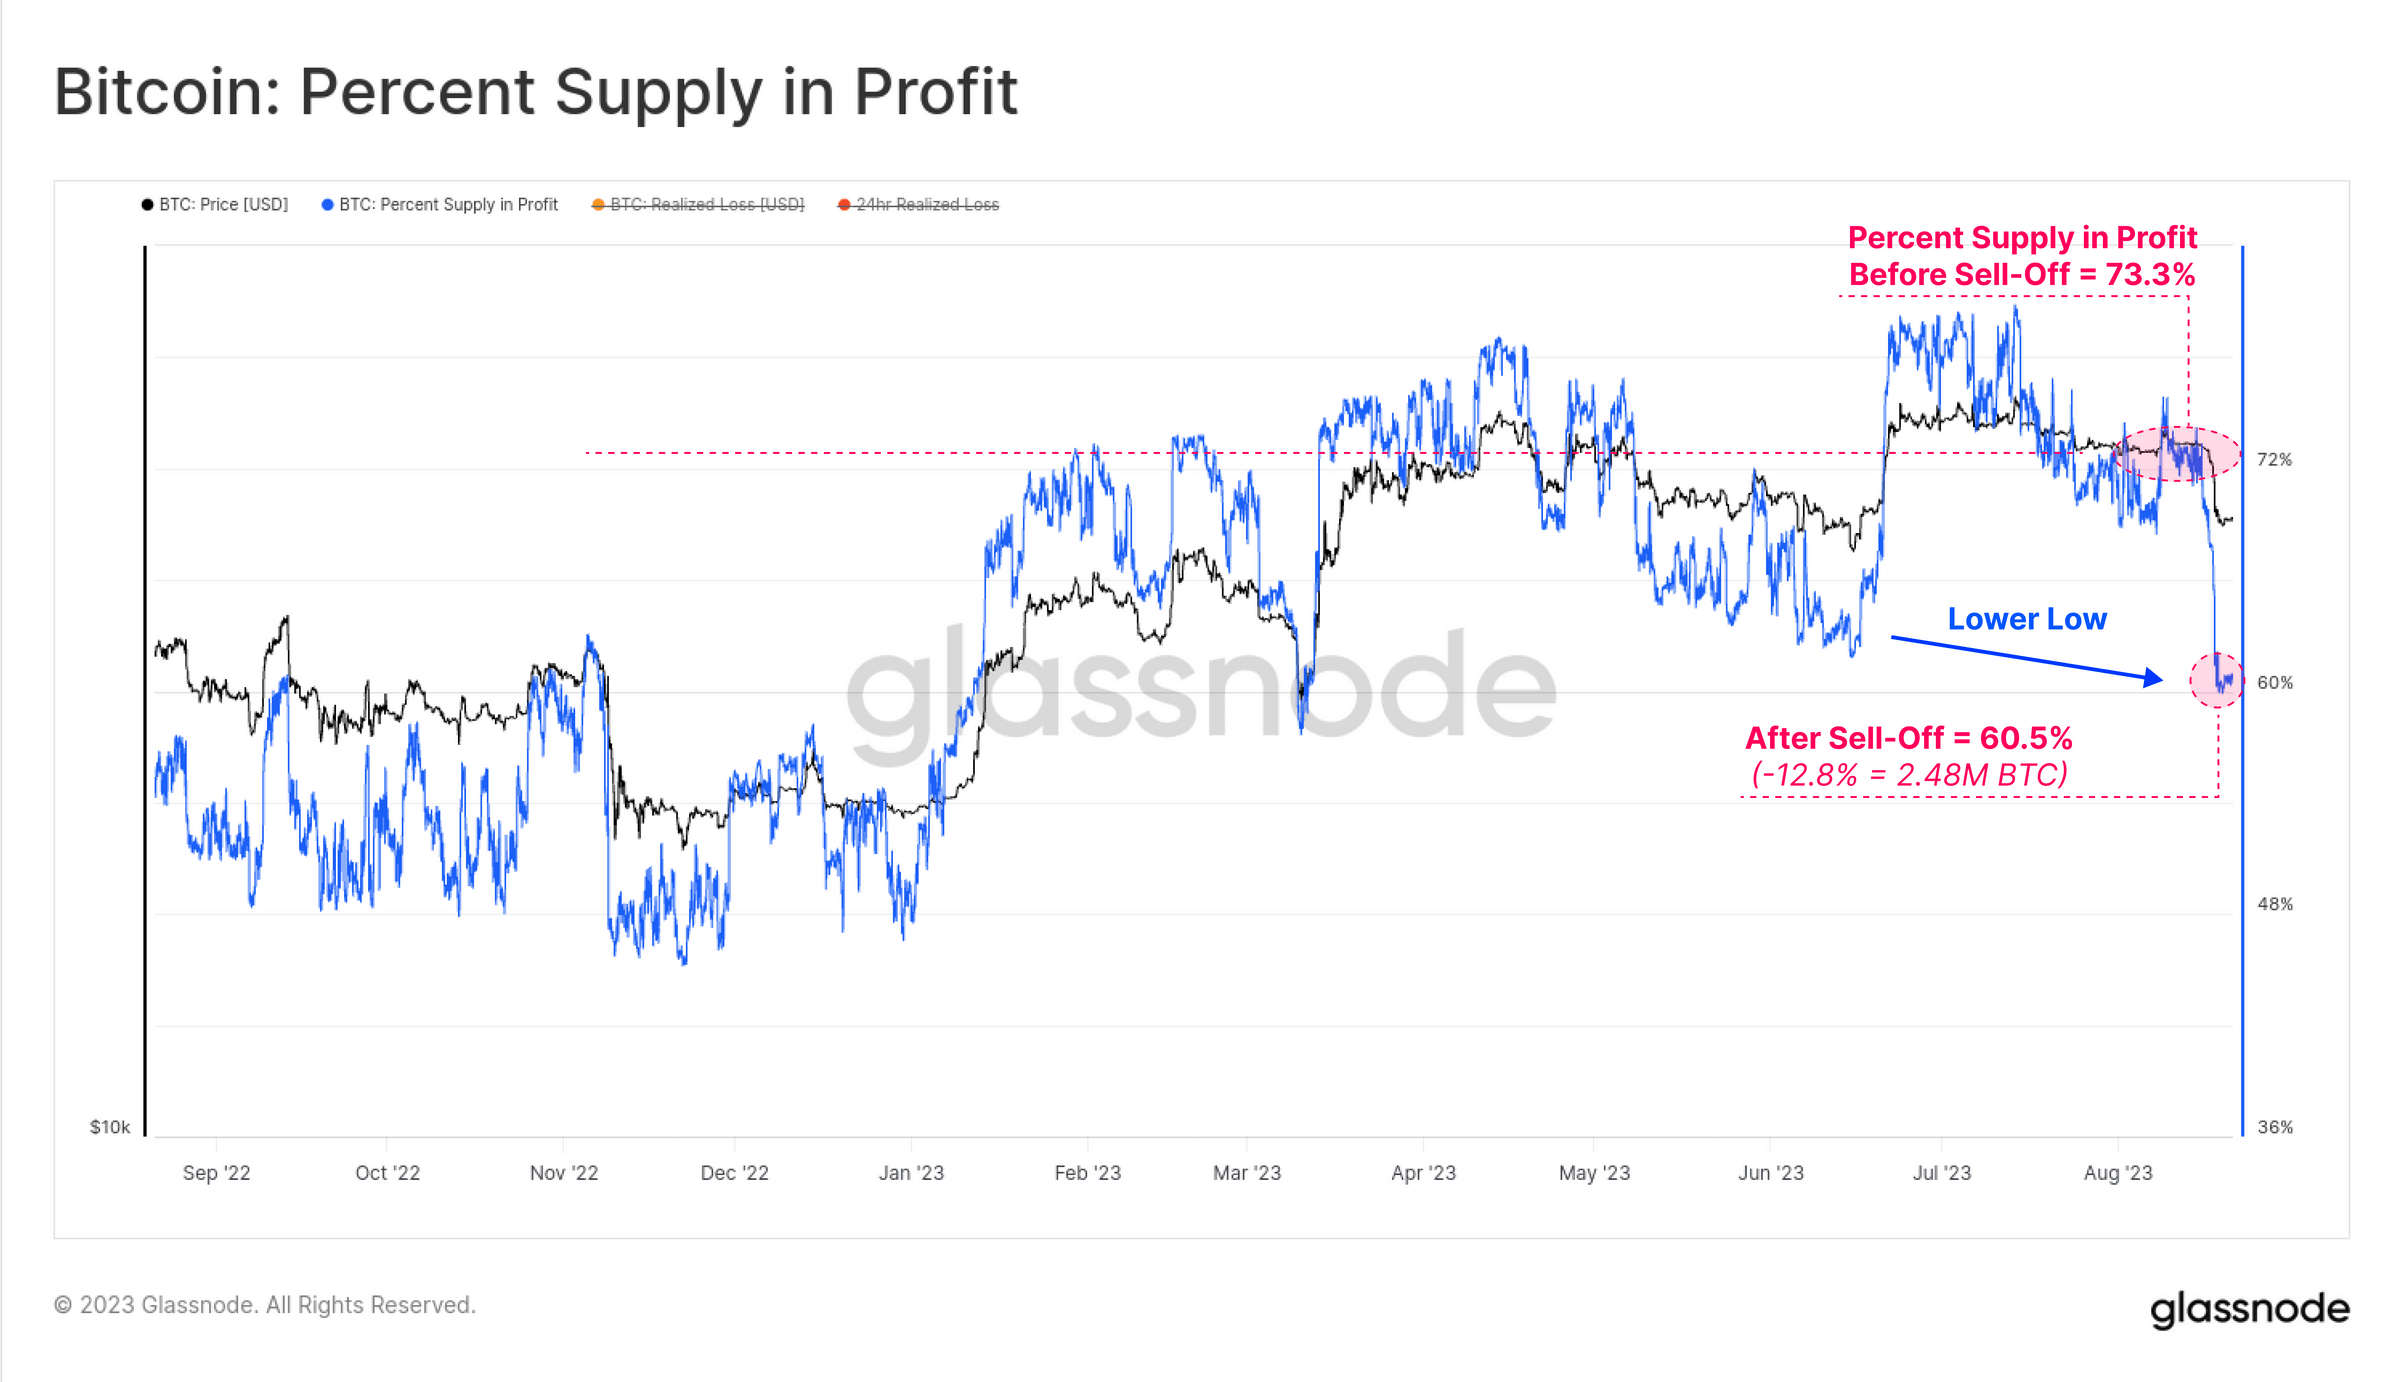
After the Bitcoin price crash last week, on-chain data reveals a picture that points to a “top-heavy” price. Glassnode’s latest insights shed light on the current market dynamics, where a significant chunk of the BTC spot supply finds itself with a cost basis either near or surpassing the prevailing price.
“Here we see that 12.8% (2.48M BTC) of the supply fell into an unrealized loss this week, setting a lower low on this metric. This suggests that ‘top heaviness’ in spot markets may also be a factor in play,” commented Checkmate, Glassnode’s chief analyst.
Notably, Long-Term Holders (LTHs) have displayed remarkable resilience in this turbulent period. Their interaction with exchanges remains largely unaltered, with the aggregate balance of LTHs marking a new All-Time High (ATH) this week. In stark contrast, the behavior of Short-Term Holders (STHs) emerges as particularly salient.
Checkmate notes, “With LTH supply at ATH, we can also see that STH supply remains at multi-year lows.” The data further underscores this: out of the 2.56M BTC held by STHs, a mere 300k BTC (11.7%) remains in profit, meaning that 88.3% are in loss. This needs to recover quickly, else it adds to the bear case, according to Checkmate.
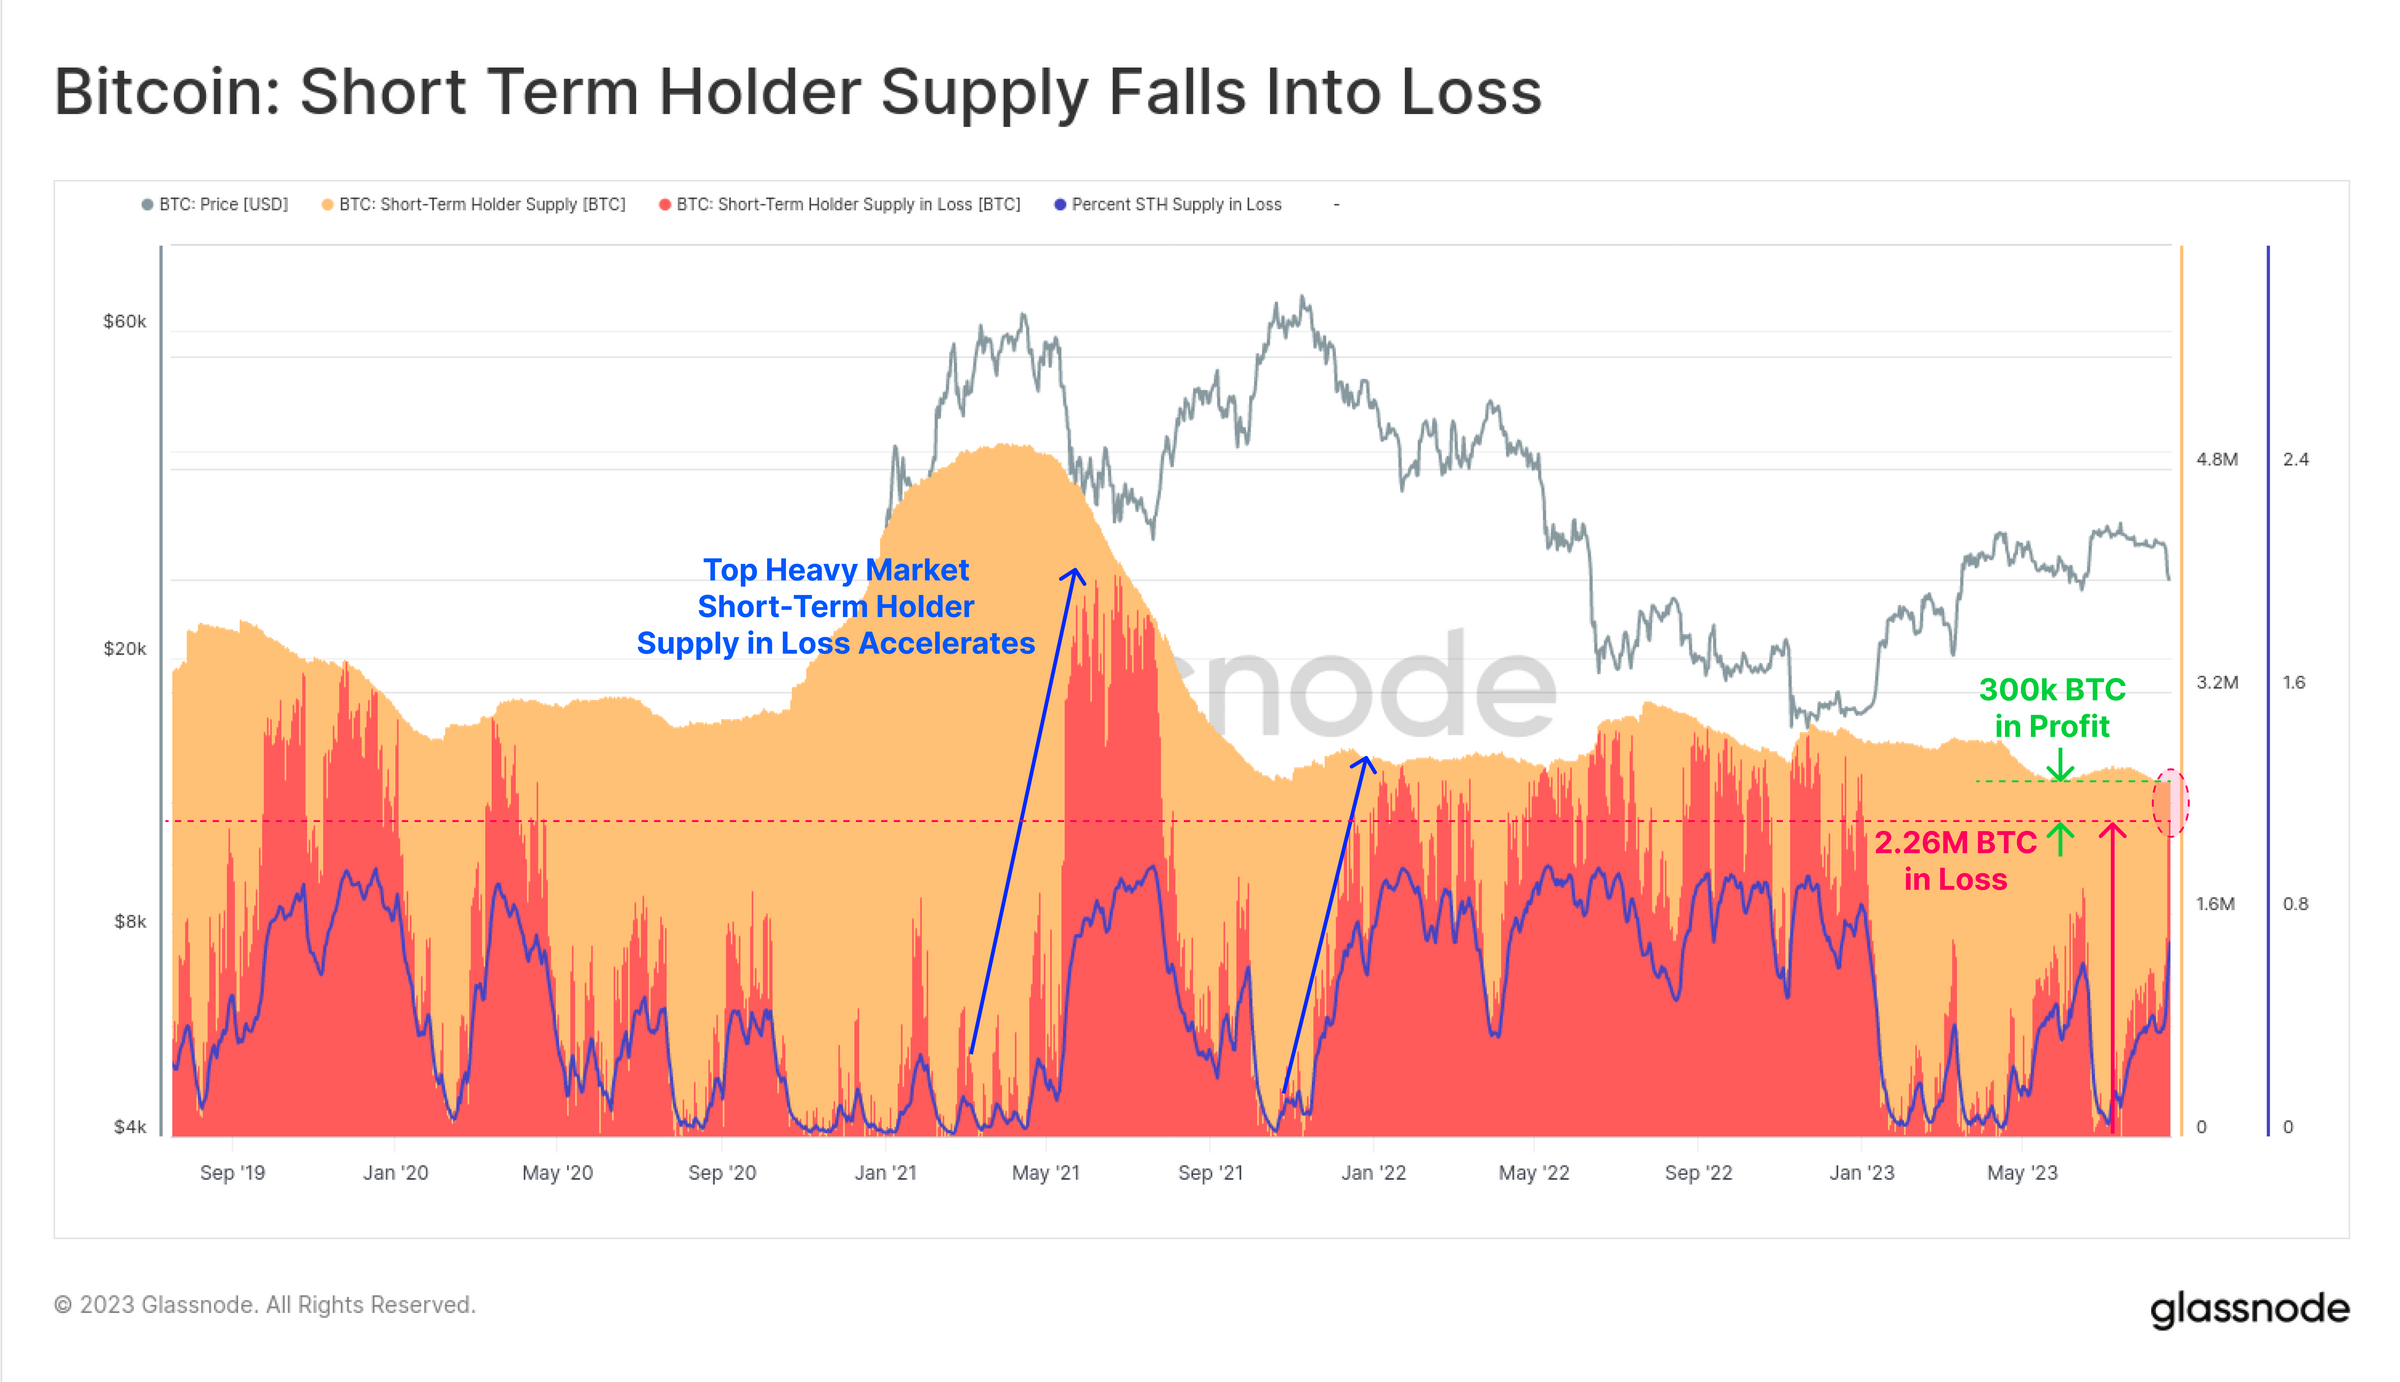
Historical data indicates sharp upticks in STH supply losses following periods characterized as ‘top heavy markets’ – similar to the events observed in May 2021, December 2021, and once again, the last week.
The fluctuating dynamics between profits and losses witnessed in the market can be further distilled through the Profit or Loss Bias (dominance) metric. As the 2023 rally unfolded, a discernible shift was noted in the STH cohort’s position: “This week we saw the largest loss dominance reading since the March sell-off to $19.8k. This suggests that the STH cohort are both largely underwater on their holdings, and increasingly price sensitive,” added Checkmate.
An intriguing revelation comes from Glassnode’s experimental tool aimed at discerning market inflection points. With a meticulous design that maps macro trends of investors and the prevalence of profitability over losses (and vice versa), this tool offers a nuanced ‘Momentum indicator’.
According to Checkmate, “We can see that after several months of declining profit dominance, Loss momentum and dominance have increased meaningfully.” Notably, while false positives have been recorded – as observed in the March 2023 correction – sustained declines have historically been precursors to sharper downtrends.
Overall, the Bitcoin price crash on August 17 stands as the most significant single-day decline YTD. The sell-off was primarily a futures market leverage flush out, and is thus primarily a result of short-term positioning and market structure.
However, the predominant sentiment is one of caution, largely because the most significant impact has been technical, specifically falling below long-term moving averages, a factor that could sway market sentiment.
Long-Term Holders remain stoic, but the spotlight is on the Short-Term Holders. With an overwhelming 88.3% (equivalent to 2.26M BTC) of their supply at an unrealized loss, combined with an uptick in realized losses sent to exchanges and a breach of key technical support, the onus is on the bulls to defend their stance. Checkmate concludes:
There is for sure potential for further downside momentum, but the majority of the damage is positioning and technical. The bull case is that realistically nothing has changed aside from the price, and the R/R still favors the upside. Calls for 12k are kidding themselves, but calls for 100K are as well.
Net Result == same as every pre-halving year ever.
At press time, the Bitcoin price stood at $26,084.
Bitcoin’s relative strength index has dropped well below 30 to its strongest oversold reading since March 2020.
Bitcoin price is struggling to recover above the $26,500 level. BTC could gain bearish momentum if there is a move below the $25,600 support.
Bitcoin price attempted a recovery wave above the $26,000 resistance zone. BTC climbed above $26,200 but struggled to continue higher.
It formed a top near the $26,500 zone and recently started a fresh decline. There was a move below the $26,200 level. Besides, there was a break below a connecting bullish trend line with support near $26,000 on the hourly chart of the BTC/USD pair.
Bitcoin tested the 50% Fib retracement level of the recovery wave from the $24,800 swing low to the $26,981 high. It is now trading below $26,400 and the 100 hourly Simple moving average.
Immediate resistance is near the $26,100 level and the 100 hourly Simple moving average. The next major resistance is near $26,250. A clear move above the $26,250 resistance might send the price toward the $26,500 resistance zone.
Source: BTCUSD on TradingView.com
The main breakout zone is now forming near the $27,000 zone. A close above the $27,000 resistance could start a decent increase toward the $27,550 resistance zone. Any more gains might set the pace for a larger increase toward $28,150.
If Bitcoin fails to clear the $26,250 resistance, it could continue to move down. Immediate support on the downside is near the $25,900 zone.
The next major support is near the $25,600 level or the 61.8% Fib retracement level of the recovery wave from the $24,800 swing low to the $26,981 high. A downside break below the $25,600 level might push the price further into a bearish zone. In the stated case, the price could drop toward $25,000.
Technical indicators:
Hourly MACD – The MACD is now gaining pace in the bearish zone.
Hourly RSI (Relative Strength Index) – The RSI for BTC/USD is now below the 50 level.
Major Support Levels – $25,900, followed by $25,600.
Major Resistance Levels – $26,250, $26,500, and $27,000.
The largest cryptocurrency by market cap, Bitcoin (BTC), dropped after a prolonged period of consolidation around the $29,000 mark. The failure to sustain this level has resulted in a decline to $26,000.
Interestingly, Bitcoin’s recent reversal has coincided with speculations of an imminent bull run, with many believing that the cryptocurrency winter is over and that lower price levels will not be revisited.
Nonetheless, this sentiment shifted on July 14th when the US Dollar Index (DXY) initiated a robust rally, surging from 99 points to its current level of 103.
As the DXY began its ascent, Bitcoin’s trajectory turned downward, leading to a downtrend that caused the cryptocurrency to relinquish a significant portion of its 2023 gains. Conversely, before July, BTC experienced a surge to its yearly high of $31,800, while the DXY declined.
Despite this development, Glassnode co-founder Yan Allemann suggests that in the coming months, it will be Bitcoin’s turn to reclaim the spotlight and assert its dominance once again.
Glassnode co-founder Yan Allemann has shared insights on the current market conditions and predicts an imminent surge in Bitcoin’s value as the autumn approaches.
Allemann’s analysis suggests that the US Dollar is expected to reach a peak level of 106, which will catalyze a prime environment for Bitcoin.
Historically, the inverse correlation between the Dollar and Bitcoin has been observed, where a stronger Dollar tends to put downward pressure on the cryptocurrency’s price. Conversely, a peak in the Dollar often coincides with a favorable environment for Bitcoin to thrive.
This said, Allemann believes that Bitcoin is projected to reach the $37,000 level before embarking on a significant upward movement during the autumn season.
This anticipated surge in value aligns with the patterns observed in previous market cycles, where Bitcoin has experienced notable price rallies during the latter part of the year.
It remains to be seen how this narrative unfolds, but one thing is clear: the dynamics between Bitcoin and the US dollar continue to shape the cryptocurrency landscape.
According to data by CoinGlass, August, and September have historically presented challenges for Bitcoin, making them notorious months for the cryptocurrency’s performance.
With 10 days remaining until the monthly close, August has already proven to be a difficult month for Bitcoin, experiencing a 12% decline over the past 30 days. However, this downtrend may not come to a halt just yet, as historical data indicates that September could pose additional obstacles to Bitcoin’s price trajectory.
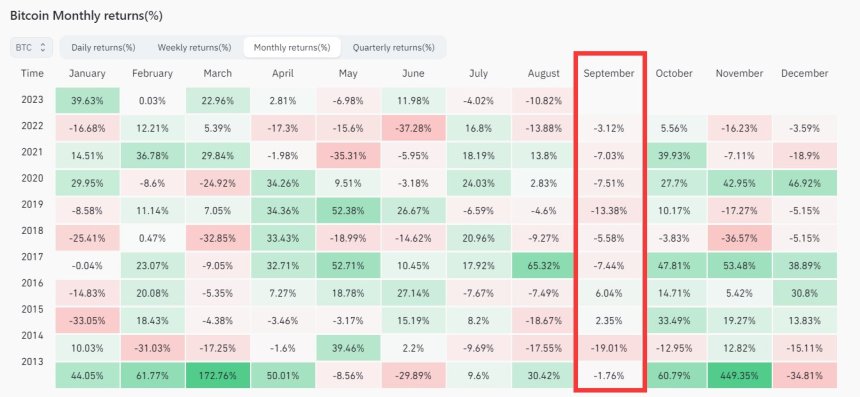
Examining the chart above, it becomes evident that September has historically been a challenging period for Bitcoin.
In some instances, the cryptocurrency has witnessed substantial price drops, reaching as high as 19%. This suggests that the coming month could potentially be characterized by further downward pressure on Bitcoin’s price.
However, it is important to note that historical trends also indicate the possibility of more modest declines. In 2013, for example, Bitcoin’s price only decreased by 1% during September, defying the broader negative sentiment associated with the month.
This demonstrates that while September has a historical reputation for difficulty, it does not guarantee a significant downturn for Bitcoin in every instance.
While Bitcoin has faced headwinds in August and historically in September, it is worth remembering that the cryptocurrency has demonstrated resilience and the ability to recover from downturns in the past.
Market conditions, macroeconomic factors, and regulatory developments can all contribute to the price fluctuations of Bitcoin and other cryptocurrencies.
Featured image from iStock, chart from TradingView.com
Bitcoin price just experienced one of its fastest and sharpest corrections in over a year, dropping 10% in a matter of minutes.
The mass liquidations and panic from the selloff caused BTCUSD daily charts to reach the most oversold level since the COVID crash in early 2020.
As much as people try to fight it, investing and trading is an emotion-driven process. Few emotions cause humans to take action more urgently than those associated with fear and panic.
This is precisely why selloffs tend to be sharper and scarier than bull markets. “Bulls take the stairs, bears ride the elevator” is just one adage that symbolizes this noted market behavior.
For example, the COVID collapse in March 2020 took only a matter of days to erase 70% of Bitcoin’s price. This instance was the last time the Relative Strength Index technical indicator on the daily timeframe became this oversold.
After Bitcoin’s recently drop this week, the daily RSI is back at a similar extreme for the first time in more than three years. What isn’t clear quite yet, is if the extreme represents another ideal buying opportunity, or if this is the onset of a deeper decline.
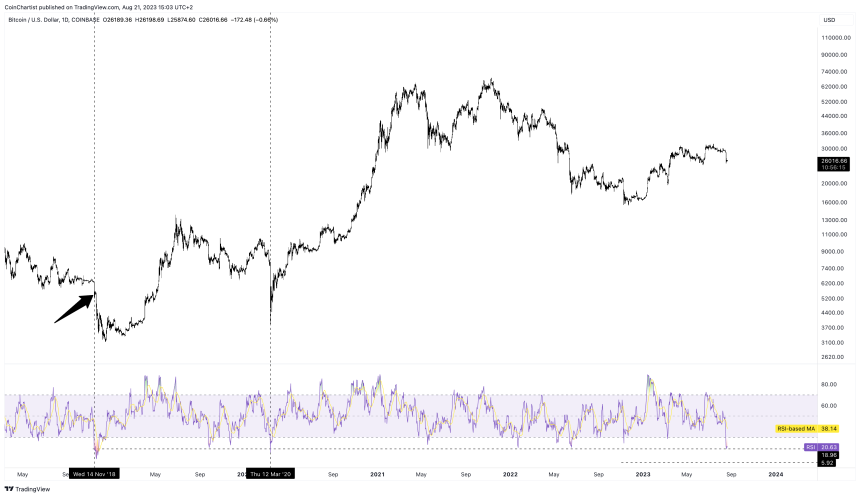
The Relative Strength Index is a momentum indicator that tells investors and traders when an asset is overbought and oversold on a relative basis. When the tool reaches extremes above 70 or below 30, it can present an opportunity to buy or sell. The RSI is now lower than the LUNA or FTX collapse, or at any point since March 2020.
During especially strong moves, however, the RSI can remain elevated for extended phases despite reaching such overheated readings. Such was the case in December 2018, the previous instance of the daily Bitcoin RSI reaching such a low.
In that case, the RSI stayed hot for two full weeks, cutting down BTCUSD price by another 40% before it was all said and done. A 40% correction in Bitcoin would take prices back to the November 2022 bottom.
If Bitcoin instead rebounds and reacts more akin to 2020, new all-time highs could be just months away. If not, a deeper reset is possible.
#Bitcoin daily RSI is now the most oversold in all of 2023
Act accordingly pic.twitter.com/GpKFAvsonc
— Tony "The Bull" (@tonythebullBTC) August 17, 2023


