Why Low Volatility Bitcoin Could Last A Lot Longer

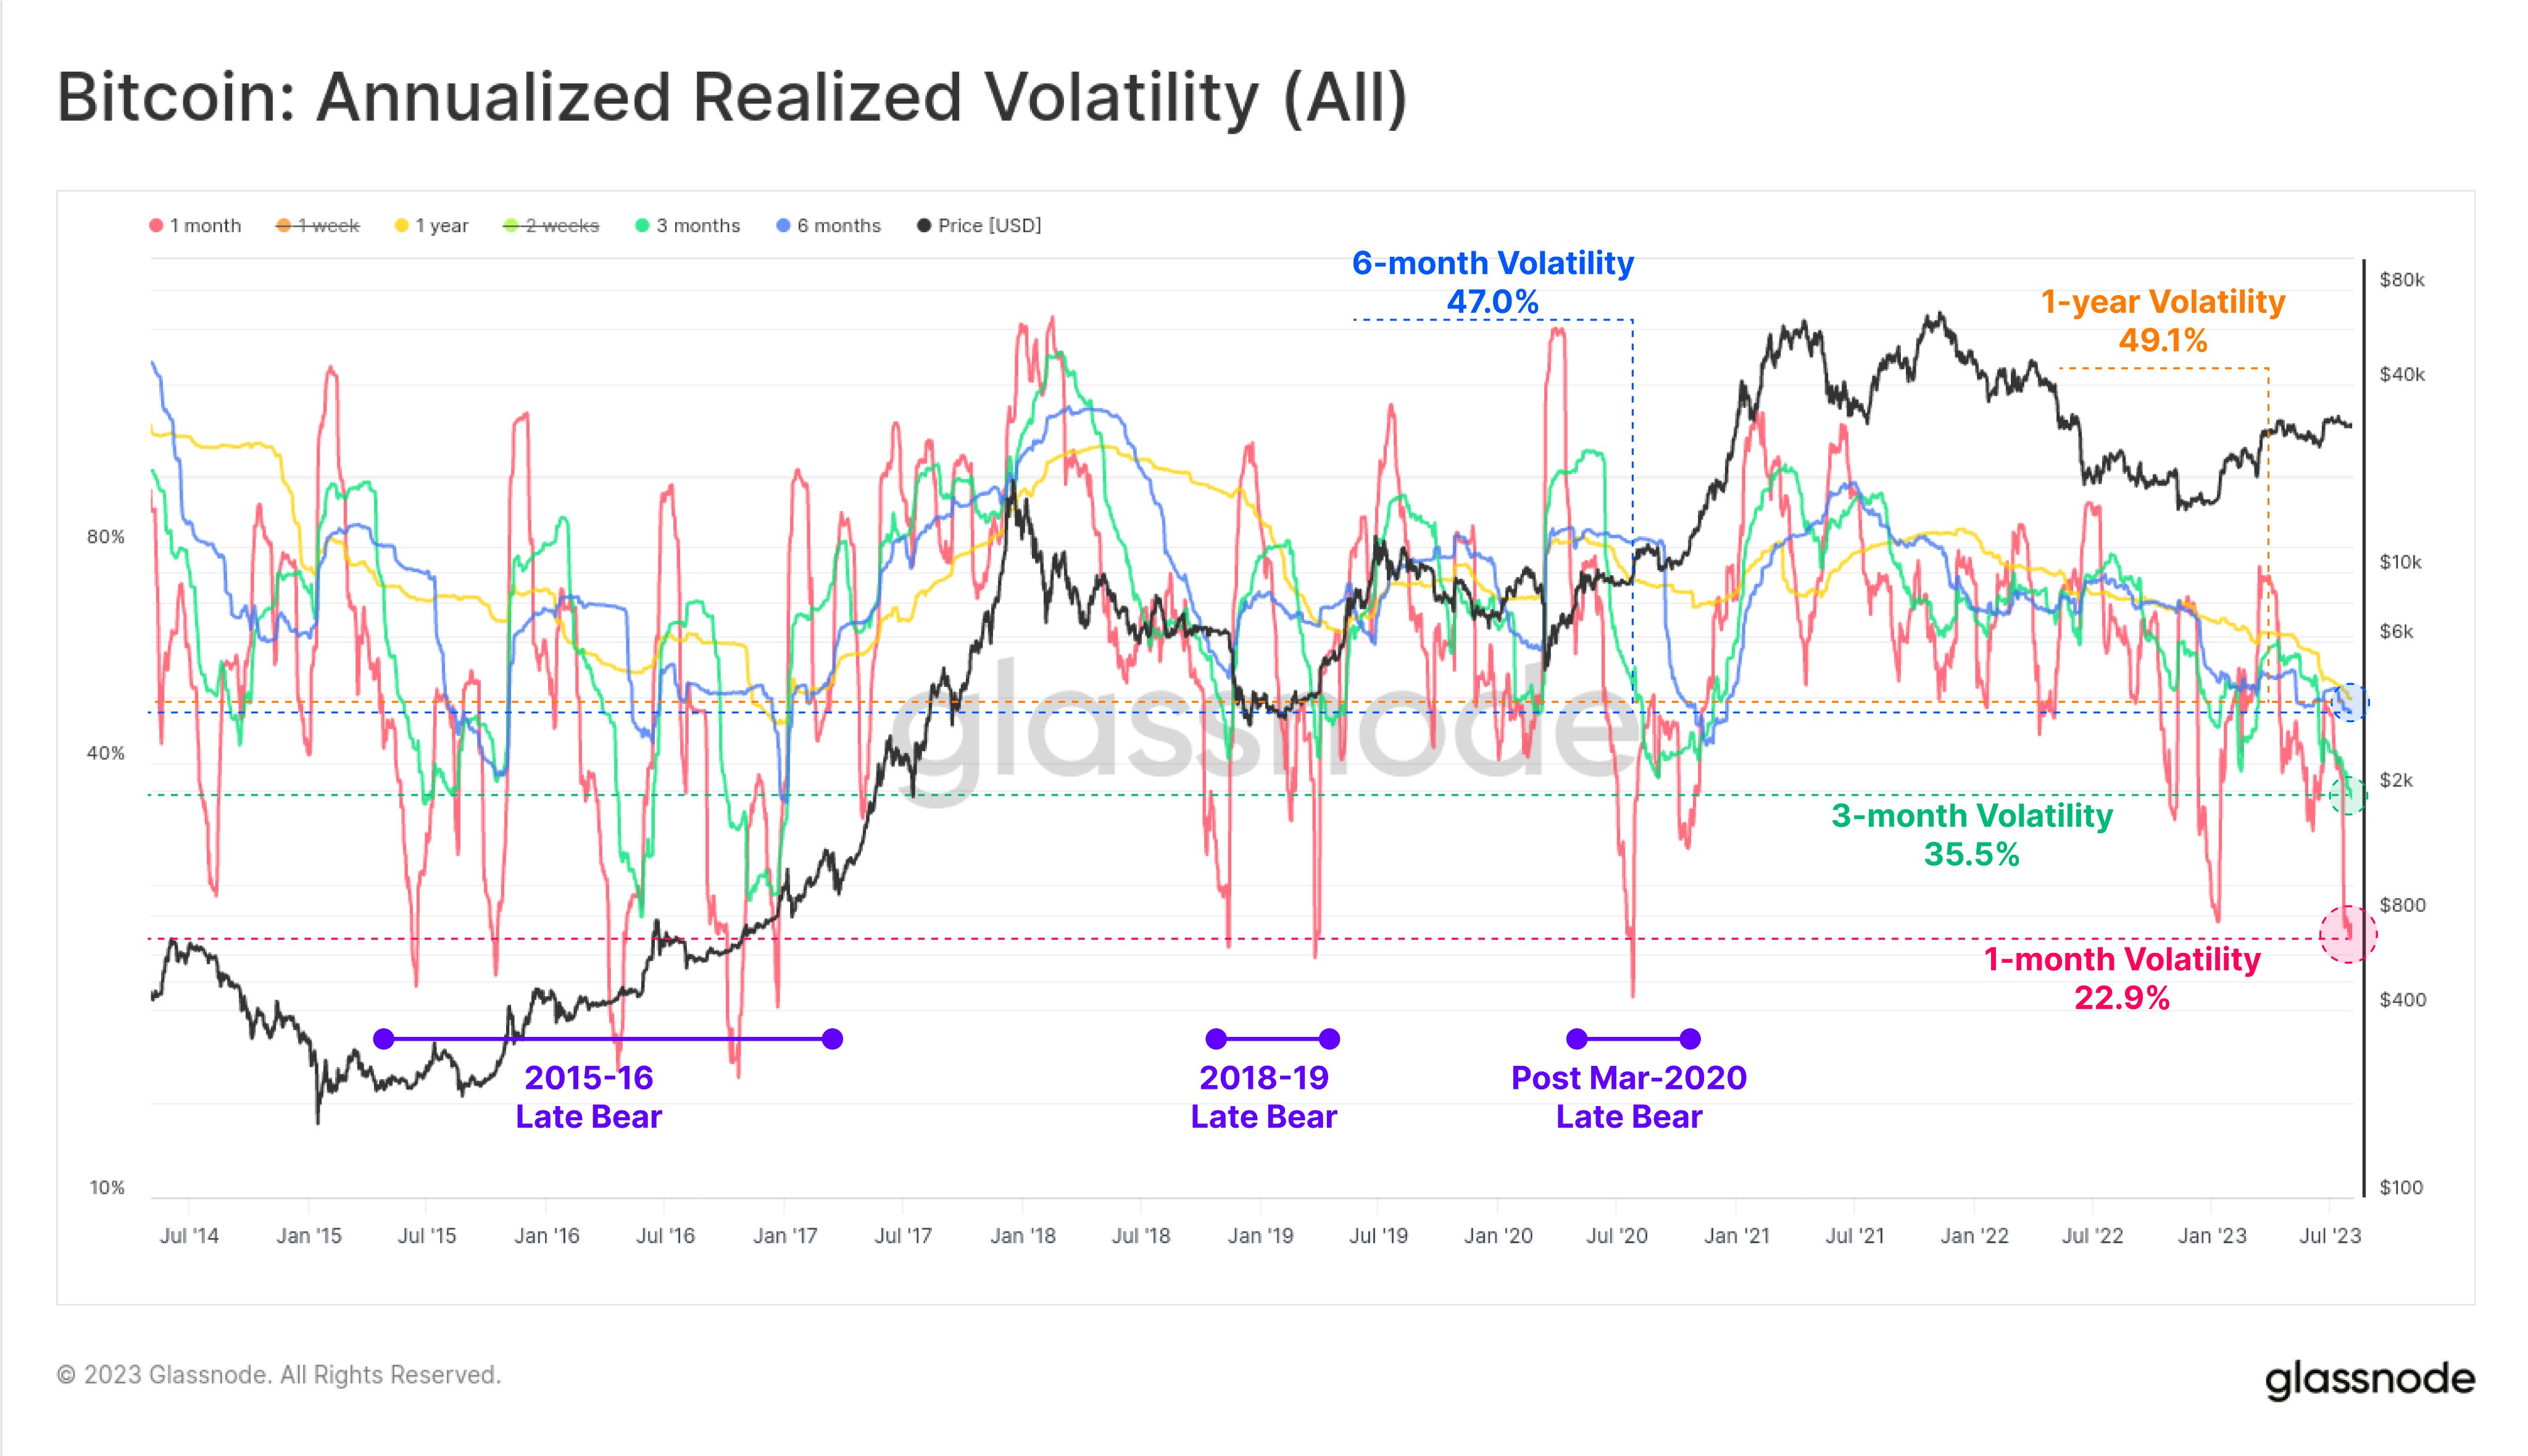
Much has been said in recent weeks regarding how uncharacteristically calm Bitcoin has been. On weekly timeframes, volatility measures are at their lowest ever.

Unfortunately, despite the record-setting lull, directionless sideways price action could continue for a lot longer.

Record-Breaking Low Volatility State Could Continue Longer

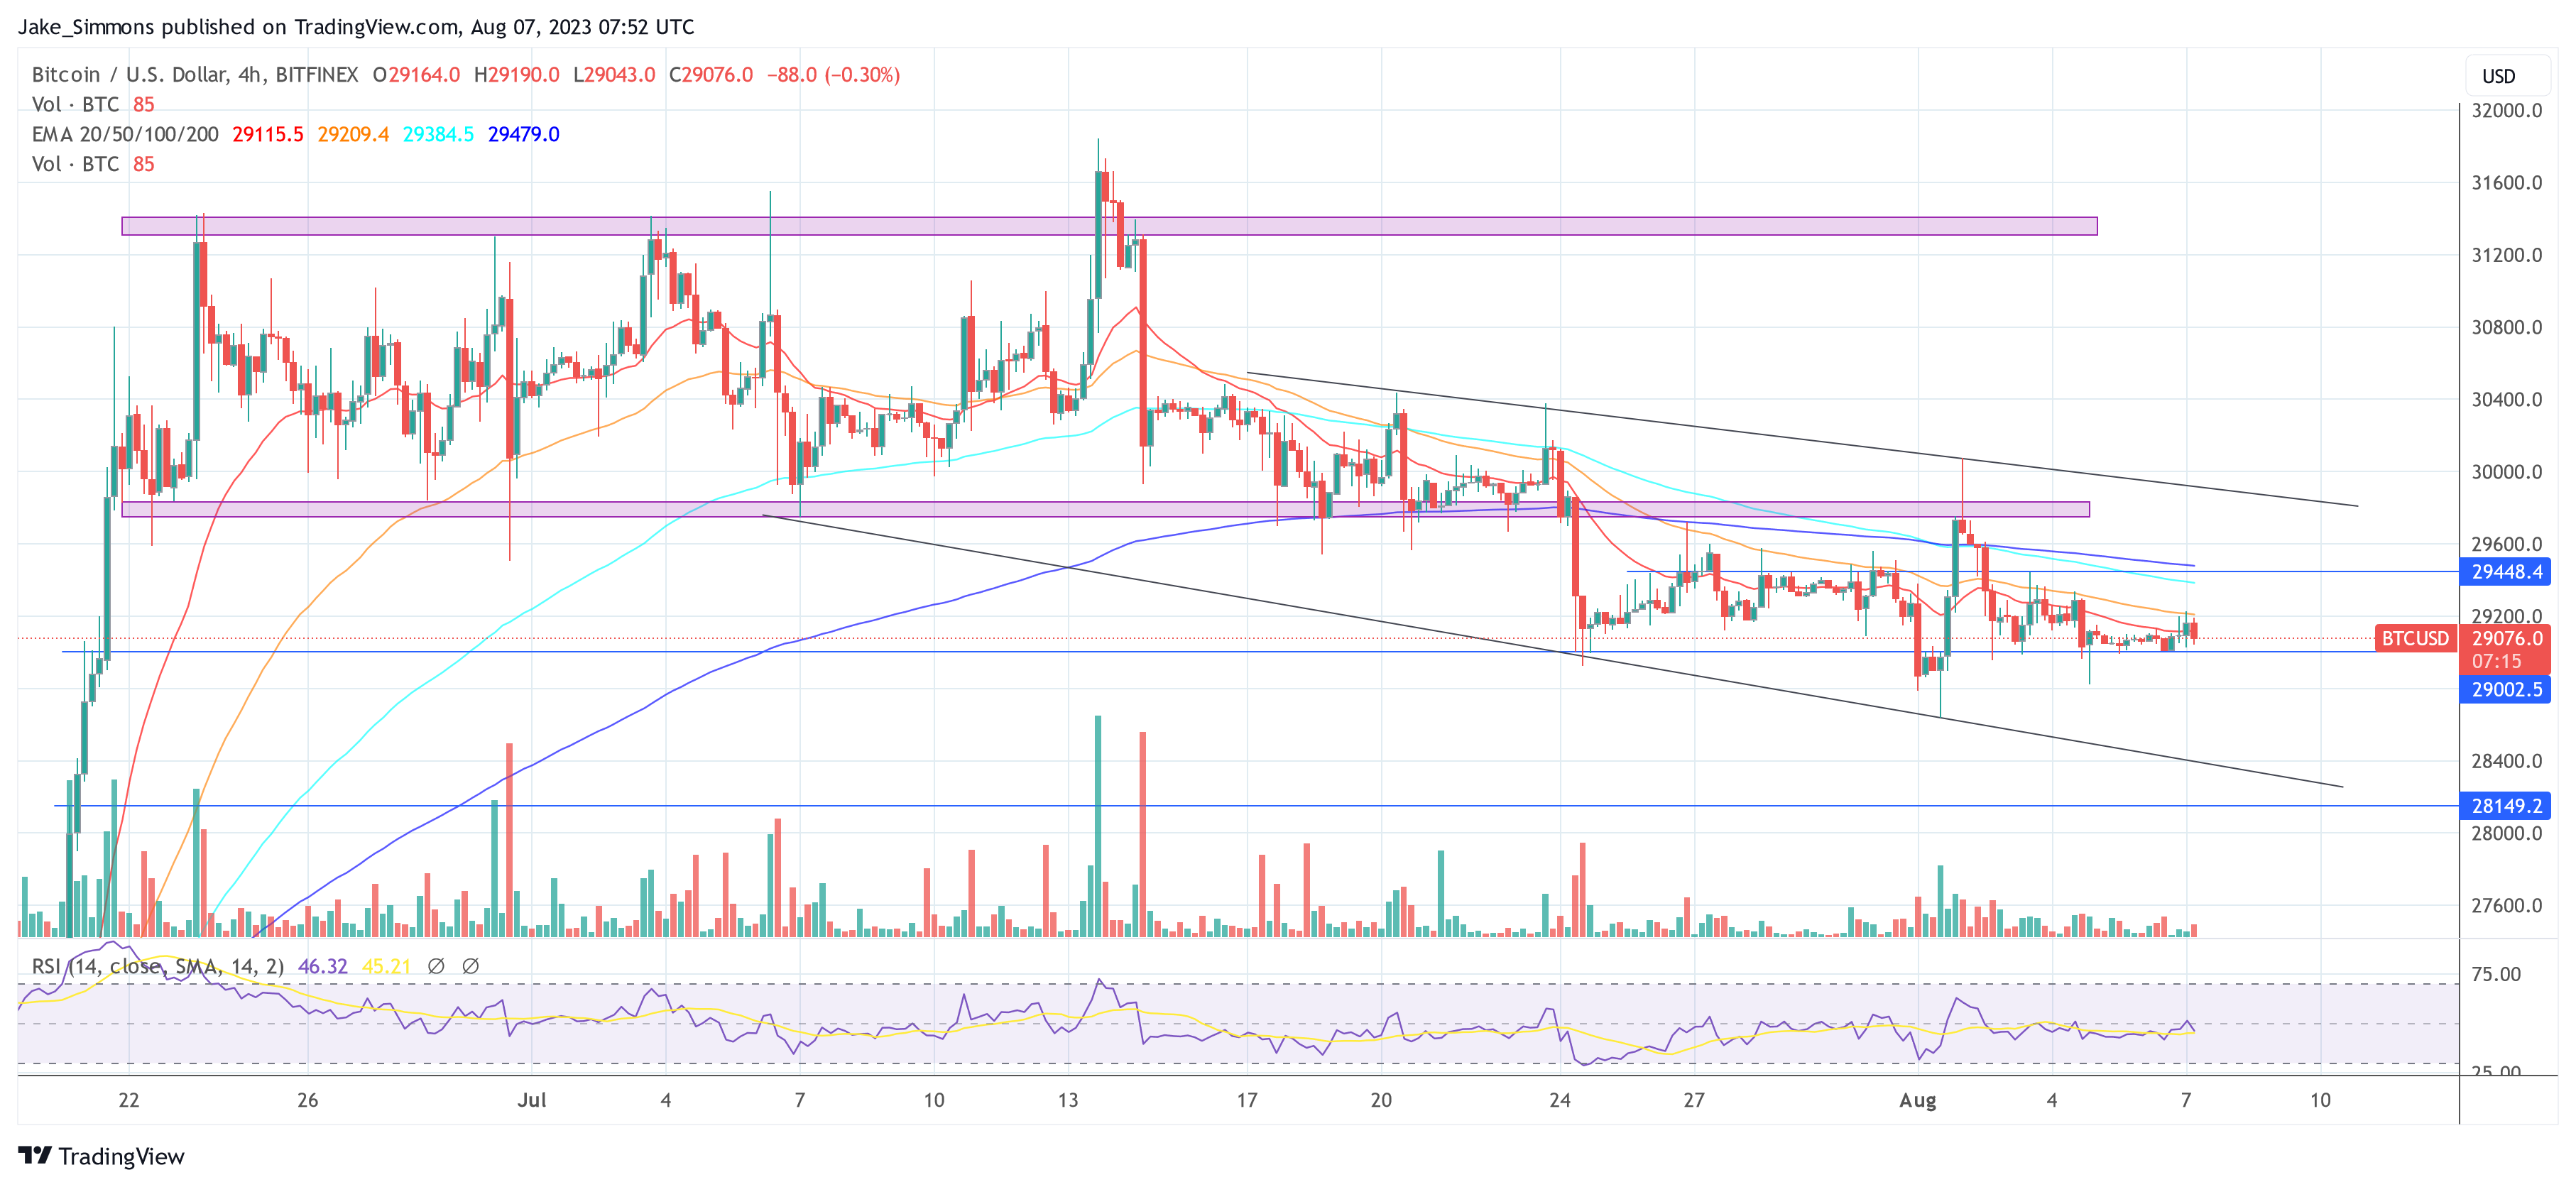
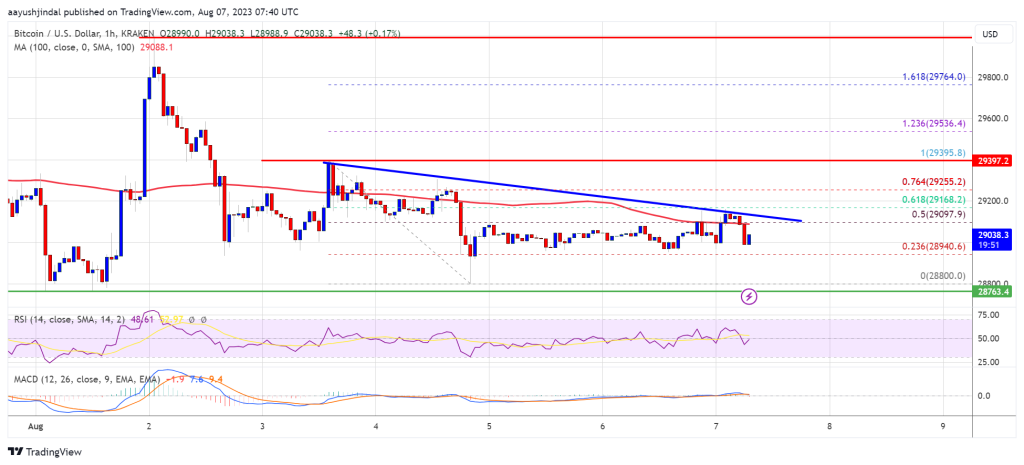
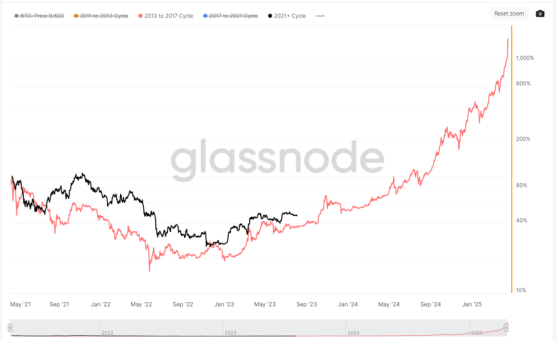
Bitcoin price is at a standstill compared to its usually explosive self. It’s remained locked in a tight trading range, to the point where even a $300 move to either side might feel like a major breakout.

Few points throughout history on lower timeframes have ever been this quiet. This is according to the weekly Bollinger Bands and Bollinger Band Width readings.

Extreme tightening in the Bollinger Bands suggests what’s a called a Squeeze setup — a situation where following a low volatility phase of narrowing, the bands then expand and release a wave of volatility. It could be a lot longer until that happens, however.

Bitcoin low volatility

Examining Monthly Bollinger Band Width

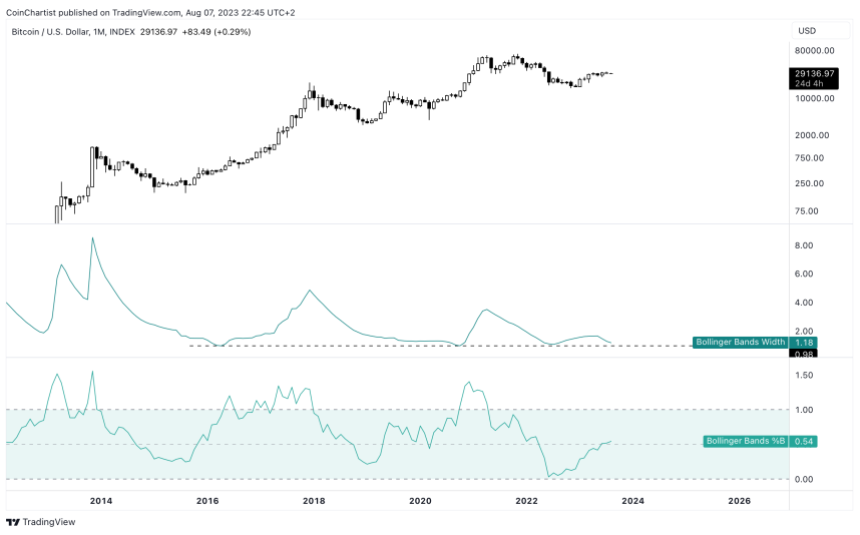
While the weekly is at record tightness, using the very same tool on the monthly timeframe, shows that that there could be a lot further to go.

The Bollinger Band Width isn’t as low as it has been prior to past bull runs — notably to the lows of early 2016 and late 2020. This could suggest the possibility of months more sideways before a meaningful breakout to new all-time highs or a collapse back to lows.

None of this says much about direction thus far, but %B might hint at a move to the upside. The tool is plotted depending on price’s percentage relation to the upper, middle, and lower Bollinger Bands. As long as %B remains above 0.5 it means price is above the Bollinger Band basis — which is a 20-month simple moving average

Although we don’t know which direction Bitcoin ultimately moves, we do know that one thing is for certain: volatility will return in a major way. It’s just a matter of when, and how long we have to wait.

These Bitcoin Metrics Are At Important Retests, Will Bullish Trend Prevail?

On-chain data shows two Bitcoin indicators are currently retesting levels that have historically been relevant for the market’s course.

Bitcoin NUPL For Both Short-Term & Mid-Term Holders Is Neutral Currently

As pointed out by an analyst in a CryptoQuant post, the BTC NUPL has been retesting crucial levels recently. The “Net Unrealized Profit/Loss” (NUPL) is a metric that keeps track of the net amount of profit or loss that investors are holding currently.

This indicator works by looking through the on-chain history of each coin in circulation to see what price it was last moved at. If this previous transfer price for any coin was less than the current spot price of Bitcoin, then that particular coin is holding a profit right now.

The NUPL counts this profit that the coin is holding in the unrealized profit. Similarly, the loss that underwater coins are holding gets included in the unrealized loss. The metric then takes the difference between these two numbers to find the net profit/loss status of the entire market.

In the context of the current discussion, the entire market isn’t of interest, however, only specific sections of it are. In particular, two BTC cohorts called the “short-term holders” (STHs) and the “mid-term holders” (MTHs) are of relevance.

The STHs include all investors who bought their coins within the last six months, while the MTHs are those who have been holding their coins since at least six months ago and at most 2 years ago.

First, here is a chart that shows the trend in the Bitcoin NUPL specifically for the STHs:

Bitcoin NUPL

As displayed in the above graph, the Bitcoin STH NUPL has been positive throughout this rally that first started back in January of this year. Generally, this is the case in bullish trends, as the STHs are those who bought relatively recently, so any price rises immediately reflect on their profit/loss status.

What’s more significant, however, is the indicator’s relationship with the zero mark. At this line, the STHs as a whole are neutral, meaning that their unrealized losses equal their unrealized profits.

Usually, whenever the metric retests this line from above during bullish trends, it finds support and the price feels a bullish effect. This could be seen working in action during this rally alone, as the rebounds in March and June both occurred when the STH NUPL approached this line.

From the chart, it’s visible that the metric has once again fallen to this line recently. This retest may be quite important, as a plunge below could mean a reversal back toward a bearish regime.

In the below graph, it’s also visible that the MTH NUPL is retesting the same line, although this indicator is approaching it from the negative zone.

Bitcoin MTH NUPL

The MTHs had been sitting in losses until now, but they are on the verge of transitioning back into profits currently. If the metric can manage to break through the level, then it would be a positive sign for the rally, as the bullish trend has historically continued whenever these investors have come back above water.

The break-even line providing resistance to Bitcoin, however, is also a possibility, in which case the asset would feel a bearish effect. It now remains to be seen how this retest, as well as the one of the STH NUPL, would pan out in the coming days.

BTC Price

At the time of writing, Bitcoin is trading around $29,000, down 1% in the last week.

Bitcoin Price Chart

Solana Products See Strong Inflows, Bitcoin And Crypto Lose $107 Million

The past week has painted a vivid picture of shifting investor sentiment worldwide. While Bitcoin and the broader cryptocurrency market witnessed a significant outflow of funds from investment products like ETPs, ETFs and funds, Solana (SOL) emerged as a beacon of hope for altcoin enthusiasts.

A Dive Into The Numbers By Crypto Products

Digital asset investment products experienced a net outflow of $107 million this week, a figure that underscores the growing trend of profit-taking that has been evident in recent weeks. “Digital asset investment products saw outflows this week, totalling $107m with profit taking gathering pace in recent weeks,” James Butterfill noted in his recent report published in CoinShares’ blog.

Weekly Asset Flows

Bitcoin, the de facto king of cryptocurrencies, bore the brunt of these outflows, seeing a staggering $111.4 million leave its coffers. This marks the “largest weekly outflows since March,” a time when US regulatory scrutiny began to intensify. Interestingly, for the first time in 14 weeks, the outflows into short bitcoin positions have also come to a halt.

Ethereum wasn’t spared either. The second-largest cryptocurrency by market capitalization saw outflows totalling $5.9 million, bringing the combined outflows for both Bitcoin and Ethereum to $117.3 million in just the past week.

Solana Is The Rising Star

Amidst this backdrop of outflows, Solana stood out, not just for its resilience, but for its impressive inflows. The altcoin witnessed the “largest inflows, totaling $9.5m, the largest single week of inflows since March 2022.” This surge in interest has propelled Solana’s Assets Under Management (AUM) to $89 million. With month-to-date inflows equalling $9.5 million and year-to-date inflows at $25 million, Solana is clearly on an upward trajectory.

To put this in perspective, Bitcoin has the largest AUM with $24,136 million, followed by Ethereum with $7,820 million and multi-asset investment products with $3,060 million. Litecoin ($134 million) and Bitcoin Short ($104) also have bigger AUM than Solana. However, Solana’s AUM has now surpassed that of established altcoins like XRP ($74 million), Cardano ($28 million), and Polygon ($24 million).

While Solana basked in the limelight, other altcoins had a mixed week. XRP and Litecoin registered modest inflows of $0.5 million and $0.46 million respectively. However, Uniswap and Cardano weren’t as fortunate, witnessing outflows of $0.8 million and $0.3 million respectively.

Flows by crypto asset

Regionally, the outflows were predominantly concentrated among two ETP providers in Germany and Canada, which saw outflows of $71 million and $29 million respectively.

SOL Price Analysis

At press time, the Solana (SOL) price was trading at $23.05, above the 200-day EMA. If SOL manages to defend the 200-day EMA in the following days and confirm the breakout from the descending triangle, the chart looks very bullish. The next resistance level can be expected at the 50% Fibonacci retracement level ($24.00), before another move to the 61.8% Fibonacci level at $27.44 seems possible.

Solana SOL price

Behind The Quiet: Low Bitcoin Volatility Masks Underlying Market Dynamics

In the world of Bitcoin, silence is not always golden. The recent weeks have seen Bitcoin’s price volatility drop to historical lows, with the BTC price trading mostly between $29,000 and $30,000. However, beneath this placid surface, a number of intriguing market dynamics are at play.

“Realized volatility for Bitcoin has collapsed to historical lows. Across 1-month to 1yr timeframes, this is the quietest we have seen the corn since after March 2020. Historically, such low volatility aligns with the post-bear-market hangover periods (re-accumulation phase),” stated Checkmate, lead on-chain analyst at Glassnode.

Bitcoin volatility

The chart shared by Checkmate shows that annualized realized volatility resembles the post-bear era for Bitcoin from March 2020 when volatility was at 47%. Currently, 1-year volatility sits at 49.1%, 3-month volatility at 35.5%, and 1-month volatility at 22.9%.

Quit Before The Storm For Bitcoin

However, the low volatility is not the only story. Checkmate also highlighted a new all-time high for Bitcoin’s long-term holder supply, now at 14.59M BTC, which accounts for 75% of the circulating supply. This shows that an increasingly high number of Bitcoin investors are convinced of a future rally, leading to a supply shortage, while high risk traders are washed out of the market due to lacking volatility.

Simultaneously, there’s a surge in institutional positioning; volume and open interest of the CME Bitcoin futures have reached a 20-month high in July. Despite the Bitcoin spot markets recording low volumes, the CME futures saw the highest volume since January 2022, with $55.8 billion in July.

Volume and OI of CME Bitcoin futures

The CTFC data reveals a fascinating slugfest between two investor groups. Asset managers are $1.2 billion net long, while hedge funds are net short by -$980 million. This standoff suggests an imminent breakout in Bitcoin’s price, potentially leaving one of these groups with burnt fingers.

On-chain analyst Ali Martinez provided further insight: “Even as Bitcoin dropped from $32,000 to $29,000, the number of new BTC addresses steadily rose! This bullish divergence between price and network growth hints at a stable long-term BTC uptrend. Buy the dip!”

Indeed, the current low volatility phase is not without precedent or predictive power. Renowned analyst @CryptoCon provides a compelling perspective on this, stating that such periods of sideways price action are not only normal but potentially bullish.

“Bitcoin sideways price action at this point in the cycle is completely normal! The 2 Week Mass Index crosses into the golden pocket at the most stagnant cycle points, just before massive bullish moves. Data everywhere points to the same conclusion: Low volatility is bullish,” CryptoCon tweeted.

Bitcoin golden pocket

Chris Burniske, partner at Placeholder VC, also shared his perspective on the current market dynamics. “Currently, tourists are inactive while residents are accumulating swiftly, owning 74.8% of all supply. That’s consistent with an early-stage bull market. Thirty percent of BTC has left for cold storage since 2020, leaving exchanges with 2.26 million. Bitcoin seems fairly valued relative to the number of active entities on the network.”

Burniske’s simplified price/cycle model projects Bitcoin to reach near $39,000 by the fourth quarter of 2023 and $92,000 (base scenario) by Q4 2025 with entities above 600,000.

In conclusion, the current low volatility phase of Bitcoin may seem uneventful on the surface, but the underlying market dynamics suggest a different story. The tug-of-war between asset managers and hedge funds, the steady rise in new BTC addresses, and the swift accumulation by long-term holders all hint at a brewing storm.

At press time, the Bitcoin price was at $29,076.

Bitcoin price

Bitcoin Price Relatively Muted, Risk of More Downsides Still Exist

Bitcoin price is struggling to climb above $29,500. BTC remains at risk of more downsides if there is a close below the $28,800 support.

  • Bitcoin is still struggling to gain pace above the $29,500 pivot level.
  • The price is trading below $29,200 and the 100 hourly Simple moving average.
  • There is a key bearish trend line forming with resistance near $29,100 on the hourly chart of the BTC/USD pair (data feed from Kraken).
  • The pair could attempt a fresh increase toward the $29,500 resistance zone.

Bitcoin Price Stuck In Tiny Range

Bitcoin price struggled to clear the $29,500 resistance zone. BTC started a fresh decline within the range and traded below the $29,250 level.

There was a close below $29,250 and the 100 hourly Simple moving average. However, the bulls protected the range support at $28,800. The price traded as low as $28,800 and recently started a short-term upside correction.

There was a move above the 23.6% Fib retracement level of the downward move from the $29,395 swing high to the $28,800 low. However, the bears were active near the $29,200 resistance zone. There is also a key bearish trend line forming with resistance near $29,100 on the hourly chart of the BTC/USD pair.

Bitcoin price is trading below $29,200 and the 100 hourly Simple moving average. Immediate resistance is near the $29,100 zone, the trend line, and the 100 hourly Simple moving average. It is close to the 50% Fib retracement level of the downward move from the $29,395 swing high to the $28,800 low.

Bitcoin Price

Source: BTCUSD on TradingView.com

The first major resistance is near the $29,400 level. The next major resistance is near the $29,500 level, above which the price might rise toward the $29,750 resistance zone. A close above the $29,750 resistance zone could start a decent increase. In the stated case, the price may even surpass the $30,000 resistance.

More Losses In BTC?

If Bitcoin fails to clear the $29,100 resistance, it could start a fresh decline. Immediate support on the downside is near the $29,000 level.

The next major support is near the $28,800 level, below which the price could accelerate lower. The next support is near the $28,400 level. Any more losses might call for a move toward the $28,000 level in the near term.

Technical indicators:

Hourly MACD – The MACD is now gaining pace in the bearish zone.

Hourly RSI (Relative Strength Index) – The RSI for BTC/USD is now below the 50 level.

Major Support Levels – $29,000, followed by $28,800.

Major Resistance Levels – $29,100, $29,400, and $29,500.

Crypto Funds Vs Bitcoin Holders: Who Was The Better Performer In H1 2023

A new report has shown investors who held Bitcoin actually outperformed most cryptocurrency funds in the first half of 2023. This is because, between January and June, Bitcoin gained over 80% in value. 

Crypto funds, on the other hand, on the other hand, returned only about 15.2% profits on average. While still a positive return, it lagged far behind what regular Bitcoin investors made by just buying and sitting tight. 

21e6 Capital’s Crypto Fund Performance in H1 2023

According to a recently released report from Switzerland-based investment adviser 21e6 Capital AG, Bitcoin traders outperformed most crypto funds by 68.8% in H1.

This is not surprising, as BTC was one of the best-performing crypto assets in the first half of 2023, seeing massive gains from prospects of the SEC approving a Spot Bitcoin ETF. The price of Bitcoin started the year around $15,500 and climbed to over $31,400 in July.

Bitcoin outperforming crypto funds is relatively new, as crypto hedge funds are frequently able to outperform the BTC benchmark in the past significantly. But the crypto industry ended 2022 with more of a gloomy sentiment, as the market witnessed regulatory uncertainties and the collapse of FTX and Terra. 

This seems to have caused crypto hedge funds to take a safer approach, leaving them with larger-than-normal cash positions. When crypto is hot, that cash doesn’t appreciate like BTC would unless the funds’ assets perform significantly better than Bitcoin.

The report also noted that directional crypto funds generally outperformed non-directional crypto funds. Non-directional funds, like arbitrage, lending, and staking, do not depend on the market’s direction.

Bitcoin (BTC) price chart from Tradingview.com

Outlook for Second Half of 2023: More Gains Ahead for Bitcoin?

21e6 Capital’s latest report shows the general sentiment of the crypto market. Crypto funds had a rough first half of 2023, with many closing down early this year. About 13% of crypto hedge funds shut this year, as a few of them have struggled to present a favorable value proposition to potential investors.

The price of Bitcoin seems to be struggling to break over $30,000, but the outlook for Bitcoin in the second half of 2023 still looks positive. If approved, the price of Bitcoin is expected to spike further in the coming months as major investment companies start to offer Spot Bitcoin ETFs.

This influx of capital could spark a fresh bull market for all cryptocurrencies, leading to further gains for BTC holders. This new volume could see the price of BTC rise above $30,000 once more.

At the time of writing, BTC is trading at $29,043.

Crypto Analyst Points To Bitcoin Price History Repeating Itself – Are The Signs Bullish?

The general crypto market has recorded a slight decline in the last week, with the market leader Bitcoin losing 0.78% of its value over the last seven days.  

This price loss amplifies BTC’s negative monthly performance, pushing its total loss in the last 30 days to around 5.38%, according to data from CoinMarketCap.

At the time of writing, the premier cryptocurrency is trading at around $29,022, with its daily trading volume valued at $10.746 billion, having gone down 12.54%. 

However, amidst Bitcoin’s current downtrend, it appears the token’s larger performance could be indicating a bullish market in the coming months.

Bitcoin Could Be Repeating Historic Bullish Price Cycle – What Does This Mean? 

On Aug. 4, crypto analyst Ali Martinez on social media platform X posted that Bitcoin is likely repeating a popular bullish cycle of its price history.  

According to Ali, the token current’s price trajectory since attaining its all-time high in November 2021 is identical to its price movement between 2013 and 2017 based on data from Glassnode.

 bitcoin

If this analysis proves correct, with Bitcoin mirroring its 2013-2017 price cycle, it means Bitcoin is expected to show little price movement in August 2023 and September 2023, perhaps recording some slight gains along the way. 

However, Glassnode data shows BTC could experience a price upswing in October 2023, maintaining a bullish momentum all through this month. Thereafter, the token is expected to undergo a major re-correction finding support in the first week of November 2023. 

Based on the reference price cycle, Bitcoin could then experience a significant price drop in the last month of 2023 but close the year in a strong consolidation zone.

Beyond 2023, the BTC market could also be set for huge profits in 2024 and 2025 if Bitcoin is indeed repeating the 2013-2017 price cycle during which the market leader famously gained by over 1600%.

However, all investors are reminded that predictions are not guaranteed and should not be considered as investment advice. 

Rising Optimism In The BTC Market

In other news, it appears there is a rising positive sentiment around Bitcoin, with a significant increase in its accumulation by key holders. According to a report by on-chain analytics firm Santiment, BTC whales and sharks are currently swapping their BUSD and DAI for more BTC. 

Santiment noted the situation was quite the opposite back in July, with the BTC heavyweights shedding some of their holdings. However, the analytics firm reports that if the current trend is maintained, we could see BTC trade above $30,000 again. 

Related Reading: Bitcoin NVT Shows Bearish Crossover, Price Drop Incoming?

In the last few weeks, Bitcoin has remained among the headlines, with much discussion on the ongoing Bitcoin ETF race in the US.  On Aug. 2, Bloomberg ETF analysts James Seyffart and Eric Balchunas rated the approval chances of the first spot Bitcoin ETF at 65%. This is an impressive upgrade from 50% some weeks ago and 1% a couple months ago. 

BitcoinBTC trading at $28,979 on the weekly chart | Source: BTCUSD chart on Tradingview.com

Tether May Now Be 11th Largest Bitcoin Holder, Analyst Says

Tether, the company behind the USDT stablecoin, may now be the 11th largest bitcoin holder in the world. This comes after the stablecoin issuer recently published its attestation report for Q2 2023.

According to the report, Tether recorded an increase in excess reserves, which grew by $850 million. This brought the company’s total excess reserves to approximately $3.3 billion.

These excess reserves are profits that the company does not distribute to shareholders as dividends. Instead, Tether keeps them to shore up its 100% reserves, which are used to back all USDT in circulation and keep the token stable.

Tether Holds $1.6 Billion Worth Of BTC In Single Wallet?

In the last quarter, Tether published that it held more than $1.5 billion worth of BTC (about 53,495 BTC) in its reserves. Based on the latest quarterly report, this figure has grown by more than $176 million, bringing the company’s Bitcoin holdings to roughly $1.676 billion (around 55,022 BTC).

Tom Wan, a research analyst at 21.co, found in the last quarter that Tether may be holding all their Bitcoin in one wallet, making them the 12th largest BTC holder at the time. Fast forward to Q2 2023, it appears that the analyst has confirmed his initial speculations.

In the first quarter, the BTC holdings of Tether’s “possible” wallet address matched the BTC amount published in the company’s attestation report. The BTC balance of this address has also increased in the second quarter, corresponding with the amount provided in Tether’s Q2 report.

The analyst noted that only one Bitcoin address matches the figures of Tether’s BTC reserves. And this address, which may belong to the stablecoin issuer, is now the 11th largest Bitcoin holder in the world.

While Wan sought Tether and the company’s CTO Paolo Ardoino to corroborate his findings, there has been no official confirmation from the stablecoin issuer.

Tether’s BTC Holdings Consistent With Initial Plans

This significant amount of BTC Tether holds in its reserves comes as no surprise, especially as the firm has always been clear about its Bitcoin investment intentions. In May, the stablecoin issuer announced plans to invest 15% of its future profit in Bitcoin.

Tether’s CTO Paolo Ardoino, a vocal supporter of Bitcoin, stated that the cryptocurrency’s resilience is the reason for the company’s continuous investment in the asset. 

Ardoino said: 

The decision to invest in Bitcoin, the world’s first and largest cryptocurrency, is underpinned by its strength and potential as an investment asset. Bitcoin has continually proven its resilience and has emerged as a long-term store of value with substantial growth potential. Its limited supply, decentralized nature, and widespread adoption have positioned Bitcoin as a favored choice among institutional and retail investors alike.

However, there have been concerns about Tether and USDT’s exposure to risks due to increased investment in a highly volatile asset such as Bitcoin. 

As of this writing, USDT is the largest stablecoin in the cryptocurrency market, with a market cap of roughly $83.81 billion.

Tether