Analyst Pinpoints $61,500 As Critical Bitcoin Price Level To Monitor

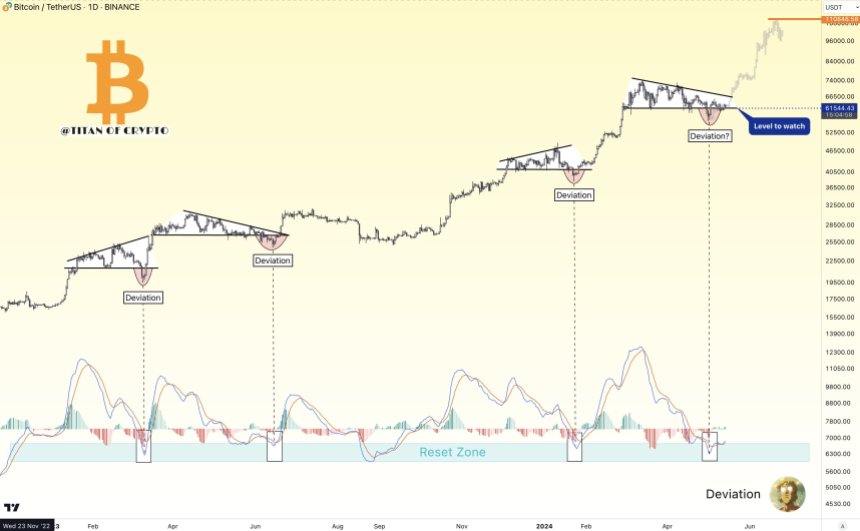
Amidst the recent decline in Bitcoin’s price and the general cryptocurrency market, popular cryptocurrency analyst and enthusiast Titan of Crypto has highlighted the $61,500 price level as a crucial threshold to watch for the largest cryptocurrency.

Titan of Crypto analysis examines the aforementioned level as a pivotal point for Bitcoin that could determine the coin’s next price trajectory.

$61,500, A Level To Watch For Bitcoin

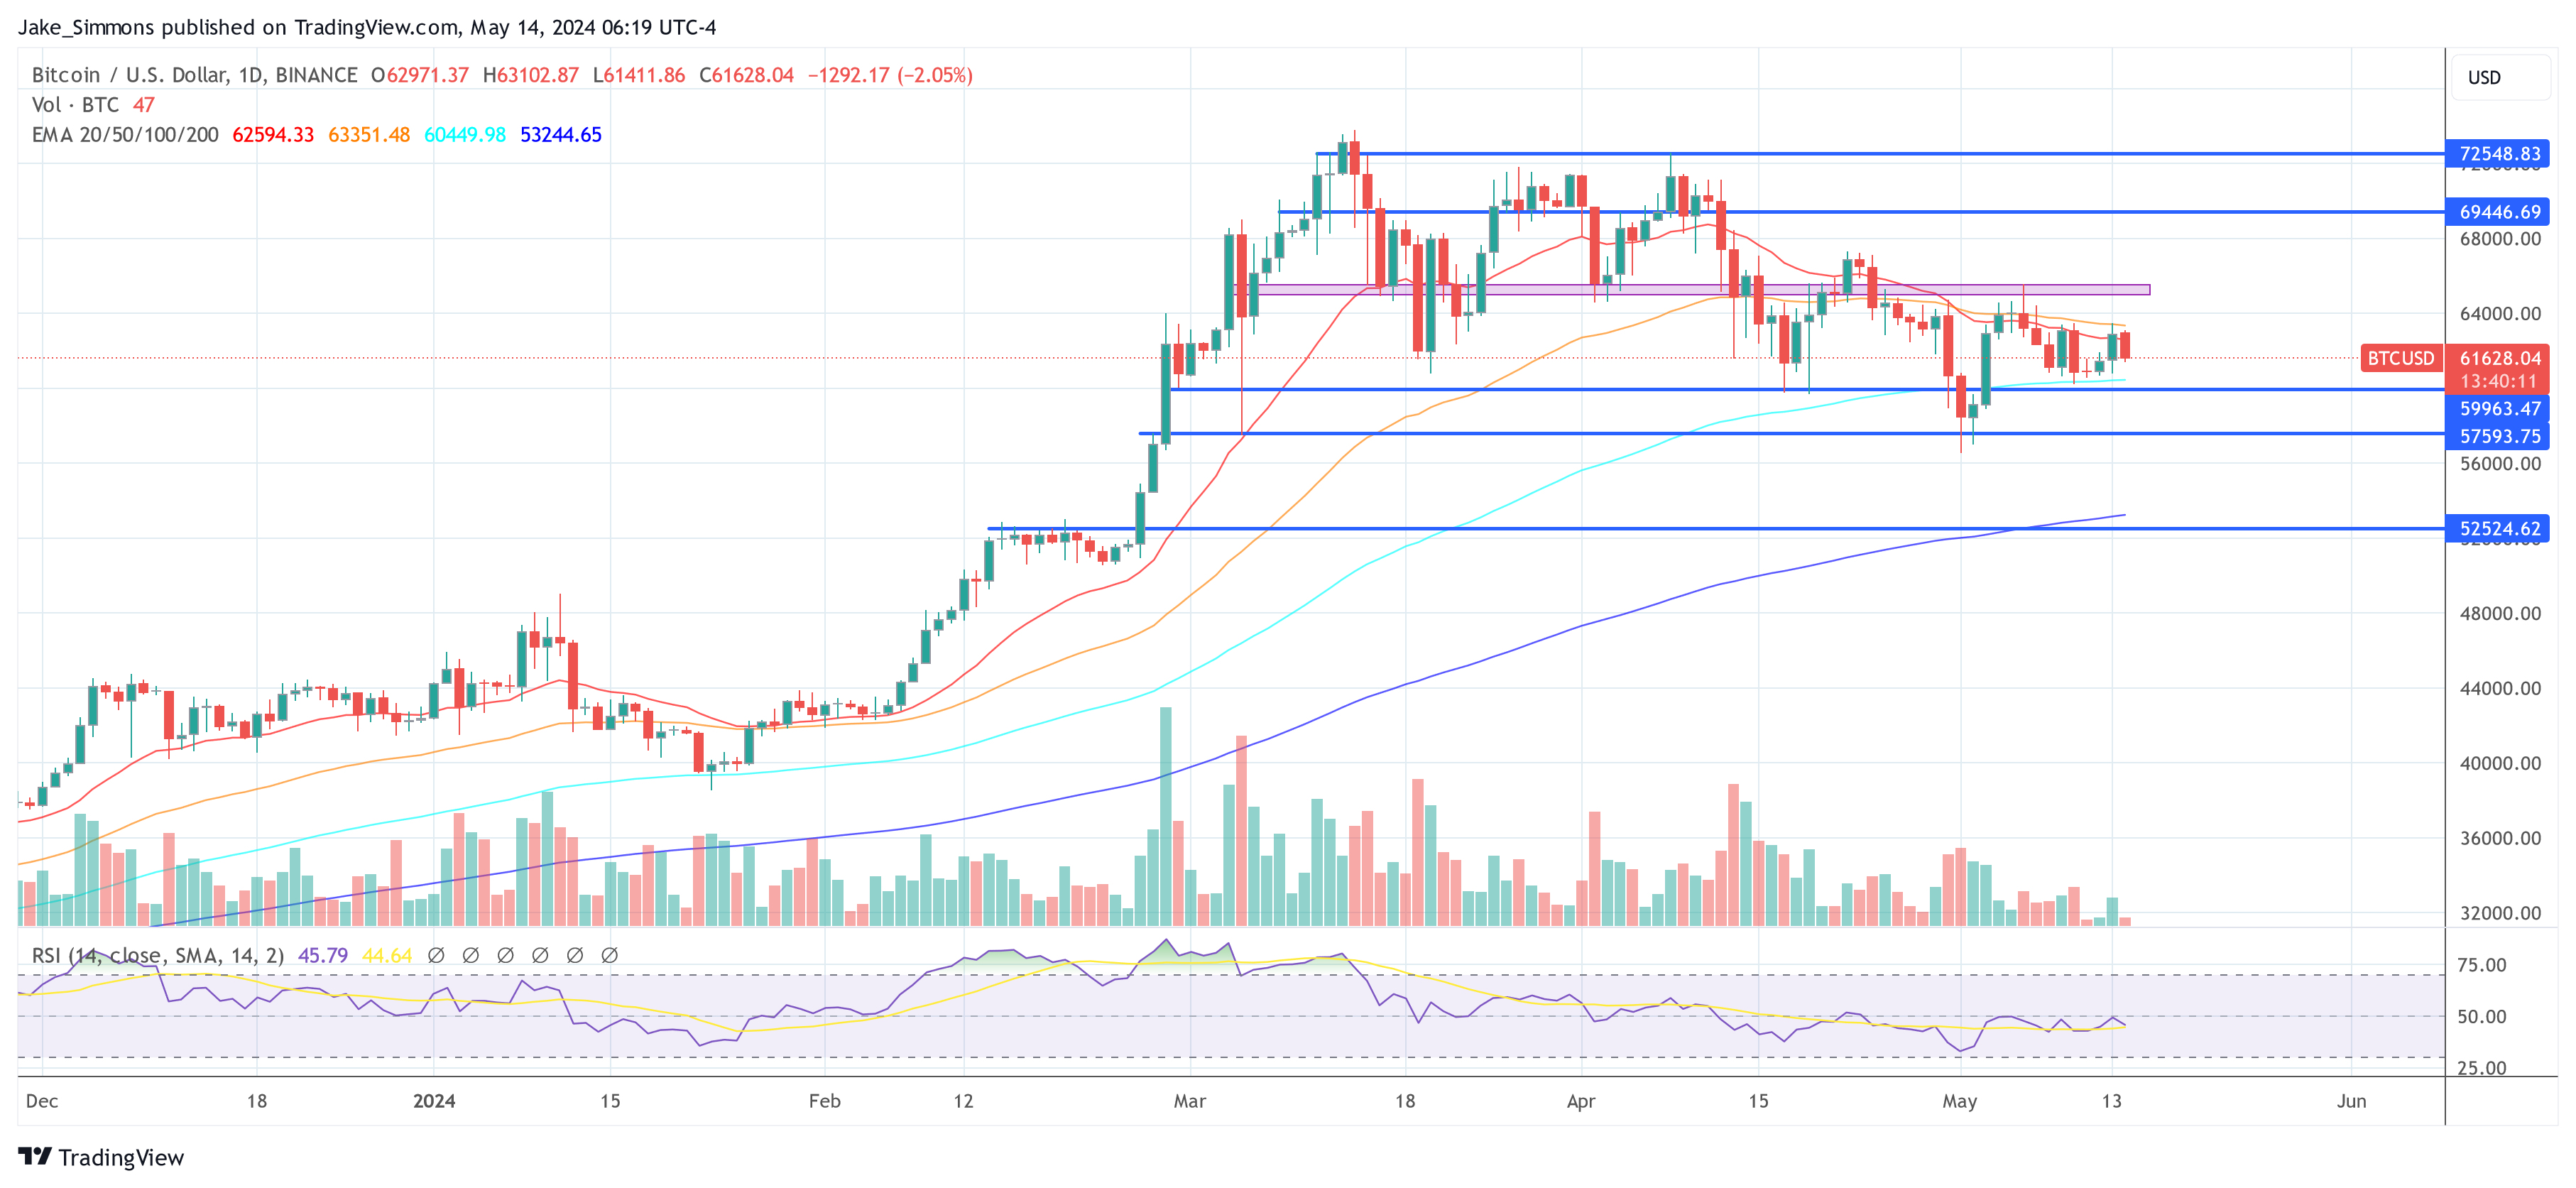
Today, May 14, BTC witnessed a sharp decline to nearly $61,500, demonstrating little momentum for a price recovery. While many would see this as a worrying development, Titan of Crypto considers it a noteworthy development. He sees this level as significant and is one to watch out for for Bitcoin.

Bitcoin

The crypto expert further warns of an impending volatility in the market around Federal Reserve Chair Jerome Powell‘s speech later today. Thus, Titan of Crypto has urged the community to remember that it’s better to hold off on making decisions until after the BTC daily candle closes and until the next one confirms the previous one.

The post read:

Bitcoin $61,500 is the level to watch. Expect volatility in the markets around today’s Powell speech. In any case, remember it’s wiser to wait for the BTC daily candle close and confirmation with the following one before jumping to a conclusion.

Although the expert anticipates volatility for Bitcoin, he is confident that the crypto asset’s bull run is far from over, suggesting a movement on the upside is still possible. 

According to Titan of Crypto, Bitcoin’s Risk-Adjusted Return Oscillator (RAR) indicator has recently moved into the overbought area. However, the analyst asserts that this does not call for alarm, given that Bitcoin took over eight months to peak following the development based on previous bull cycles.

Looking at Bitcoin’s price action from the daily timeframe, the expert confirms that the digital asset is “looking good.” As a result, BTC is following the bullish target to unprecedented heights, specifically around $112,185. “This game is a zero-sum game where impatient people give their money to the patient,” he added.

Possible Retracement To $62,000

While Titan of Crypto anticipates a rally, Ali Martinez, another crypto, has predicted an early price retracement. The expert has highlighted the possibility for BTC to decline to $62,000 in the short term.

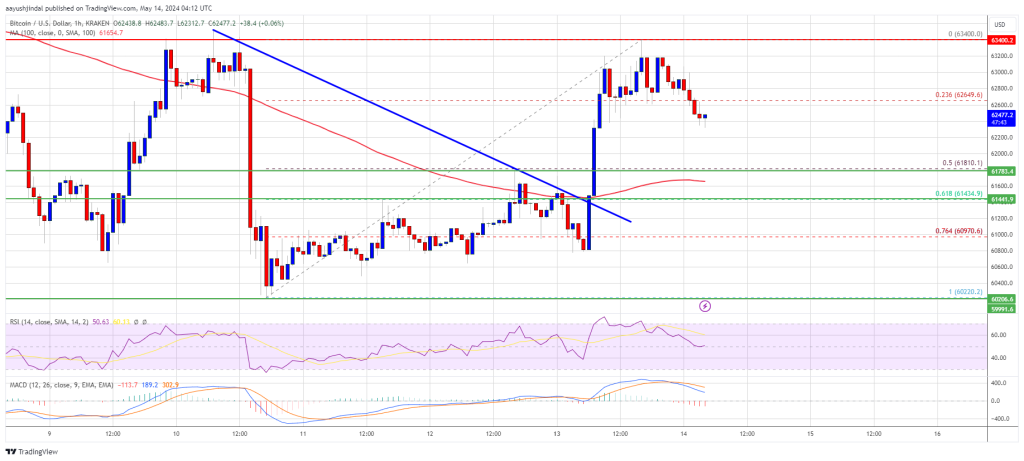
According to the analyst, the 4-hour chart’s 200 Exponential Moving Average (EMA) appears to be rejecting Bitcoin, whereas the TD Sequential indicator suggests a sell signal. Should the development be confirmed, Martinez expects BTC to drop to $62,000. 

However, for BTC to witness an upward movement, it needs to maintain a 4-hour candlestick close above the $64,000 threshold. Thus, with the coin trading below the $62,000 level, Martinez’s prediction appears to have already manifested.

At the time of writing, the coin was trading at $61,512, indicating about 1.98% in the past day. Its trading volume was up by 9.67%, while its market cap was down by 2.65% in the last 24 hours.

Bitcoin

Newbie Bitcoin Whales Buying 200,000 BTC Per Week, Data Shows

On-chain data suggests demand for Bitcoin remains significant as newcomer whales in the sector have been scooping up 200,000 BTC every week.

Short-Term Holder Bitcoin Whales Have Continued To Accumulate Recently

As explained by CryptoQuant author Axel Adler Jr in a post on X, the demand among the short-term holder whales has decreased since the all-time high, although it still continues to remain strong.

The “short-term holders” (STHs) refer to the Bitcoin investors who have been holding onto their coins since less than 155 days ago. This cohort includes the new investors in the market, as well as the fickle-minded traders who make moves often and don’t tend to HODL.

The investors who make it past the 155-day threshold are put inside the “long-term holders” (LTHs), which is a group that’s generally considered to reflect the resolute side of the sector.

In the context of the current discussion, the investors of interest aren’t the ordinary STHs, but rather the humongous entities called whales. Formally, these investors are defined as those holding more than 1,000 BTC in their wallets.

At the current exchange rate, this lower limit is worth $61.5 million, which is massive indeed. Whales can be influential beings on the network because of these large holdings, so their behavior can be something worth keeping an eye on.

The STH whales would naturally correspond to the large holders who only bought within the past five months. Here is a chart that shows the trend in the exchange outflows being made by these new whales in the Bitcoin market over the last few years:

Bitcoin STH Whale

As displayed in the above graph, the 7-day simple moving average (SMA) of the Bitcoin STH whale exchange outflows had spiked to pretty high levels earlier in the year, when the rally towards the new all-time high (ATH) price had taken place.

Naturally, this spike would suggest demand for buying the cryptocurrency was high from new whale investors entering the space. At the peak, the indicator implied accumulation was occurring at the rate of a whopping 452,000 BTC per week.

A part of this buying would correspond to the demand coming in from the spot exchange-traded funds (ETFs) – new investment vehicles for Bitcoin only approved at the start of this year that provide for an indirect way to invest into the asset in a format that may be preferrable for the more traditional investors.

From the chart, it’s visible that the demand from the new whales has seen a clear decline in the period since the ATH, but accumulation nonetheless remains substantial as the STH whales are still potentially buying at a rate of around 200,000 BTC per week.

BTC Price

Bitcoin has continued to be stagnant recently as its price is trading around $61,600 right now, still very much inside the range.

Bitcoin Price Chart

Brace For Impact: Mt. Gox Set To Inject 142,000 BTC And 143,000 Bitcoin Cash Into The Market- Here’s When

Tokyo-based Bitcoin exchange, Mt. Gox is preparing to release a substantial amount of Bitcoin (BTC) into the market, signaling the upcoming disbursement of payments to creditors who had been affected by its hack attack in 2011.  

Mt. Gox Set To Release 142,000 Bitcoin Into Market

Reports from Reddit reveal that the Kraken Bitcoin (BTC) and Bitcoin Cash (BCH) API interface have signaled that Mt. Gox is getting ready to release its substantial cryptocurrency and fiat holdings, which include 142,000 BTC and 143,000 BCH, and 69 billion yen. 

As of May 13, the interface began reading “payment in preparation,” indicating that funds would soon be distributed to creditors. The date for the anticipated disbursement has also been slated for October 31, 2024. 

This decision comes after years of undergoing legal proceedings and negotiations aimed at reimbursing creditors who lost funds following the Bitcoin exchange’s crash. Earlier in 2011, Mt. Gox was hacked, resulting in the loss of 850,000 BTC now worth over $51 billion. Shortly after the unfortunate attack, Mt. Gox filed for bankruptcy and has since been gathering funds to compensate creditors. 

Reports from a few customers have revealed that the exchange has begun distributing funds in fiat currency. One particular Reddit user disclosed earlier in April, that he had received USD payments into an HSBC currency account with zero fees. 

While the long-awaited distribution process comes as great news to creditors, the release of such a large amount of Bitcoin could have a significant effect on the current Bitcoin market. 

Additionally, discussions about whether creditors would sell or retain their Bitcoin holdings once they receive their funds have been circulating. Nonetheless, the disbursement process presents a step towards closure and recovery for victims of the exchange’s hack and bankruptcy. 

Will Creditors Sell Or Hold?

With the Bitcoin market presently in a fragile position after experiencing a series of declines following the halving event on April 20, the possibility of a large-scale sell-off could lead to drastic changes in the market, potentially resulting in a crash. 

Commenting on Mt. Gox’s 142,000 BTC distribution plans, a Reddit community member suggested that the exchange’s upcoming repayments could become a catalyst for the next BTC dump in 2024. 

In response, another Reddit user expressed doubt about the likelihood of a widespread sell-off, especially at the beginning of the bull market. The user surmised that investors who have been waiting for Mt. Gox’s payments for over a decade are unlikely to sell off their Bitcoin holdings quickly. 

Instead, he suggested that many creditors, like himself, would be more inclined to HODL their Bitcoin holdings, having acquired a deeper understanding of the pioneer cryptocurrency during the decade-long wait.

Bitcoin price chart from Tradingview.com

CPI Preview: Bitcoin Price Poised To Surge If Projections Hold True

The US Consumer Price Index (CPI) data, set to be released tomorrow, May 15 (Wednesday), at 8:30 am ET, is anticipated to be a potentially significant catalyst for the Bitcoin price. This expectation stems particularly from Bitcoin’s recent trend of responding to macroeconomic news, indicating a heightened sensitivity to such data in influencing its market dynamics.

The CPI measures inflation by tracking changes in the price levels of a market basket of consumer goods and services. The upcoming report is of particular interest following three consecutive months where inflation data exceeded market expectations. Analysts currently project a slight moderation in inflation rates for April, which could have consequential implications for monetary policy and financial markets.

CPI Preview: What To Expect

For April, economists expect the CPI to show a year-on-year increase of 3.4%, a slight deceleration from March’s 3.5%. On a month-to-month basis, the increase is anticipated to slow to 0.3% compared to 0.4% previously.

The core CPI, which strips out the more volatile costs of food and energy, is also expected to reflect a similar downtrend. The forecast suggests a drop from 3.8% to 3.6% on a year-on-year basis, marking the lowest annual core inflation rate since April 2021. Similarly, the monthly increase in core CPI is expected to decelerate to 0.3% from the previous month’s 0.4%.

Goldman Sachs economists anticipate that the core CPI will continue to show disinflationary trends in the coming months, forecasting monthly core CPI inflation to hover between 0.25% and 0.30% before decreasing to about 0.2% by the end of 2024. The year-over-year core CPI is projected to stabilize at 3.5%, and core Personal Consumption Expenditures (PCE) inflation, another key indicator watched by the Federal Reserve, is expected at 2.7% by December 2024.

The CPI data typically plays a significant role in influencing market dynamics, more so than the Producer Price Index (PPI). However, the real implications for financial markets will likely emerge once analysts review both the CPI and PPI reports. Notably, today (at 8:30 am ET) is a rare occasion where US PPI data is released the day prior to CPI data.

“PPI + CPI data have a very strong correlation. PPI leading the way for CPI numbers historically. Thus expect the market to react more significantly than usual on any miss on expectations,” renowned crypto analyst Ted (@tedtalksmacro) warned today.

How Will Bitcoin React?

The Bitcoin and crypto markets have shown notable sensitivity to inflation figures and the US Federal Reserve policy over the past months. Ted highlighted the importance of the upcoming inflation data, indicating that a slowdown in inflation could bolster risk assets like Bitcoin.

He stated via X:

Inflation data is centre-stage.[…] Expect volatility, however, this is the first time in a little while where we are likely to see inflation data slow. That’ll be good for risk assets like Bitcoin if true and we could be on the verge of leg higher there.

This sentiment is echoed by Alex Krüger (@krugermacro), who succinctly captured the market’s sentiment: “CPI in line or soft: higher, CPI hot: lower, BTC is back to trading macro news.” This perspective underscores the prevailing market theory that softer inflation could lead to more accommodative monetary policies, which are typically favorable for risk assets like Bitcoin.

At press time, BTC traded at $61,628.

Bitcoin price

On A Tear: Toncoin Outshines Bitcoin With Price Surge And Social Buzz

The native token of the Telegram-connected Open Network, Toncoin (TON), has outperformed Bitcoin (BTC) despite the recent market turbulence. Bitcoin fell by 3% over the last week, while TON increased by nearly 20%. Within the cryptocurrency world, this unexpected outperformance has set off a wild speculating frenzy. Will TON’s rapid ascent continue, or is this merely a passing blip?

Social Buzz Fuels The Toncoin Engine

One key factor behind TON’s recent success appears to be a surge in social media activity. Social volume, a metric that tracks discussions and mentions on platforms like Twitter and Telegram, has skyrocketed by over 20% compared to the previous week. This suggests a growing interest in TON, potentially attracting new investors and driving up the price.

Investor Sentiment: A Mixed Bag For TON

However, a closer look reveals a potential wrinkle in this optimistic outlook. While the overall sentiment surrounding TON has been positive, it has recently dipped into negative territory. This could be a sign of growing investor apprehension, as some may be worried about the sustainability of the current price rally.


Accumulation Signals: Are Investors Betting Big On Toncoin?

On the other hand, some metrics point towards potential long-term bullishness. The mean dollar invested age, an indicator of how long tokens have been held, has been gradually increasing. This suggests that investors are holding onto their TON, potentially with an eye on future gains.

Additionally, the dormant circulation, representing tokens that haven’t been moved in a while, has remained low. While a previous spike coincided with a price peak, the current stability could indicate a more strategic accumulation by investors.


Technical Analysis: Eyes On The Prize For Toncoin

Technical analysts, who study price charts and historical data to predict future movements, are also cautiously optimistic about TON. Fibonacci retracement levels, a popular technical tool, suggest the recent downtrend may be nearing its end. This could pave the way for TON to climb towards targets near $10, with potential profit-taking opportunities for investors.

A Marathon, Not A Sprint

While the recent surge in price and social media buzz paints a promising picture for TON, it’s crucial to remember that the cryptocurrency market remains highly volatile.

The current uptrend for TON could be the beginning of a long-term ascent, fueled by growing adoption and a thriving ecosystem within the Telegram network. However, it’s also possible that this is just a short-lived rally, followed by a correction.

Featured image from Medjan, chart from TradingView

Bitcoin Price Stuck In Key Range, What Could Spark Major Move?

Bitcoin price managed to stay above the $60,000 support. BTC recovered and is now facing hurdles near the $63,500 resistance zone.

  • Bitcoin seems to be trading in a range between $60,000 and $63,500.
  • The price is trading above $61,800 and the 100 hourly Simple moving average.
  • There was a break above a major bearish trend line with resistance at $61,400 on the hourly chart of the BTC/USD pair (data feed from Kraken).
  • The pair could rally if it clears $63,500 or might revisit the range support at $60,000.

Bitcoin Price Trims Gains

Bitcoin price extended its decline below the $60,800 support zone. However, the bulls were active above the $60,000 support zone. A low was formed at $60,220 and the price started a recovery wave.

There was a move above the $61,000 and $61,200 levels. Besides, there was a break above a major bearish trend line with resistance at $61,400 on the hourly chart of the BTC/USD pair. The pair rallied and revisited the main hurdle at $63,500.

A high was formed at $63,400 and the price is now consolidating gains. It traded below the 23.6% Fib retracement level of the upward move from the $60,220 swing low to the $63,400 high.

Bitcoin is still trading above $62,000 and the 100 hourly Simple moving average. Immediate resistance is near the $62,800 level. The first major resistance could be $63,000. The next key resistance could be $63,500. A clear move above the $63,200 resistance might send the price higher.

Bitcoin Price

Source: BTCUSD on TradingView.com

The main resistance now sits at $63,500. If there is a close above the $63,500 resistance zone, the price could continue to move up. In the stated case, the price could rise toward $65,000.

Another Decline In BTC?

If Bitcoin fails to climb above the $63,200 resistance zone, it could start another decline. Immediate support on the downside is near the $62,200 level.

The first major support is $61,800 or the 50% Fib retracement level of the upward move from the $60,220 swing low to the $63,400 high. If there is a close below $61,800, the price could start to drop toward $61,200. Any more losses might send the price toward the $60,250 support zone in the near term.

Technical indicators:

Hourly MACD – The MACD is now losing pace in the bullish zone.

Hourly RSI (Relative Strength Index) – The RSI for BTC/USD is now near the 50 level.

Major Support Levels – $61,800, followed by $61,200.

Major Resistance Levels – $63,200, $63,500, and $65,000.

Bitcoin Will Be Set For New ATHs If It Breaks This Resistance: Analyst

An analyst has explained how Bitcoin could be positioned for new all-time highs (ATHs) if it can break through this on-chain resistance level.

Bitcoin On-Chain Data Could Suggest This Level Holds Major Resistance

In a new post on X, analyst Ali discussed Bitcoin’s current on-chain resistance. In on-chain analysis, the strength of support and resistance levels is based on the total amount of cryptocurrency last acquired at each level.

Below is a chart for Glassnode’s UTXO Realized Price Distribution (URPD) metric, which shows the supply distribution across the various price levels based on where the investors bought their coins.

Bitcoin URPD

From the graph, it’s visible that in terms of the levels currently ahead of the spot price, the $66,250 mark stands out as it hosts the cost basis of over 2% of all Bitcoin UTXOs.

Generally, the cost basis is a special level for any investor, and they are naturally more likely to react when it is retested, as it can lead to a flip in their profit-loss situation.

The spot price retesting a level won’t produce much reaction if only a few investors share their cost basis around the level. Still, if many holders bought there, the cryptocurrency could see visible effects upon a retest.

Investors who are losing money may look forward to such a retest to exit out at their break-even point, as they may fear that the asset will fall back down again in the future, so getting away with their initial capital would seem like the ideal decision.

As such, a retest of a level dense with UTXOs from below can lead to a selling reaction in the market, making these levels points of strong resistance for Bitcoin.

Since the $66,250 level appears to be where the most coins were purchased out of the levels ahead, this level could be the toughest one to break for the cryptocurrency.

On the brighter side, though, the levels after this point are relatively thin. “Once BTC breaks past this level, it will be positioned for new all-time highs!” explains the analyst.

The market intelligence platform IntoTheBlock has also discussed about on-chain cost basis distribution in an X post today. As revealed by the firm, around 10% of all addresses acquired their coins between the current spot price and the all-time high the asset set back in March.

Bitcoin Cost Basis

This would naturally mean that 10% of the total addresses, equivalent to 5.16 million, are in the red on the Bitcoin network.

BTC Price

Bitcoin has continued to move in its recent range, with its price currently trading around the $62,800 level.

Bitcoin Price Chart

Is The Crypto Winter Thawing? US Bitcoin ETFs Record First Inflows In Weeks – Coinshares

After experiencing outflows for four consecutive weeks, US spot Bitcoin exchange-traded funds (ETFs) have marked a notable shift in momentum, witnessing net inflows once again.

According to recent data from CoinShares, digital asset investment products have seen inflows totaling $130 million for the first time in five weeks.

This change suggests renewed investor interest in crypto-focused investment products, particularly in the United States, where most of these inflows, totaling over $130 million, occurred.

A Mixed Bag Of Global Investment Flows

Grayscale, a major player in the digital asset space, reported a significant decrease in weekly outflows, recording its lowest since January at $171 million. This trend indicates a potential stabilization in the market after a period of volatility and declining interest.

Meanwhile, interaction between US regulators and spot ETF issuers has remained minimal, particularly for spot Ethereum ETF applications.

This lack of engagement has fuelled speculation that approval for these ETFs might not be approaching, as reflected by the amount of outflows from Ethereum-based products. James Butterfill, Head of Research at Coinshares, particularly noted:

Low interaction by the US regulators with ETF issuer applications for a spot Ethereum ETF have increased speculation that the ETF approval is not imminent, this has been reflected in outflows which totalled US$14m last week.

On a global scale, the investment landscape showed mixed signals. After a week of record inflows likely driven by “seed capital” post-Bitcoin ETF launches, as highlighted by Butterfill, Hong Kong saw a significant drop to $19 million in inflows.

Conversely, Switzerland experienced inflows amounting to $14 million. Canada and Germany continued to see outflows, with their year-to-date figures reaching a combined $660 million, indicating sustained bearish sentiment in these markets.

Bitcoin has rebounded with $144 million in inflows, counteracting a generally “weak month.” In contrast, short-Bitcoin exchange-traded products (ETPs) recorded outflows totaling $5.1 million, up to $18 million over the last eight weeks.

These figures highlight the volatile dynamics within the crypto market, with Bitcoin currently showing stronger performance than Ethereum.

Bitcoin And Ethereum Market Performance

Over the past 24 hours, Bitcoin surged nearly 3%, while Ethereum increased by only 1.2%. Despite these gains, both assets are down by 2.3% and 6% over the past week.

Bitcoin (BTC) price chart on TradingView

Amidst these market movements, crypto analyst Ali provided insights into Bitcoin’s potential paths. According to Ali, Bitcoin could climb to $76,000 if it reclaims $64,290 as a support level.

Failing to achieve this could see the flagship crypto drop to support at $51,970, based on Market Value To Realized Value (MVRV) extreme deviation pricing bands, identifying this figure as the all-time mean.

Featured image from Unsplash, Chart from TradingView

Are We Out Of The Woods? Analyst Bullish On Bitcoin’s 6-Figure Future

Bitcoin (BTC) began the month with the deepest retrace of the cycle, falling to the $56,000 support level. The retrace raised alarms for some crypto investors and market watchers, who feared the bull run had ended.

Since then, the largest cryptocurrency by market capitalization has recovered crucial levels, and analysts have identified bullish patterns on BTC’s chart, suggesting that it might finally be out of the woods.

Is Bitcoin Out Of Danger?

As the May 1st retrace developed, crypto analyst Rekt Capital highlighted the similarities between Bitcoin’s 2016 and 2024 post-halving performances. He suggested that the flagship cryptocurrency’s price development came “as no surprise,” as it was mirroring the “post-Halving Bitcoin Danger Zone” of 2016.

Per the analyst, the “Danger Zone” is officially over, which BTC is “celebrating with a good bounce from the Re-Accumulation Range Low support.” He stated that May could be an “unremarkable” month for the largest cryptocurrency, potentially continuing next month. However, Bitcoin is “running out of unremarkable months” before the beginning of this cycle’s “Parabolic Phase.”

Additionally, Rekt Capital considers that BTC’s sell-side momentum is starting to show signs of slowing down, “slowly developing a curl against the $60,000 support.” Per the post, Bitcoin must continue to hold this support zone for the curl to “progress and eventually lift up.”

bitcoin

Similarly, analyst Bluntz identified a bullish engulfing pattern on Thursday, considering there would be “a solid engulfing on the daily close.” To the analyst, it appeared that the “next push-up into ATH has started.”

This morning, Bluntz confirmed the pattern formation and announced to his followers that this cycle’s Round 2 began, which would lead to a “fresh ATH.”

BTC’s Strength Could Lead The Price To 6-Figures

Following the bullish analysis, CryptoJelle stated that BTC “is looking good.” Per his post, the cryptocurrency “has nearly completed a full reset,” as it’s back to the 100-day Exponential Moving Average (EMA).

Additionally, the chart displays a “bullish MACD cross” below the zero line and the “first higher low in a long time,” suggesting a positive divergence.

Jelle highlights that BTC’s price is again pushing into the trendline that “has pushed prices lower over the past weeks.” Despite the higher low, he points out the necessity of reclaiming the $63,000 support zone before new highs come.

For these new highs, he set an $82,000 target for BTC’s price, suggesting that a 6-figure price for the flagship cryptocurrency is possible during this cycle.

The analyst emphasizes Bitcoin’s performance this cycle, stating that the community has under-appreciated its strength during this bull run. He considers that the run is not over, as the “Halving” event occurred just a few weeks ago, and BTC’s price has been consolidating around the previous cycle’s all-time high for a long period.

On Monday, Bitcoin surged to $63,000 after hovering between $60,000 and $61,000 for the past few days. Despite its recent performance showing short-term red numbers, BTC’s price still registered a 25.7% and 76.5% increase in the three-month and six-month periods, respectively.

At the time of writing, BTC is trading at $62,752, a 3% increase in the past 24 hours.

BTC, BTCUSDT, Bitcoin

Buy Or Sell Bitcoin? Quant Reveals What Leading Metric Says

A quant has explained what a potential leading Bitcoin indicator could say about what’s next for the cryptocurrency’s price.

Bitcoin Coinbase Premium May Hold The Answer To Where BTC Goes Next

In a CryptoQuant Quicktake post, an analyst has talked about the trend currently taking place in the Bitcoin Coinbase Premium. “We can use the trend of Coinbase Premium as a leading indicator of the future direction of BTC price,” notes the quant.

The “Coinbase Premium” is a metric that keeps track of the difference between the Bitcoin price listed on the cryptocurrency exchanges Coinbase (USD pair) and Binance (USDT pair).

When the value of this indicator is positive, it means that the price listed on Coinbase is higher than on Binance right now. Such a trend suggests the buying pressure is higher (or the selling pressure is lower) on the former platform than on the latter.

On the other hand, the negative premium implies Coinbase might be observing a higher amount of selling than Binance, as the asset is currently trading at a lower price there.

Now, here is a chart that shows the trend in the 30-day moving average (MA) of the Bitcoin Coinbase Premium over the last couple of years:

Bitcoin Coinbase Premium

As displayed in the above graph, the 30-day MA Bitcoin Coinbase Premium has been positive recently, suggesting that Coinbase users have supported the asset through the rally.

Coinbase is popularly known as the preferred platform of the US-based institutional entities, while Binance has a more global user base. As such, the premium’s value can provide hints about how the behavior of the American whales differs from that of the rest of the world.

From the chart, it’s visible that the buying pressure from these institutional traders peaked alongside the price top but has since been declining. The metric continues to be positive overall, although it’s now quite close to the neutral zero mark.

In the graph, the quant has highlighted an interesting pattern that the cryptocurrency has followed regarding the Coinbase Premium during the last two years. It would appear that whenever the indicator has hit bottom in negative territory and reversed back to an uptrend, the coin’s price has observed a rebound.

An example of this trend also played out just earlier in the year, when a reversal in the indicator led to Bitcoin observing a rally in which the asset would eventually break its all-time high.

The Coinbase Premium is currently riding a downtrend, but it’s yet to dip into negative territory. The analyst explains that BTC is in a “wait and see” phase, where a rebound might be a bit longer out. The metric has to first decline more and reach a reversal point, at least if the historical pattern has to repeat.

BTC Price

Bitcoin had slipped under $61,000 earlier, but the asset has found a slight rebound in the past day, returning above $62,700.

Bitcoin Price Chart

Bitcoin Long-Term Holders Accumulating Like In 2021: Is BTC Ready For A 15X?

Bitcoin is moving sideways, posting drab price action, forcing participation to taper. But amid this consolidation and even fear of more losses, one analyst has shared data suggesting that long-term holders are accumulating at spot rates. 

Are We Back To 2021? Bitcoin Long-Term Holders Accumulating

In a post on X, the analyst noted that this re-accumulating pace is picking up momentum, mirroring a welcomed trend that preceded the impressive 2021 bull run.

Therefore, if long-term holders, or HODLers, accumulate, the probability of BTC rallying in the sessions ahead is elevated. Thus far, BTC has been trending above $60,000, up 10% from the May 2024 lows. 

BTC long-term holders accumulating | Source: Analyst on X

For clarity, the data shared by the analyst uses Unspent Transaction Outputs (UTXOs) to classify long-term and short-term holders. Analyzing the age of UTXOs makes it easier to gauge the behavior of different investor groups. 

Usually, UTXOs older than 155 days have “diamond hands” or long-term holders. Meanwhile, those who hold BTC for less than 155 days are short-term holders or often classified as “weak” hands.

They are usually traders or speculators interested in riding on price volatility, like in the first half of Q1 2024. 

When long-term holders stopped distributing BTC in 2021, prices rose sharply. By November 2021, the coin had peaked at around $70,000, lifting prices by nearly 1,500% from 2020 lows. It is unclear if BTC is ready for another 15X surge from spot rates, a move that would propel it to over $700,000.

BTC Has Strong Support At $60,000, Analyst Urges Patience

While the on-chain data paints a bullish picture, some analysts advocate caution. Taking to X, one analyst notes that Bitcoin has strong support at around the psychological $60,000 mark. The coin could stabilize if bulls soak in selling pressure and reject attempts for lower lows.

However, if prices dump below $60,000, triggered by a news event, BTC may fall to as low as the $52,000 to $55,000 zone.

BTC at key support | Source: Analyst on X

Despite the potential for short-term volatility, the analyst encourages investors to maintain a long-term perspective. Accumulating Bitcoin at these levels and exercising patience could be a winning strategy, the analyst says.

This preview would be especially true now that on-chain data shows that long-term holders are accumulating. 

Bitcoin price trending sideways on the daily chart | Source: BTCUSDT on Binance, TradingView

Before then, traders should watch price action. The coin is moving sideways, finding rejection at $66,000. Even though prices are lower, the last day’s series of higher highs is encouraging and might spark demand.