
Bitcoin bulls see signs of the worst being over as a BTC price bounce gathers pace toward $60,000.
Cryptocurrency Financial News
Bitcoin bulls see signs of the worst being over as a BTC price bounce gathers pace toward $60,000.
The latest in blockchain tech upgrades, funding announcements and deals. For the period of May 2-8.

MoonPay users in the U.S. can now buy and sell 110 different cryptocurrencies using PayPal transfers via wallet, bank transfers or debit cards.
The latest price moves in bitcoin (BTC) and crypto markets in context for May 2, 2024. First Mover is CoinDesk’s daily newsletter that contextualizes the latest actions in the crypto markets.
The cryptocurrency is already showing signs of maturity as its volatility drops to all-time lows on a yearly scale, the report said.
The recent plummet in Bitcoin’s value below the $60,000 mark has sparked widespread speculation within the crypto community, raising questions among investors and market watchers about the future direction of its price. Marco Johanning, a well-known crypto analyst and founder of The Summit Club, took to X (formerly Twitter) to provide his insights on the current market conditions and what might be expected next.
According to Johanning, the recent price action does not signify a market downturn but rather a correction within an ongoing bull market. He emphasizes, “Bitcoin lost the range. What now? First and foremost, a reminder: we are in a bull market, and this is a correction. This is not a rally in a bear market. Or in other words, the high time frame trend is up no matter what.”
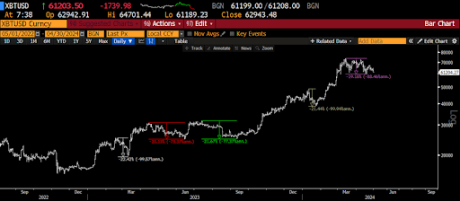
He supported this assertion with several indicators of a continued bullish trend. First, Bitcoin reached its bear market bottom in November 2022 and subsequently broke above the 200-day moving average, a critical indicator of long-term market trends. Following a drop below the 200-day moving average, there was a significant breakout above this level and THE major high time frame resistance in October 2023.
Moreover, Bitcoin achieved a new all-time high in March 2024. Over the last 18 months, Bitcoin has consistently recorded higher highs and higher lows, which are typical characteristics of a bullish market.
“This can’t be a bear market,” Johanning explained. “These elements underscore a fundamental bias crucial for assuming that the current drop is part of a broader bull market trend. Therefore, Bitcoin will eventually find a local bottom and ascend higher.”
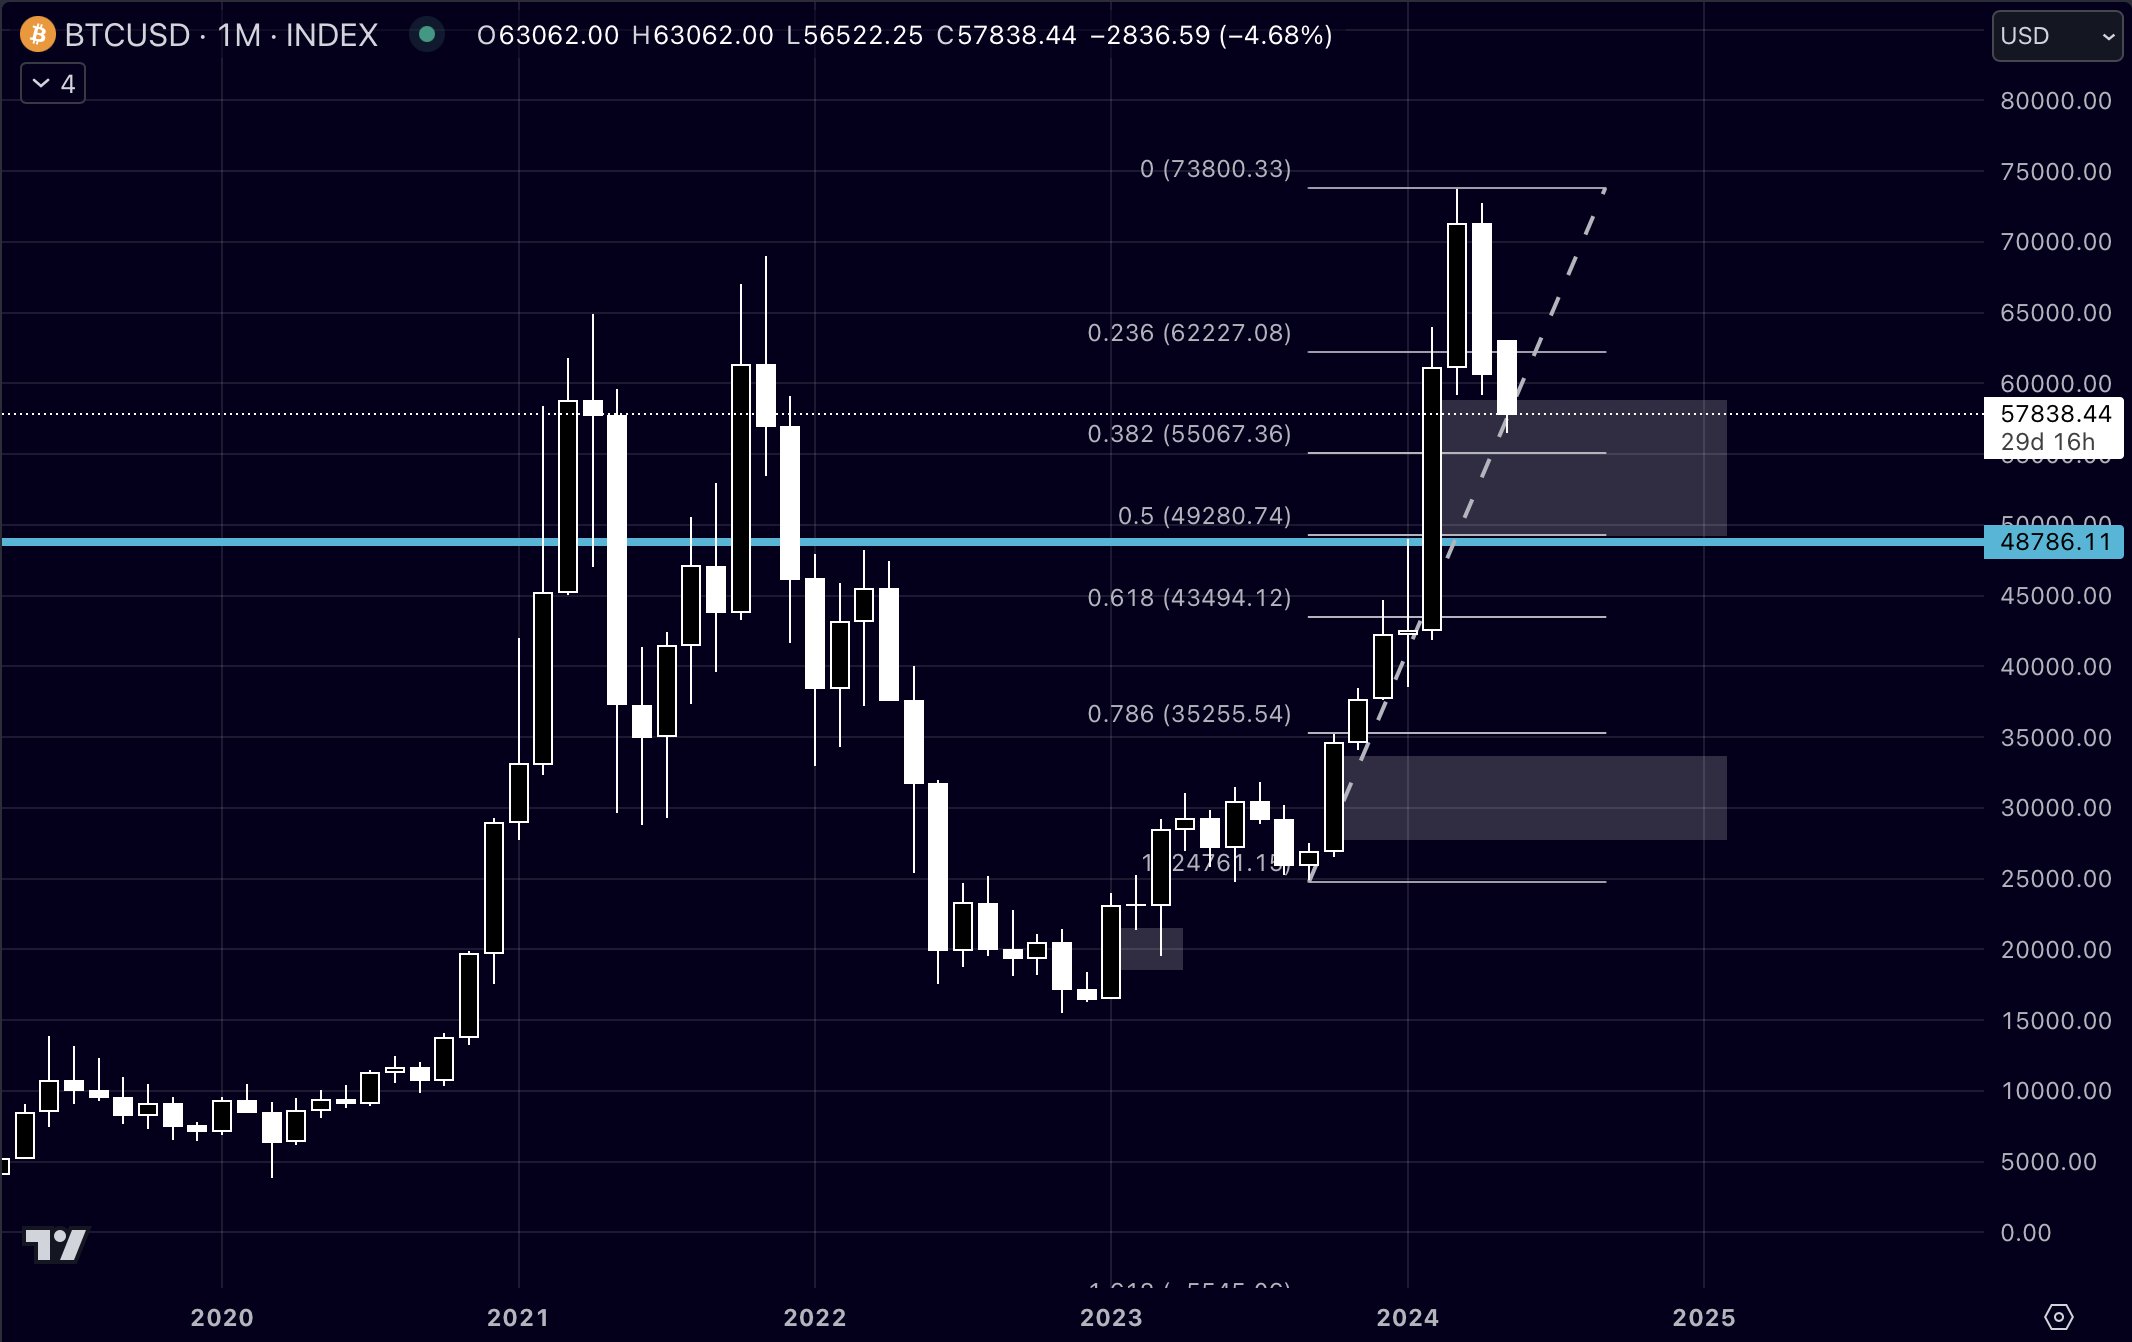
Johanning provided a detailed breakdown of possible future scenarios based on technical analysis. His first scenario is based on the monthly chart where the most crucial level is at $48,000-$49,000. This level is key because it was a major hurdle overcome in February 2024. Now, it might serve as the perfect point for a bullish retest.
Furthermore, there’s a significant market imbalance down to the $48,000-$49,000 range, coinciding with the 0.5 Fibonacci retracement level from the last monthly swing low. This setup suggests a strong potential for price stabilization and reversal at this level, according to Johanning.
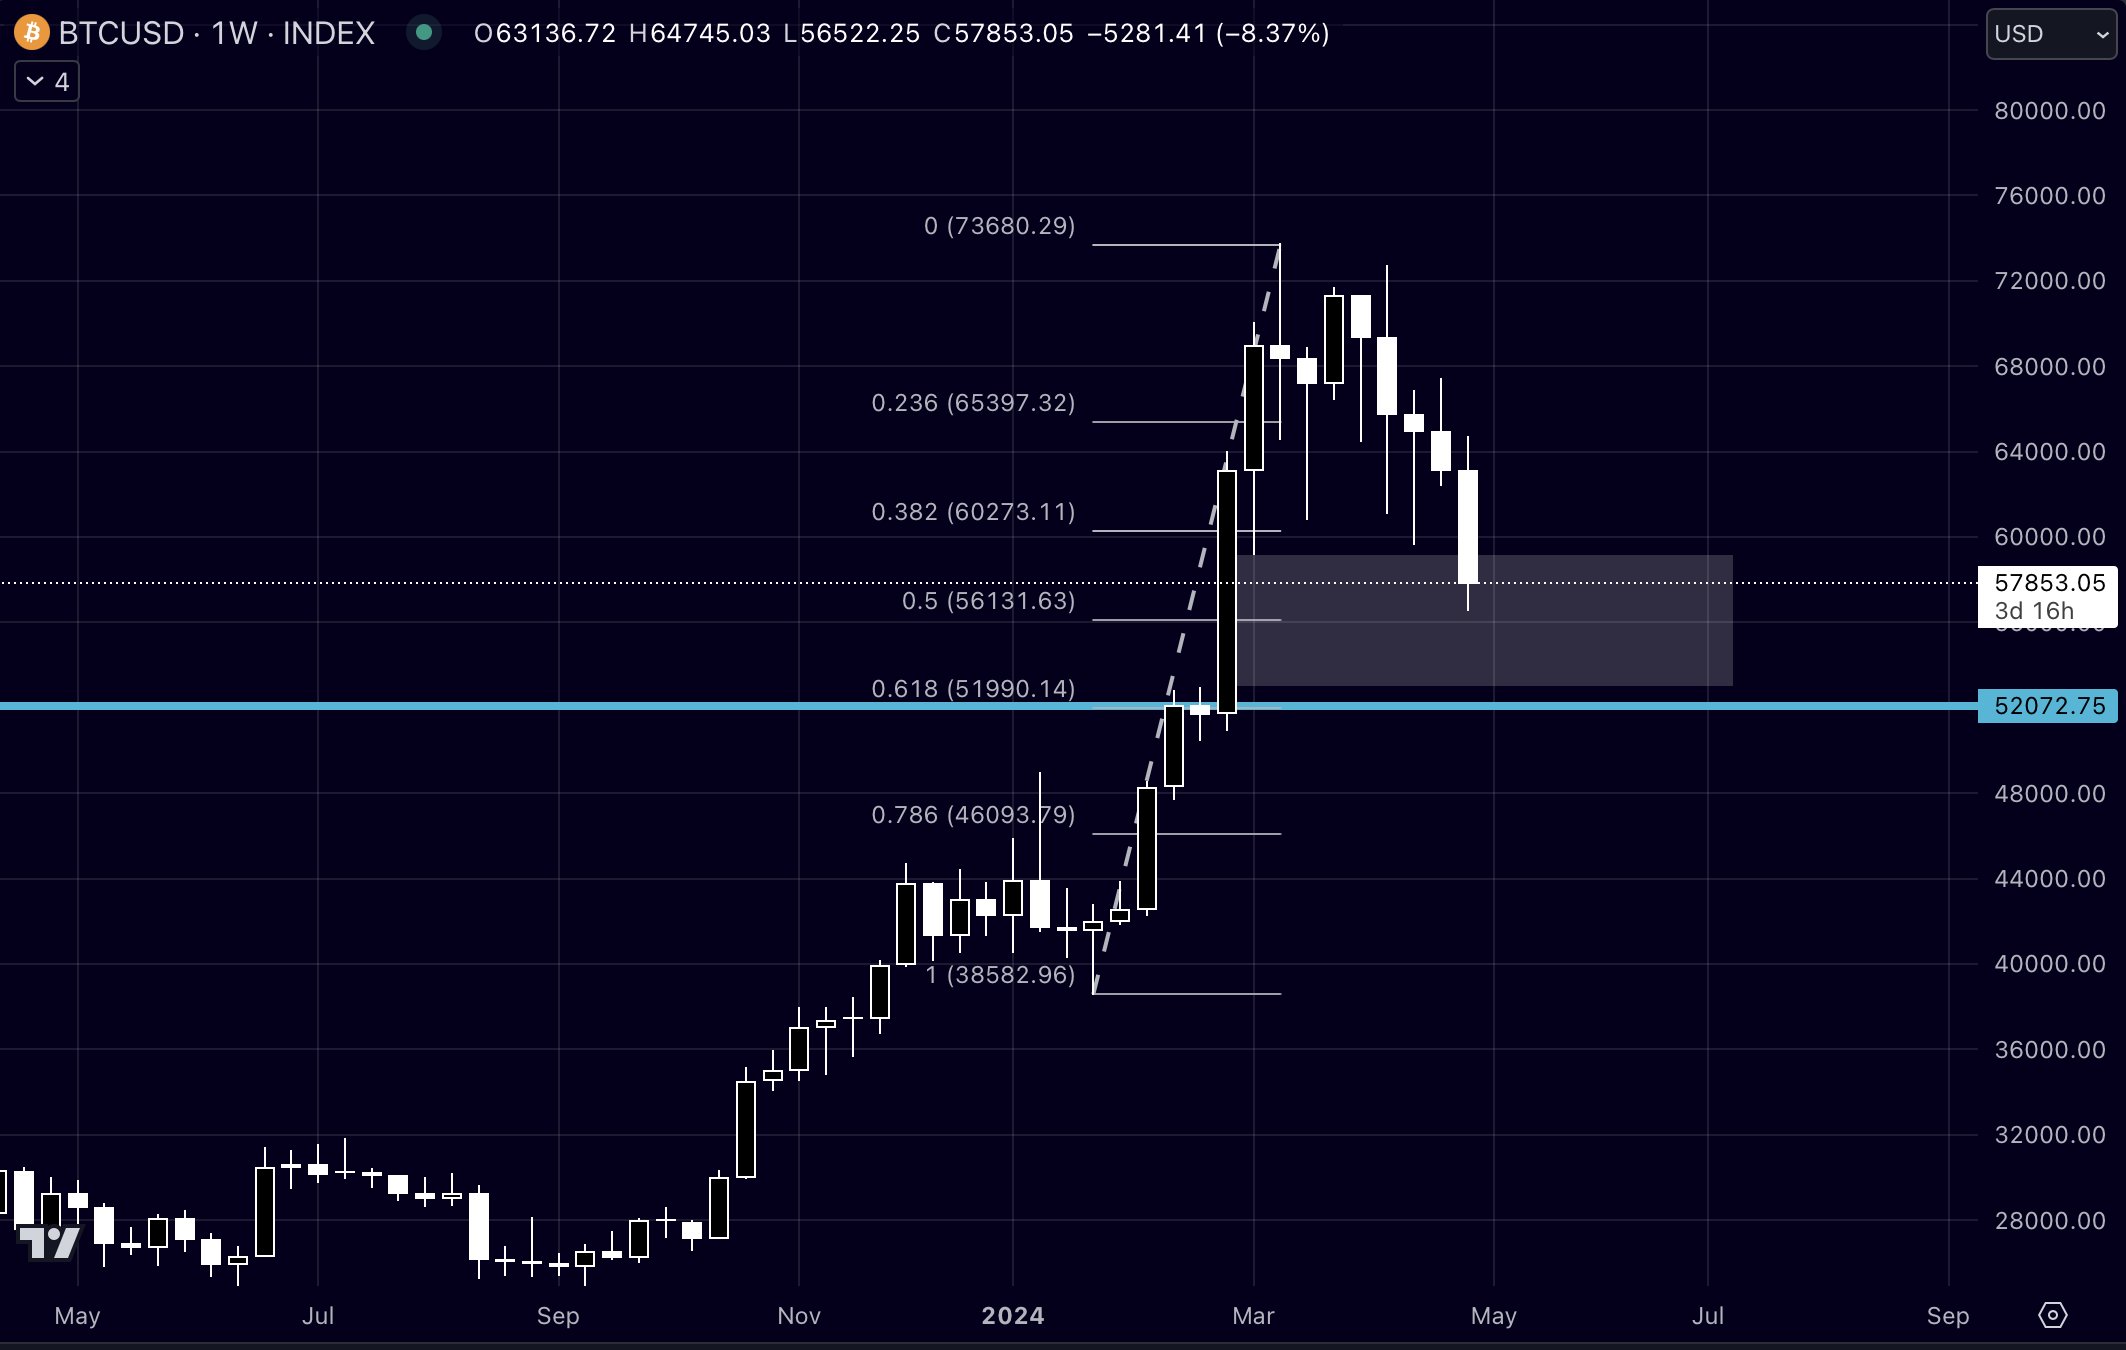
The second scenario grounds on the weekly chart where the important level is at $52,000. This level acts as a major high time frame support/resistance, marked by a weekly imbalance that extends up to $52,000, and it matches the 0.382 Fibonacci retracement from the bottom to the top of the last major rally, and the 0.618 level from the last swing low to the top.
The third scenario is based on the lower timeframes. Here, the most significant level is at $57,000. This mark is critical as it represents the 0.5 Fibonacci level from the last swing low and was a key area during the February climb. This level might serve as the stage for a potential deviation or price trap.
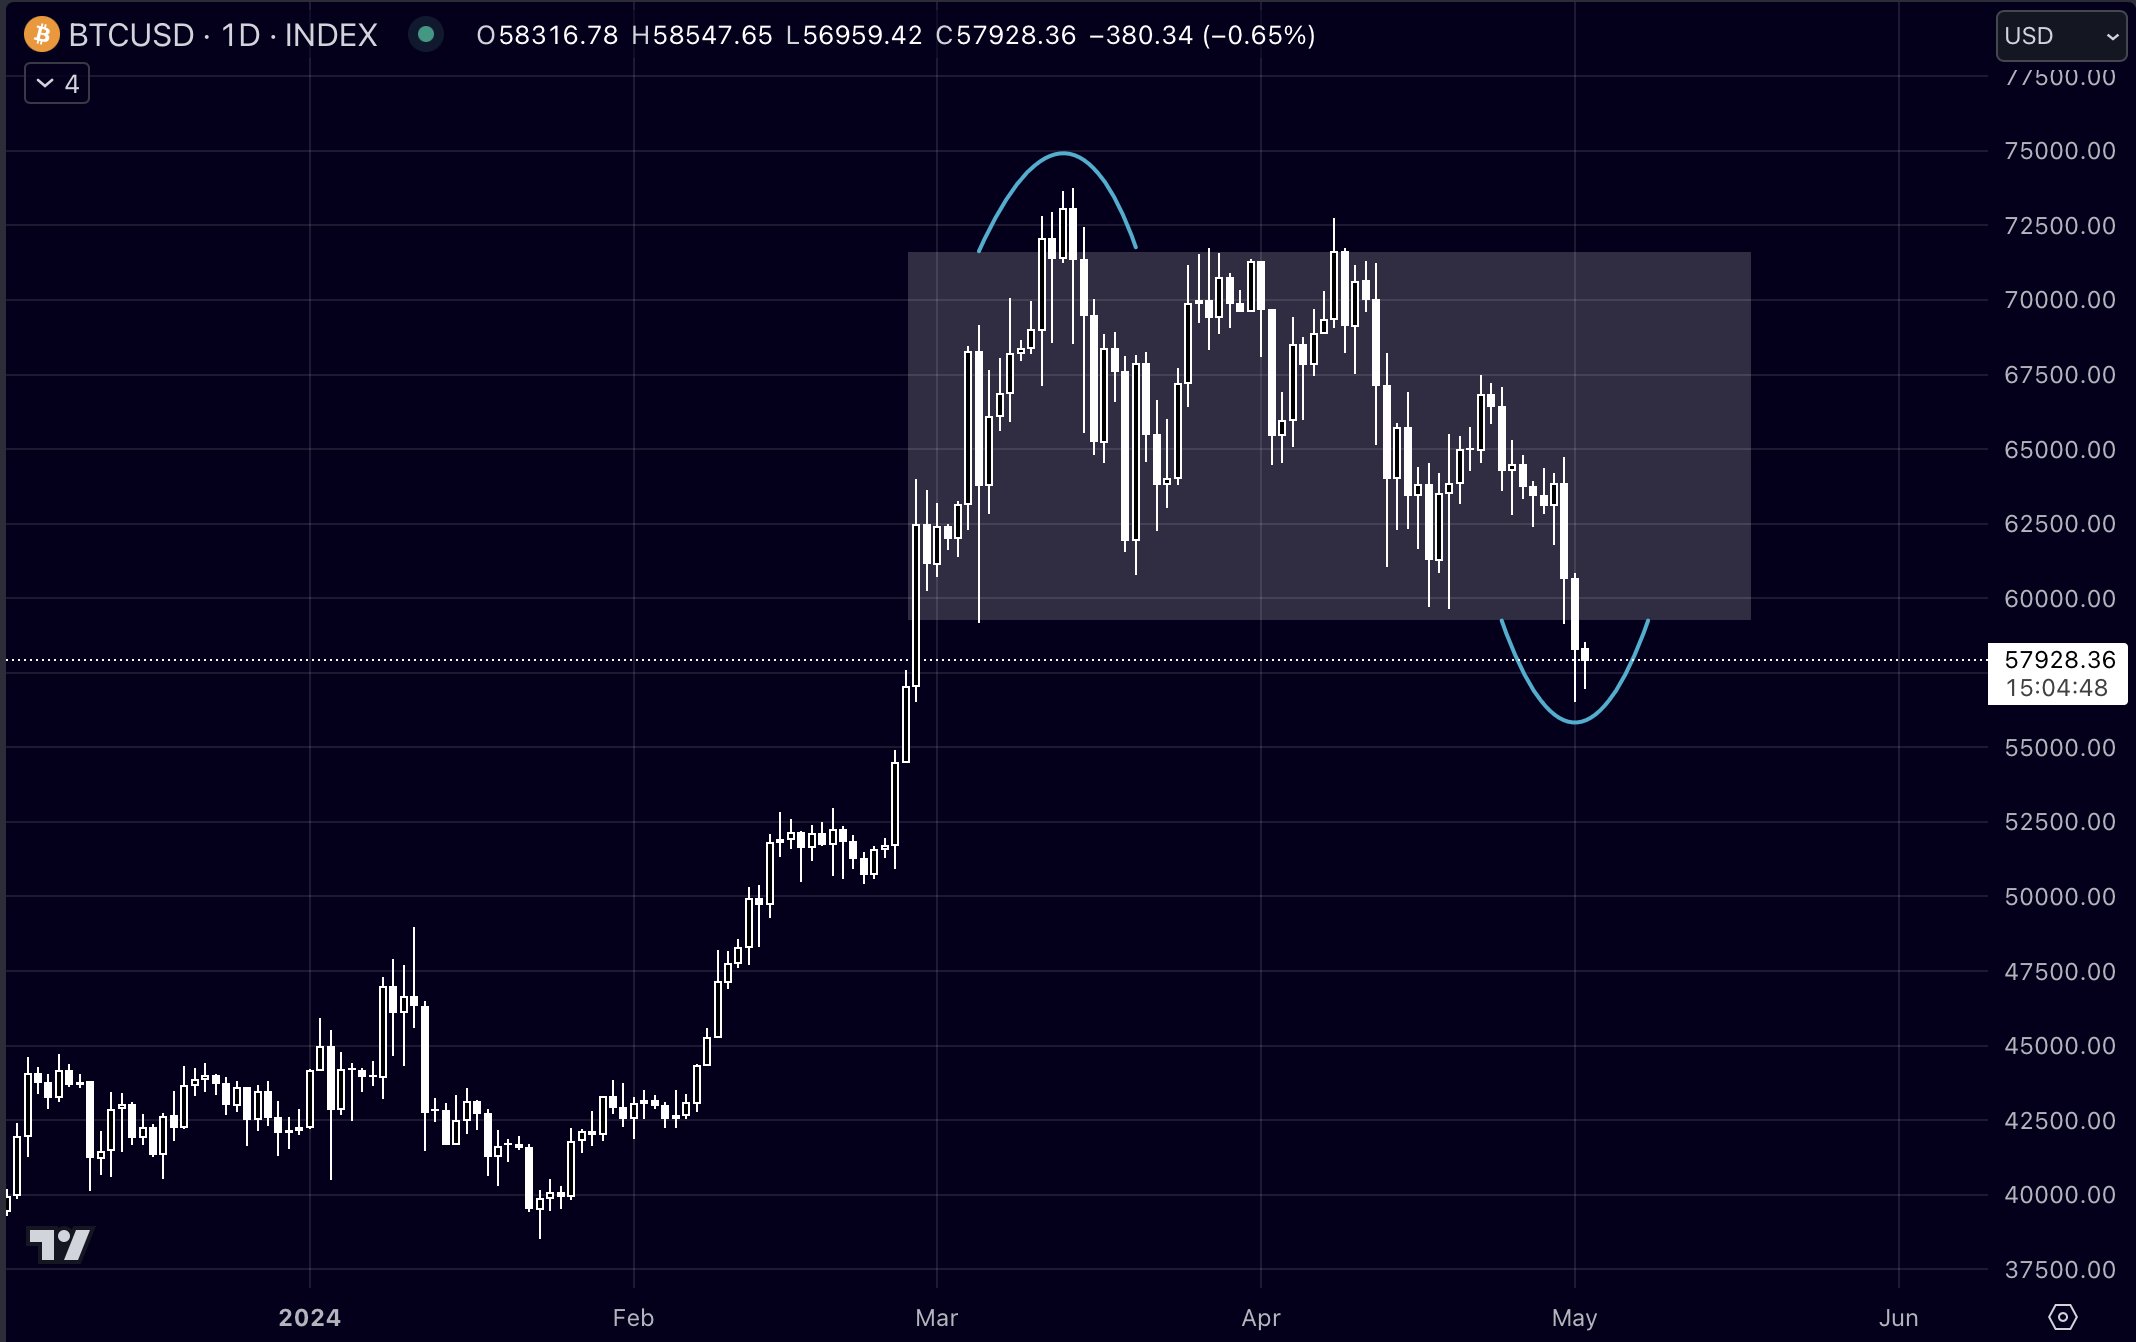
“The recent bearish engulfing pattern breaking the monthly levels, followed by a bearish retest, signals significant market shifts,” noted Johanning. “If Bitcoin swiftly reclaims these key levels, particularly the $57,000 mark, we could see a deviation scenario unfold. Otherwise, the $52,000 or $48,000-$49,000 levels will likely be tested, each representing a higher low in the ongoing uptrend.”
Altcoins have displayed remarkable resilience in the face of Bitcoin’s volatility, which Johanning finds particularly promising. “Usually, a significant drop in Bitcoin accompanied by a loss of a higher time frame range would lead to severe declines in altcoins. However, their strength yesterday is a good indicator that the worst may be over for altcoins,” he commented.
Johanning concluded his analysis with an optimistic outlook for both Bitcoin and altcoins, expressing confidence in the continuation of the bull market. He is actively accumulating more at current prices, anticipating substantial returns: “No matter which scenario plays out, I am committed to this trend until proven otherwise. I’m investing heavily, and if we truly remain in a bull market, the potential for profit is tremendous.”
At press time, BTC traded at $58,328.

The Bitcoin halving is widely expected to have a positive impact on the price of the preeminent cryptocurrency, but analysts expect volatile price consolidation in the short term.

Despite the excitement around the Hong Kong ETF debut, the inflows are only a fraction of the selling from the U.S. ETFs. Could Bitcoin price revisit the $50,000 mark next?
Recently, traders have sold $80,000 BTC call options expiring at the end of May to generate additional yield, one observer said.
Bitcoin (BTC) has been battered by a relentless bear market over the past month, with its price tumbling 20% from its record highs. However, amidst the carnage, glimmers of hope emerge as prominent analysts predict a potential bottom forming around the current $57,000 mark.
The start of May has not been kind to Bitcoin. The once-dominant cryptocurrency has seen a steady decline, plunging back to levels last witnessed in March before its monumental surge to $73,700. This recent price drop represents the most significant decline of this cycle, raising concerns about a prolonged bear market.
The pain extends beyond Bitcoin, with the broader altcoin market feeling the tremors. Litecoin (LTC), the silver to Bitcoin’s gold, has mirrored the downward trend, shedding a staggering 25% of its value in the past month. While historically seen as a more stable alternative to Bitcoin, Litecoin seems to be tethered to its big brother’s fate in this current downturn.
Despite the prevailing gloom, a chorus of optimism is rising from the crypto analysis community. Several heavyweight analysts believe Bitcoin may have found its footing around the current price range of $56,000 to $58,000.
Rekt Capital, a popular crypto analyst, emphasizes a historical pattern where similar 20% dips have been followed by significant rebounds. Michaël van de Poppe, another well-respected voice, echoes this sentiment, suggesting Bitcoin may be nearing the end of its price consolidation phase. He cautions of potential short-term fluctuations but highlights the $56,000 to $58,000 zone as a crucial support level.
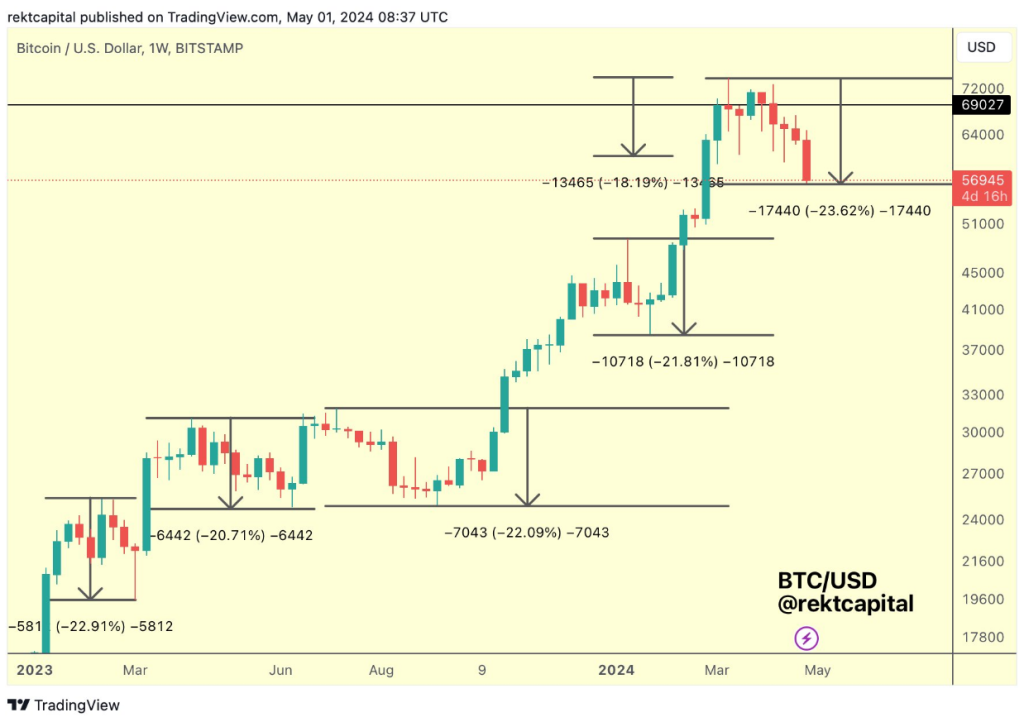
This is officially the deepest retrace in the cycle (-23.6%)$BTC #BitcoinHalving #Bitcoin pic.twitter.com/Gcapbl0Nu6
— Rekt Capital (@rektcapital) May 1, 2024
Uncertainty Looms As Market Awaits Fed Decision
While analyst optimism is a welcome sign, a cloud of uncertainty hangs over the crypto market. The upcoming Federal Reserve decision on interest rates could significantly impact investor sentiment and, consequently, Bitcoin’s price trajectory. A more hawkish stance from the Fed could trigger further selling, while a dovish approach might provide the tailwind needed for a Bitcoin rebound.
Related Reading: Ethereum Fees Dive: Will This Spark A Surge In Network Activity?
Buckle Up For A Bumpy Ride
The next few weeks will be crucial for Bitcoin and the broader cryptocurrency market. The Federal Reserve’s decision and investor reaction to the current price slump will likely dictate the short-term direction. While bullish sentiment suggests a potential reversal, the inherent volatility of the crypto market means investors should brace for a bumpy ride.
Featured image from Pixabay, chart from TradingView

BTC price action spooks ETF investors, data shows, but there is reason to believe that Bitcoin is seeing a broadly healthy correction.
Fidelity’s FBTC, not GBTC, let outflows on Wednesday in what may be an alarming development for the bulls.
Bitcoin price extended losses and settled below $60,000. BTC is now consolidating losses near $58,000 and remains at risk of more downsides in the near term.
Bitcoin price remained in a bearish zone and traded below the $60,500 support level. BTC even settled below the $60,000 level to enter a short-term bearish zone.
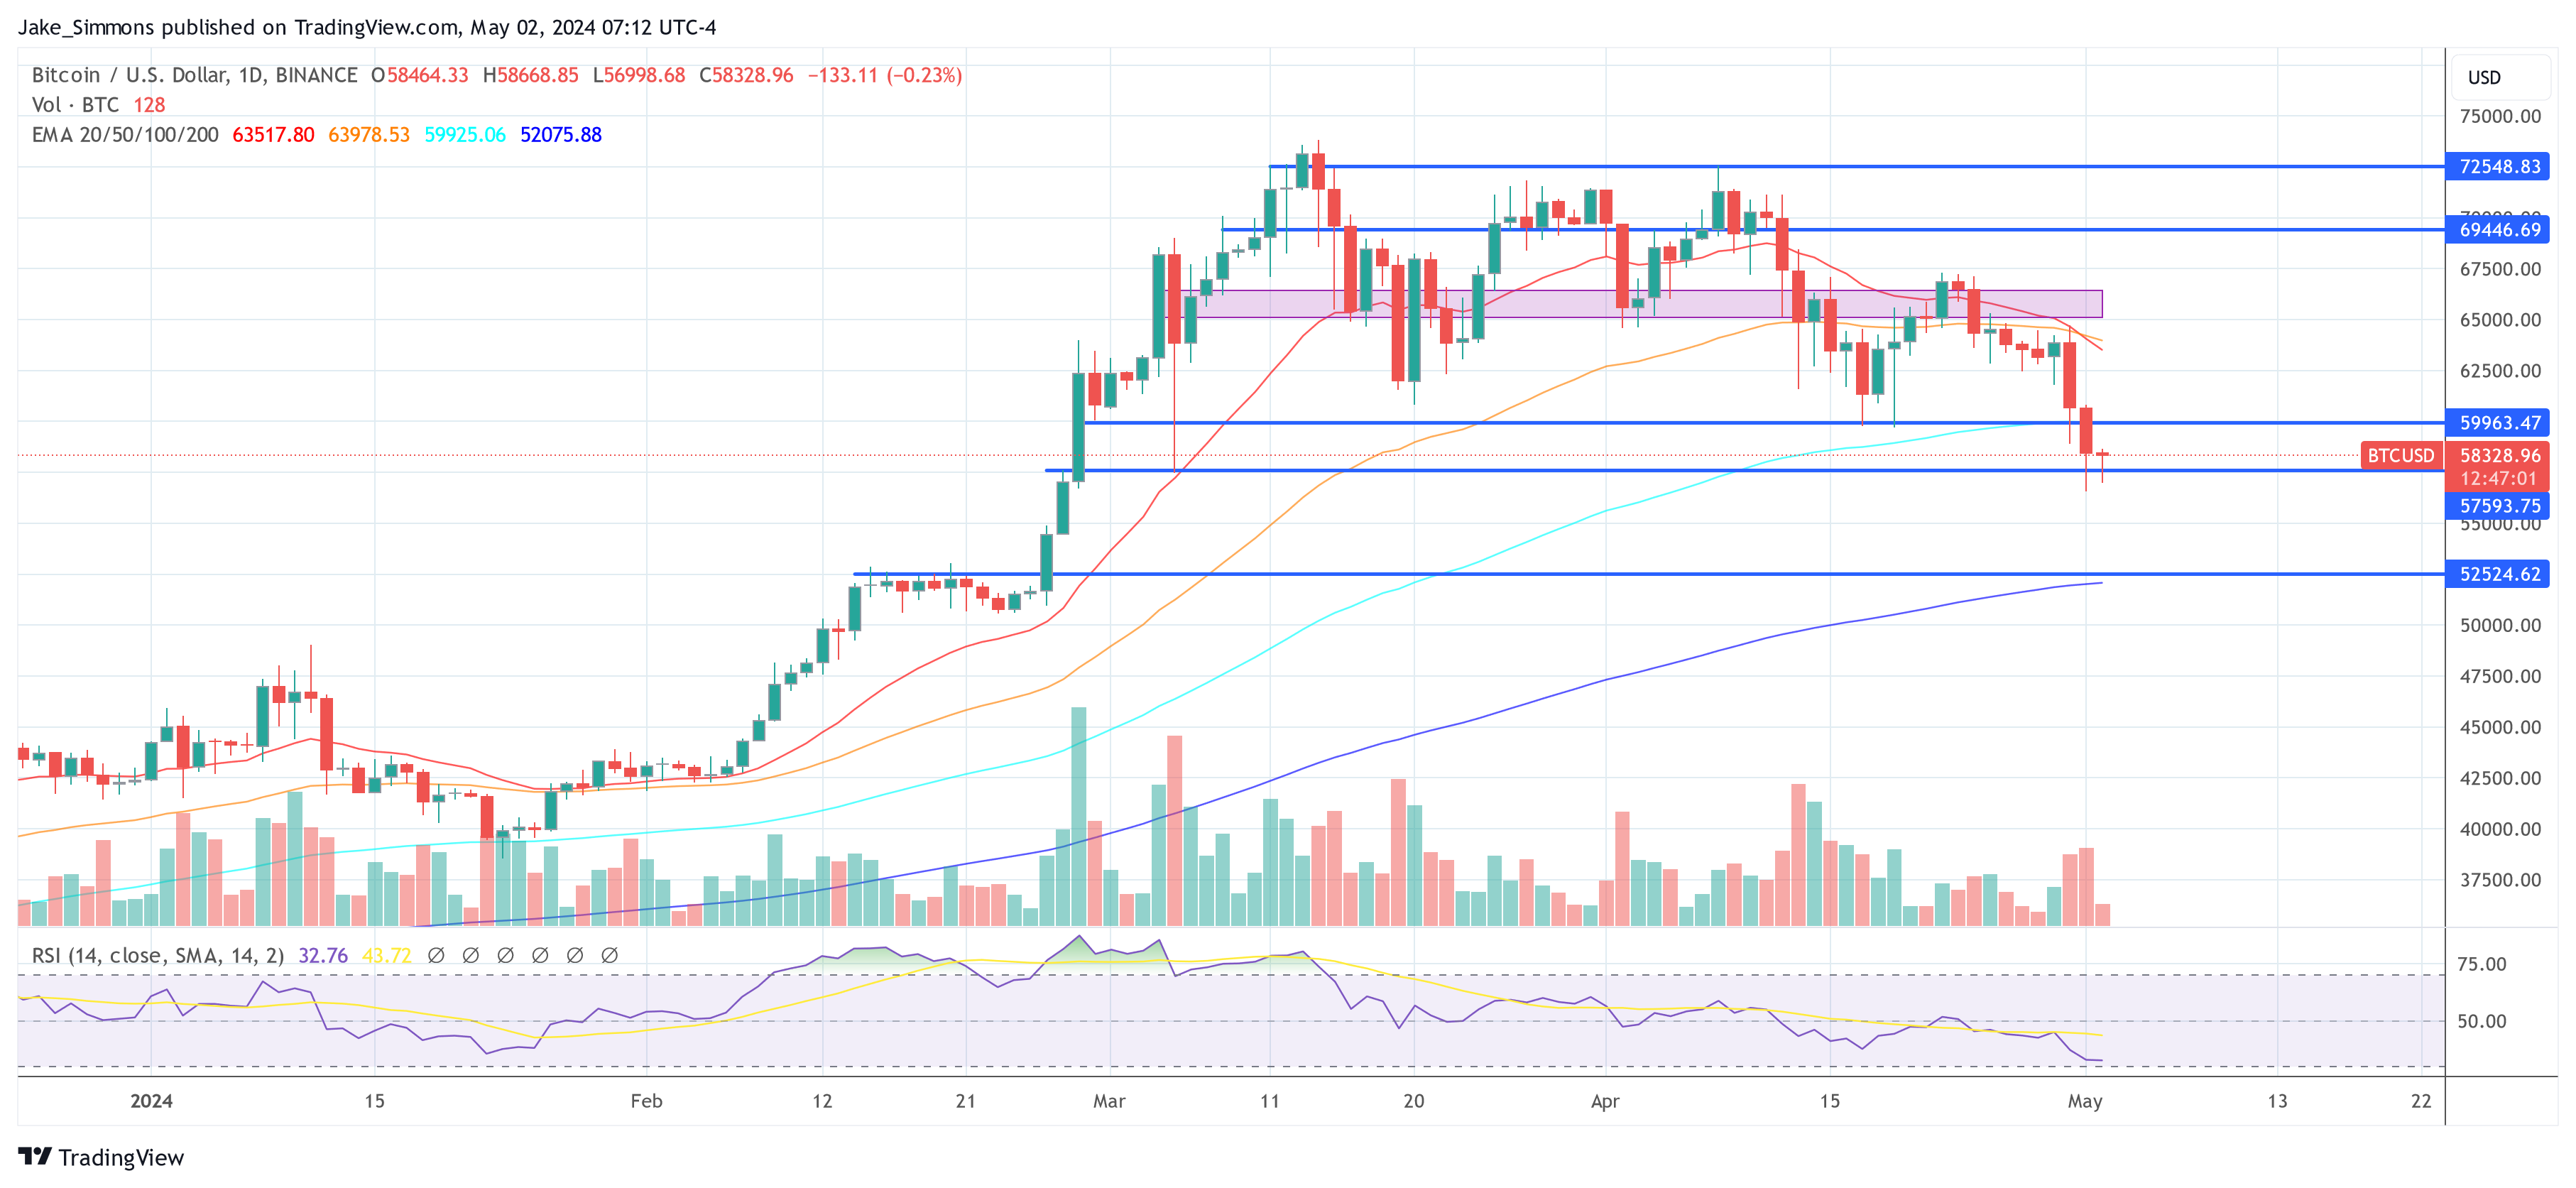
There was a drop below the $58,000 level. A low was formed at $56,378 and the price is now consolidating losses. There was a minor increase toward the $58,000 level and the 23.6% Fib retracement level of the downward move from the $64,740 swing high to the $56,378 low.
Bitcoin is now trading below $58,500 and the 100 hourly Simple moving average. Immediate resistance is near the $58,000 level. There is also a major bearish trend line forming with resistance at $58,000 on the hourly chart of the BTC/USD pair.
The first major resistance could be $59,200. The next key resistance could be $60,500 or the 50% Fib retracement level of the downward move from the $64,740 swing high to the $56,378 low.
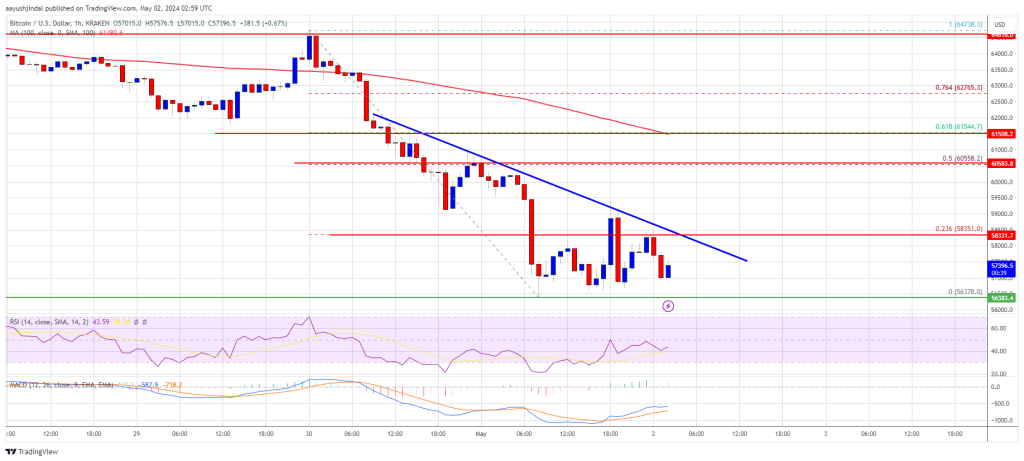
Source: BTCUSD on TradingView.com
A clear move above the $60,500 resistance might send the price higher. The next resistance now sits at $61,500. If there is a clear move above the $61,500 resistance zone, the price could continue to move up. In the stated case, the price could rise toward $63,500.
If Bitcoin fails to rise above the $58,500 resistance zone, it could continue to move down. Immediate support on the downside is near the $57,000 level.
The first major support is $56,500. If there is a close below $56,500, the price could start to drop toward $55,000. Any more losses might send the price toward the $53,500 support zone in the near term.
Technical indicators:
Hourly MACD – The MACD is now gaining pace in the bearish zone.
Hourly RSI (Relative Strength Index) – The RSI for BTC/USD is now below the 50 level.
Major Support Levels – $57,000, followed by $56,500.
Major Resistance Levels – $58,500, $60,500, and $61,500.
Bitcoin is facing a critical juncture as it has entered a ‘danger zone,’ according to prominent gold advocate Peter Schiff. This investor, known for his skepticism toward Bitcoin, suggests that the cryptocurrency is entering a “do or die” phase, potentially marking the end of its bullish run if current trends continue.
Peter Schiff has often voiced his bearish outlook on Bitcoin, and his latest comments come as Bitcoin has just slipped below the crucial $60,000 mark.
This level had previously served as strong support during the short-term bull run, and its breach has intensified the bearish sentiment among investors. Schiff warns that staying below this threshold could spell doom for the bullish fervor, potentially derailing Bitcoin’s momentum.
At the time of writing, Bitcoin is trading at approximately $57,054, teetering close to its 100-day Exponential Moving Average (EMA). Schiff points out that remaining below this EMA could confirm a bearish trend, signaling an end to the rally.
Amidst these developments, the market has seen an increase in trading volume, coupled with the price drop, indicating strong selling pressure.
Over the last 24 hours, Bitcoin’s trading volume has dropped from $45 billion to $48 billion, coinciding with a 6.3% price dip during the same period. This heightened activity is a traditional bearish indicator, lending weight to Schiff’s prediction of a downturn.
Moreover, investor sentiment is treading thin ice with significant outflows from Bitcoin spot ETFs, hitting a weekly high of $162 million. This departure of funds is particularly poignant as it unfolds just before the FOMC meeting, where potential interest rate hikes are on the agenda.
These outflows reflect a broader market trend, with the Grayscale Bitcoin Trust (GBTC) experiencing a substantial daily outflow of $93.23 million.
According to SoSoValue, total net outflows from Bitcoin spot ETFs yesterday, April 30, were as high as $162 million. GrayscaleETF GBTC had a single-day net outflow of US$93.2277 million, and the current historical net outflow of GBTC is US$17.303 billion. The total net asset… pic.twitter.com/jSCtfVrW8l
— Wu Blockchain (@WuBlockchain) May 1, 2024
It is worth noting that last month was quite challenging for US Bitcoin ETFs. After a promising start with positive inflows in the initial months following their launch, April witnessed collective outflows amounting to $182 million across all active spot Bitcoin ETFs in the US.
This pullback is attributed to macroeconomic concerns and geopolitical tensions, which have clouded the investment landscape.
As the market braces for further turbulence, analysts such as Micheal Van de Poppe are forecasting an additional correction, potentially pushing Bitcoin’s price down to $55,000 before any sign of recovery.
Monthly close approaching for #Bitcoin and FOMC day tomorrow.
I think we’ll see that sweep beneath $60K and potentially cascade towards $55-58K from which we’re finding the low and rotate back upwards.
From there: Ethereum ETF hype in May to pick up momentum. pic.twitter.com/Iki4De9mSF
— Michaël van de Poppe (@CryptoMichNL) April 30, 2024
Featured image from Unsplash, Chart from TradingView
Co-founder and Chief Executive Officer (CEO) of Real Vision, Raoul Pal has shed light on the current market state and the future outlook of Bitcoin, the world’s largest cryptocurrency. Despite the cryptocurrency witnessing declines of more than 15%, the financial expert has uncovered a significant pattern that indicates a potential bull flag following Bitcoin’s price correction.
In an X (formerly Twitter) post published on Tuesday, April 28, Pal shared a yearly chart depicting Bitcoin’s price movements from October 2023 to April 2024. At the time of writing, Bitcoin’s price is trading below the $60,000 mark, at $59,185, marking monthly declines of 15.12% and weekly lows of 11.31%, according to CoinMarketCap.
The crypto analyst has suggested that Bitcoin’s recent price correction was a temporary setback. He predicts that once the market fully refreshes, what he calls “the Banana zone” will kick in. He also described Bitcoin’s recent price declines as a “pause that refreshes.”
The pause emphasizes the final days of the crypto spring, a period marked by renewed optimism after bearish markets. A prime illustration of this phase occurred when Bitcoin surged to new all-time highs, surpassing $73,000 in March, following its decline from 2022 to 2023.
On the other hand, the Banana zone represents a phase characterized by intense market excitement and the possibility of significant price increases. However, Pal has described this distinctive period as “when the market begins to anoint the new big L1 or L2, which explodes even vs SOL.”
The financial expert noted that once the Banana zone commences, it may pick up momentum towards the end of the year and continue well into 2025, potentially reaching peak mania. He also shared a historical pictorial analysis illustrating his Bitcoin predictions.
In the chart, the price of Bitcoin witnessed a Banana zone rally from $1,000 to $5,000 between 2014 and 2016 and from $10,000 to $60,000 between 2019 and 2020. Basing his predictions on this unique historical pattern, Pal suggested that Bitcoin’s price action from 2022 to 2024, starting at $50,000 could potentially skyrocket to a new all-time high of $300,000.
Pal has predicted that after the crypto spring, a new season for cryptocurrencies will occur, termed “the crypto summer.” The financial expert has confirmed that this period will be the start of the altcoin season, highlighting that it is typically marked by an intense bubble in the crypto fall.
During the crypto summer, Pal projects that Ethereum would begin to outperform Bitcoin while Solana would accelerate its outperformance of both Bitcoin and Ethereum. The financial CEO disclosed that the crypto summer and fall are often confusing, as cryptocurrencies tend to adopt a narrative and may get caught up in the prevailing euphoria.
He predicts another two or more “nasty corrections” triggered by excessive leverage before the onset of the Banana zone. Additionally, Pal has indicated that three or four cryptocurrencies are set to lead the altcoin season, with one particular cryptocurrency emerging as the “Big new entrant,” much like Solana did during the previous cycle alongside Avalanche and Polygon.
Bitcoin has recently concluded April, marking its most significant monthly decline. Despite the bearish momentum, leading market analysts, including Michael van de Poppe, believe that the worst may soon be over, suggesting that Bitcoin is nearing the end of its current correction phase.
April was challenging for Bitcoin, as its value plunged nearly 20%, dipping below $57,000, the lowest level traded since late February.
This drop is part of an intense market sell-off that has slashed the combined cryptocurrency market cap by nearly 10%, bringing it down to $2.2 trillion. Amid these declines, Michael van de Poppe, a revered figure in the crypto analysis space, provided hope.
In his recent statements on the social platform X, Van de Poppe suggested that Bitcoin’s current price levels might be nearing the bottom of this correction cycle.
He highlighted the critical price range of $56,000 to $58,000 as pivotal for Bitcoin’s short-term trajectory, indicating potential areas for a rebound.
#Bitcoin is at the end of the correction.
It’s already down 20% from the highs and we’ll have some more downside to happen from here.
If the correction continues, then I think the green zones between $56-58K are essential to watch.#Altcoins to bounce before. pic.twitter.com/4Mu3NA1HSg
— Michaël van de Poppe (@CryptoMichNL) May 1, 2024
Van de Poppe isn’t alone in his optimistic outlook. Other analysts, like Checkmate, an on-chain expert, have analyzed Bitcoin’s historical data to predict future movements.
Checkmate introduced the term “chopsolidation,” describing it as a phase of stagnant yet volatile market conditions that could precede a significant bullish run.
He expects this phase to last about six months, followed by a potential 6 to 12 months of explosive growth reminiscent of past cycles. Furthermore, historical data from Bitcoin’s Halving years support the theory that after a halving event, the market tends to perform strongly towards the end of the year.
However, there are not all optimistic forecasts in the crypto realm. The spot Bitcoin ETF market witnessed over $300 million in net outflows in April, breaking a three-month streak of inflows, reflecting a broader sentiment of caution among investors.
Moreover, Charles Edwards, founder of Capriole Investments, has voiced concerns over the market’s extraordinary bullishness, warning of the necessity for corrections within such a volatile asset class.
“Sell in May and go away.” This looks like distribution to me. As long as we trade below $61.5K, scenario (1) is technically more likely. A strong reclaim of $61.5K would give some hopes to the bulls for scenario (2). A flush would also be good for the sustaining continuation of… pic.twitter.com/6E3oJ1vgs3
— Charles Edwards (@caprioleio) May 1, 2024
Featured image from Unsplash, Chart from TradingView
As May 1st started, Bitcoin (BTC) faced a new correction that made the price stumble under the $60,000 support level. The flagship cryptocurrency has seen several retraces during this bull cycle, with BTC swiftly recovering the crucial support zones each time.
However, in the past 24 hours, the largest cryptocurrency by market capitalization has struggled to regain its momentum. Some analysts believe Bitcoin’s bottom this cycle might be in as this correction officially became its deepest retrace.
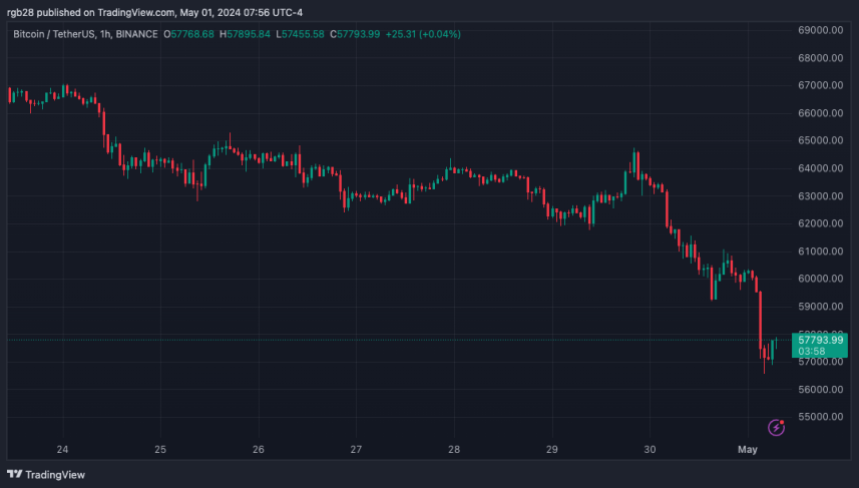
In the early hours of Tuesday, Bitcoin started to plunge from the $64,000 price range. As the day continued, BTC prolonged its fall to briefly trading around $59,958 – $59,191 before recovering.
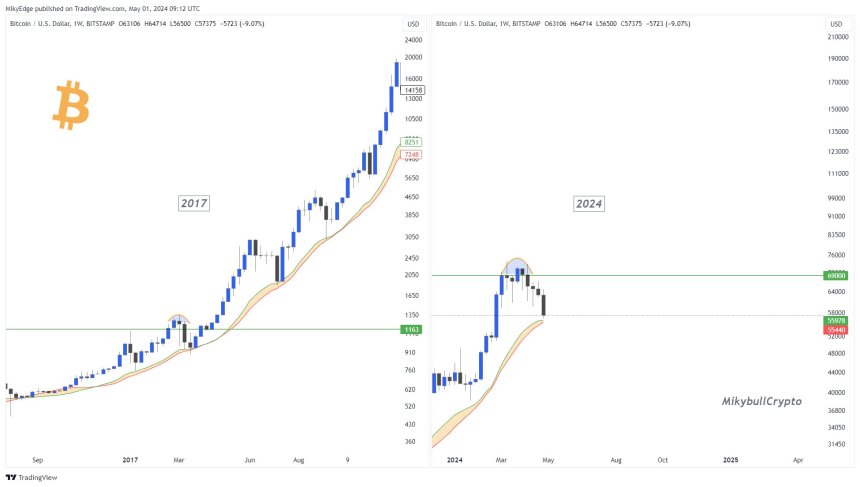
This time, the recovery didn’t last long as Bitcoin’s price resumed its downward trajectory to $57,000. In an X thread, crypto trader Milkybull examined some data suggesting the bottom might finally be in.
According to the analyst, BTC is “following the 2017 PA.” This would suggest that “either the bottom is in or close.” Moreover, he urged investors to remember that while good news “usually signals the top,” bad news signals a bull market’s bottom.
In the thread, the trader pointed out that the Bitcoin Bull Market Support Band indicator historically serves strong support during BTC’s bull cycles. As a result, he considers that the flagship cryptocurrency might “wick through the support and bounce back.”
According to the analyst, Bitcoin and global liquidity are also strongly correlated, with BTC currently at a level it has previously bounced back from. These bouncebacks initiated “huge rallies across the crypto market” in October 2022 and October 2023.
Lastly, the thread highlighted that Bitcoin “is at a critical decision point for the local bottom.” The trader considers that while some call for a $48,000 bottom, the $51,000 support level might be where BTC bounces back to resume its cycle to this cycle’s top.
According to crypto analyst and trader Rekt Capital, this correction has officially been the deepest BTC retrace this cycle. Per the post, today’s -23.64% retrace surpasses the -22.91% retrace seen in February 2023.
The analyst also compared this cycle’s “Post-Halving” pullback to 2016’s. Moreover, the trader considers that this bullish cycle might be more similar to the 2016 one than investors think.
We are here (orange circle)
And we've seen Post-Halving pullbacks like this in the past (e.g. 2016)$BTC #Bitcoin #BitcoinHalving pic.twitter.com/OvOcmJTzFk
— Rekt Capital (@rektcapital) May 1, 2024
Previously, Rekt Capital listed three reasons these two cycles might be similar. Per the trader, the resemblances include the “Pre-Halving Re-Accumulation Range Breakout,” the “Pre-Halving Retrace Beginning,” and the “Similar Initial Reaction after the beginning of the Pre-Halving Retrace.”
After today’s retrace, the analyst added the “Continued downside in the three weeks after the Halving” as a fourth similarity between the 2016 and 2024 cycles. Like eight years ago, Bitcoin faces an “additional downside below the Range Low of its Re-Accumulation Range” in the three-week window after Bitcoin’s “Halving.”
Moreover, the analyst suggests that the current price development comes “as no surprise,” as it mirrors 2016’s “post-Halving Danger Zone.”
As of this writing, the flagship cryptocurrency is trading at $57,794.89. This correction represents a 6.2% drop in the past 24 hours. Similarly, BTC is registering 13.4% and 17.7% price decreases in the weekly and monthly timeframes.

The ZPL-powered zBTC token will allow Bitcoin holders to engage with the Solana DeFi ecosystem.
On Wednesday, Bitcoin sharply declined, dropping below the crucial $60,000 support level. Despite this recent market downtrend, Bitcoin investors remain confident as they believe the flagship crypto can still reach new heights in this market cycle. Some say this might be what Bitcoin needs before making another parabolic run to the upside.
Raoul Pal, the CEO of Real Vision, reassured in an X (formerly Twitter) post that Bitcoin’s recent price decline was not unusual, stating it was “pretty ordinary stuff.” He also pointed out that this was Bitcoin’s fourth 20% correction in the past 12 months, underscoring how normal these price movements are.
Related Reading: Crypto Funds Mark 3rd Consecutive Weeks Of Outflows With $435 Million In Withdrawals
Alex Thorn, Head of Research at Galaxy Digital, had previously warned that price declines of such magnitude were to be expected, stating that “bull markets are not straight lines up.” He noted that the same thing happened in the 2021 and 2017 bull runs when Bitcoin experienced about 13 price drawdowns of over 10% or more.
Meanwhile, crypto analyst Rekt Capital claimed in an X post that “this is exactly what the cycle needs to resynchronize with historical price norms and the traditional Halving Cycle.” He added, “The longer this goes on, the better.” In another X post, he reassured his followers that Bitcoin is getting closer to its final bottom with each passing day.
Like Rekt Capital, crypto analyst Mikybull Crypto also sounded confident that Bitcoin’s recent decline was just a part of the bigger picture for its move to the upside. They claimed this would be the “final shakeout before up, only rally to a cycle top.”
Thomas Fahrer, the CEO of Apollo, also shared his bullish sentiment towards Bitcoin, as he suggested that the crypto token’s volatility is what makes it a great investment. “Price might fall to $40K, but it might rise to $400K. That’s just how it is, and it’s a great bet. Bitcoin is still the best asymmetric opportunity in the market,” he wrote on X.
Crypto analyst Ali Martinez suggested that Bitcoin’s bull run was far from over while comparing Bitcoin’s current price action to the last two halving events. According to him, Bitcoin consolidated for 189 and 87 days around the halving in 2016 and 2020, respectively, before the bull run resumed.
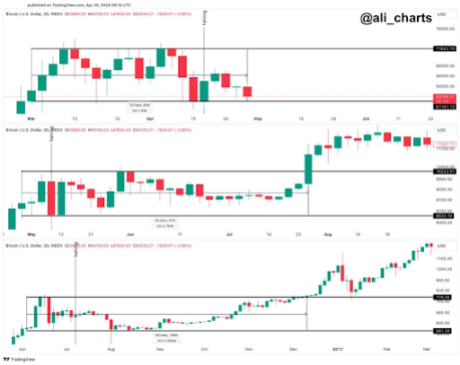
He further noted that Bitcoin has only consolidated for 60 days this time around, meaning that the flagship crypto will continue its run eventually. In a subsequent X post, the analyst stated that Bitcoin might be 538 days away from hitting its next market top if it follows its trend from the previous two bull runs.
Related Reading: Ethereum Flashes Bullish Signals, Can It Rally 50% From Here?
Before now, Martinez mentioned that Bitcoin could rise to a new all-time high (ATH) of $92,190 if it breaches the resistance level of $69,150.
At the time of writing, Bitcoin is trading at around $59,600, down over 5% in the last 24 hours, according to data from CoinMarketCap.

The Bitcoin LSTs can be used to power the Talus blockchain’s virtual artificial intelligence assistants.


