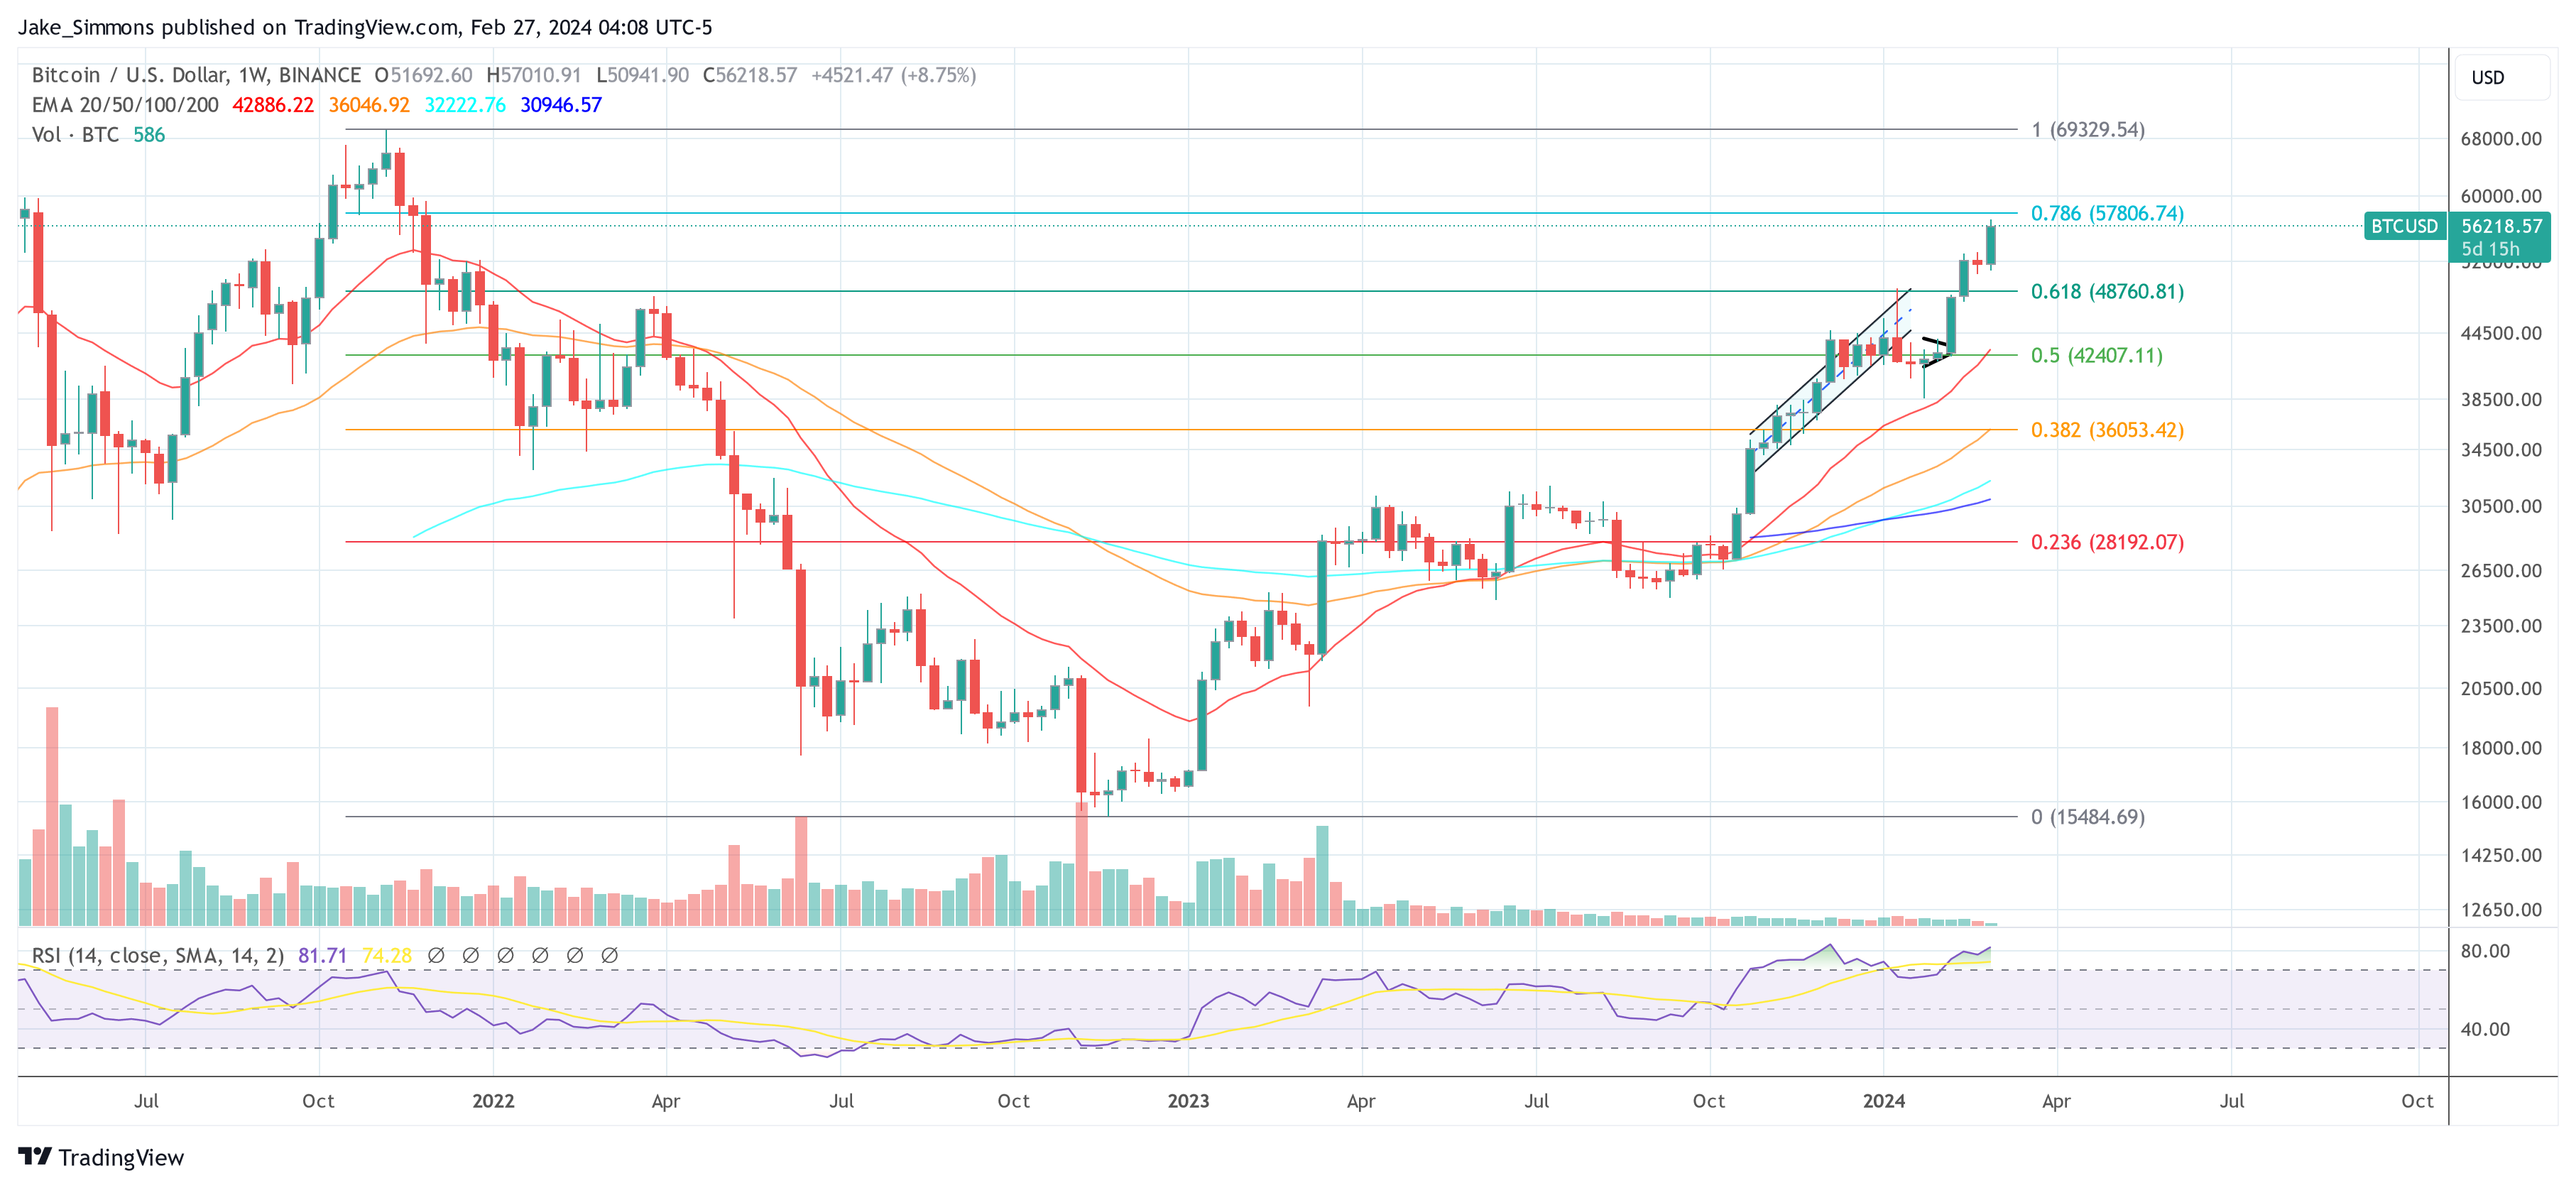
The “fear and greed” index reading is now at 87, a sign of “extreme greed.”
Expert Predicts Bitcoin At $750,000 As Fidelity Advises 1-3% Allocation
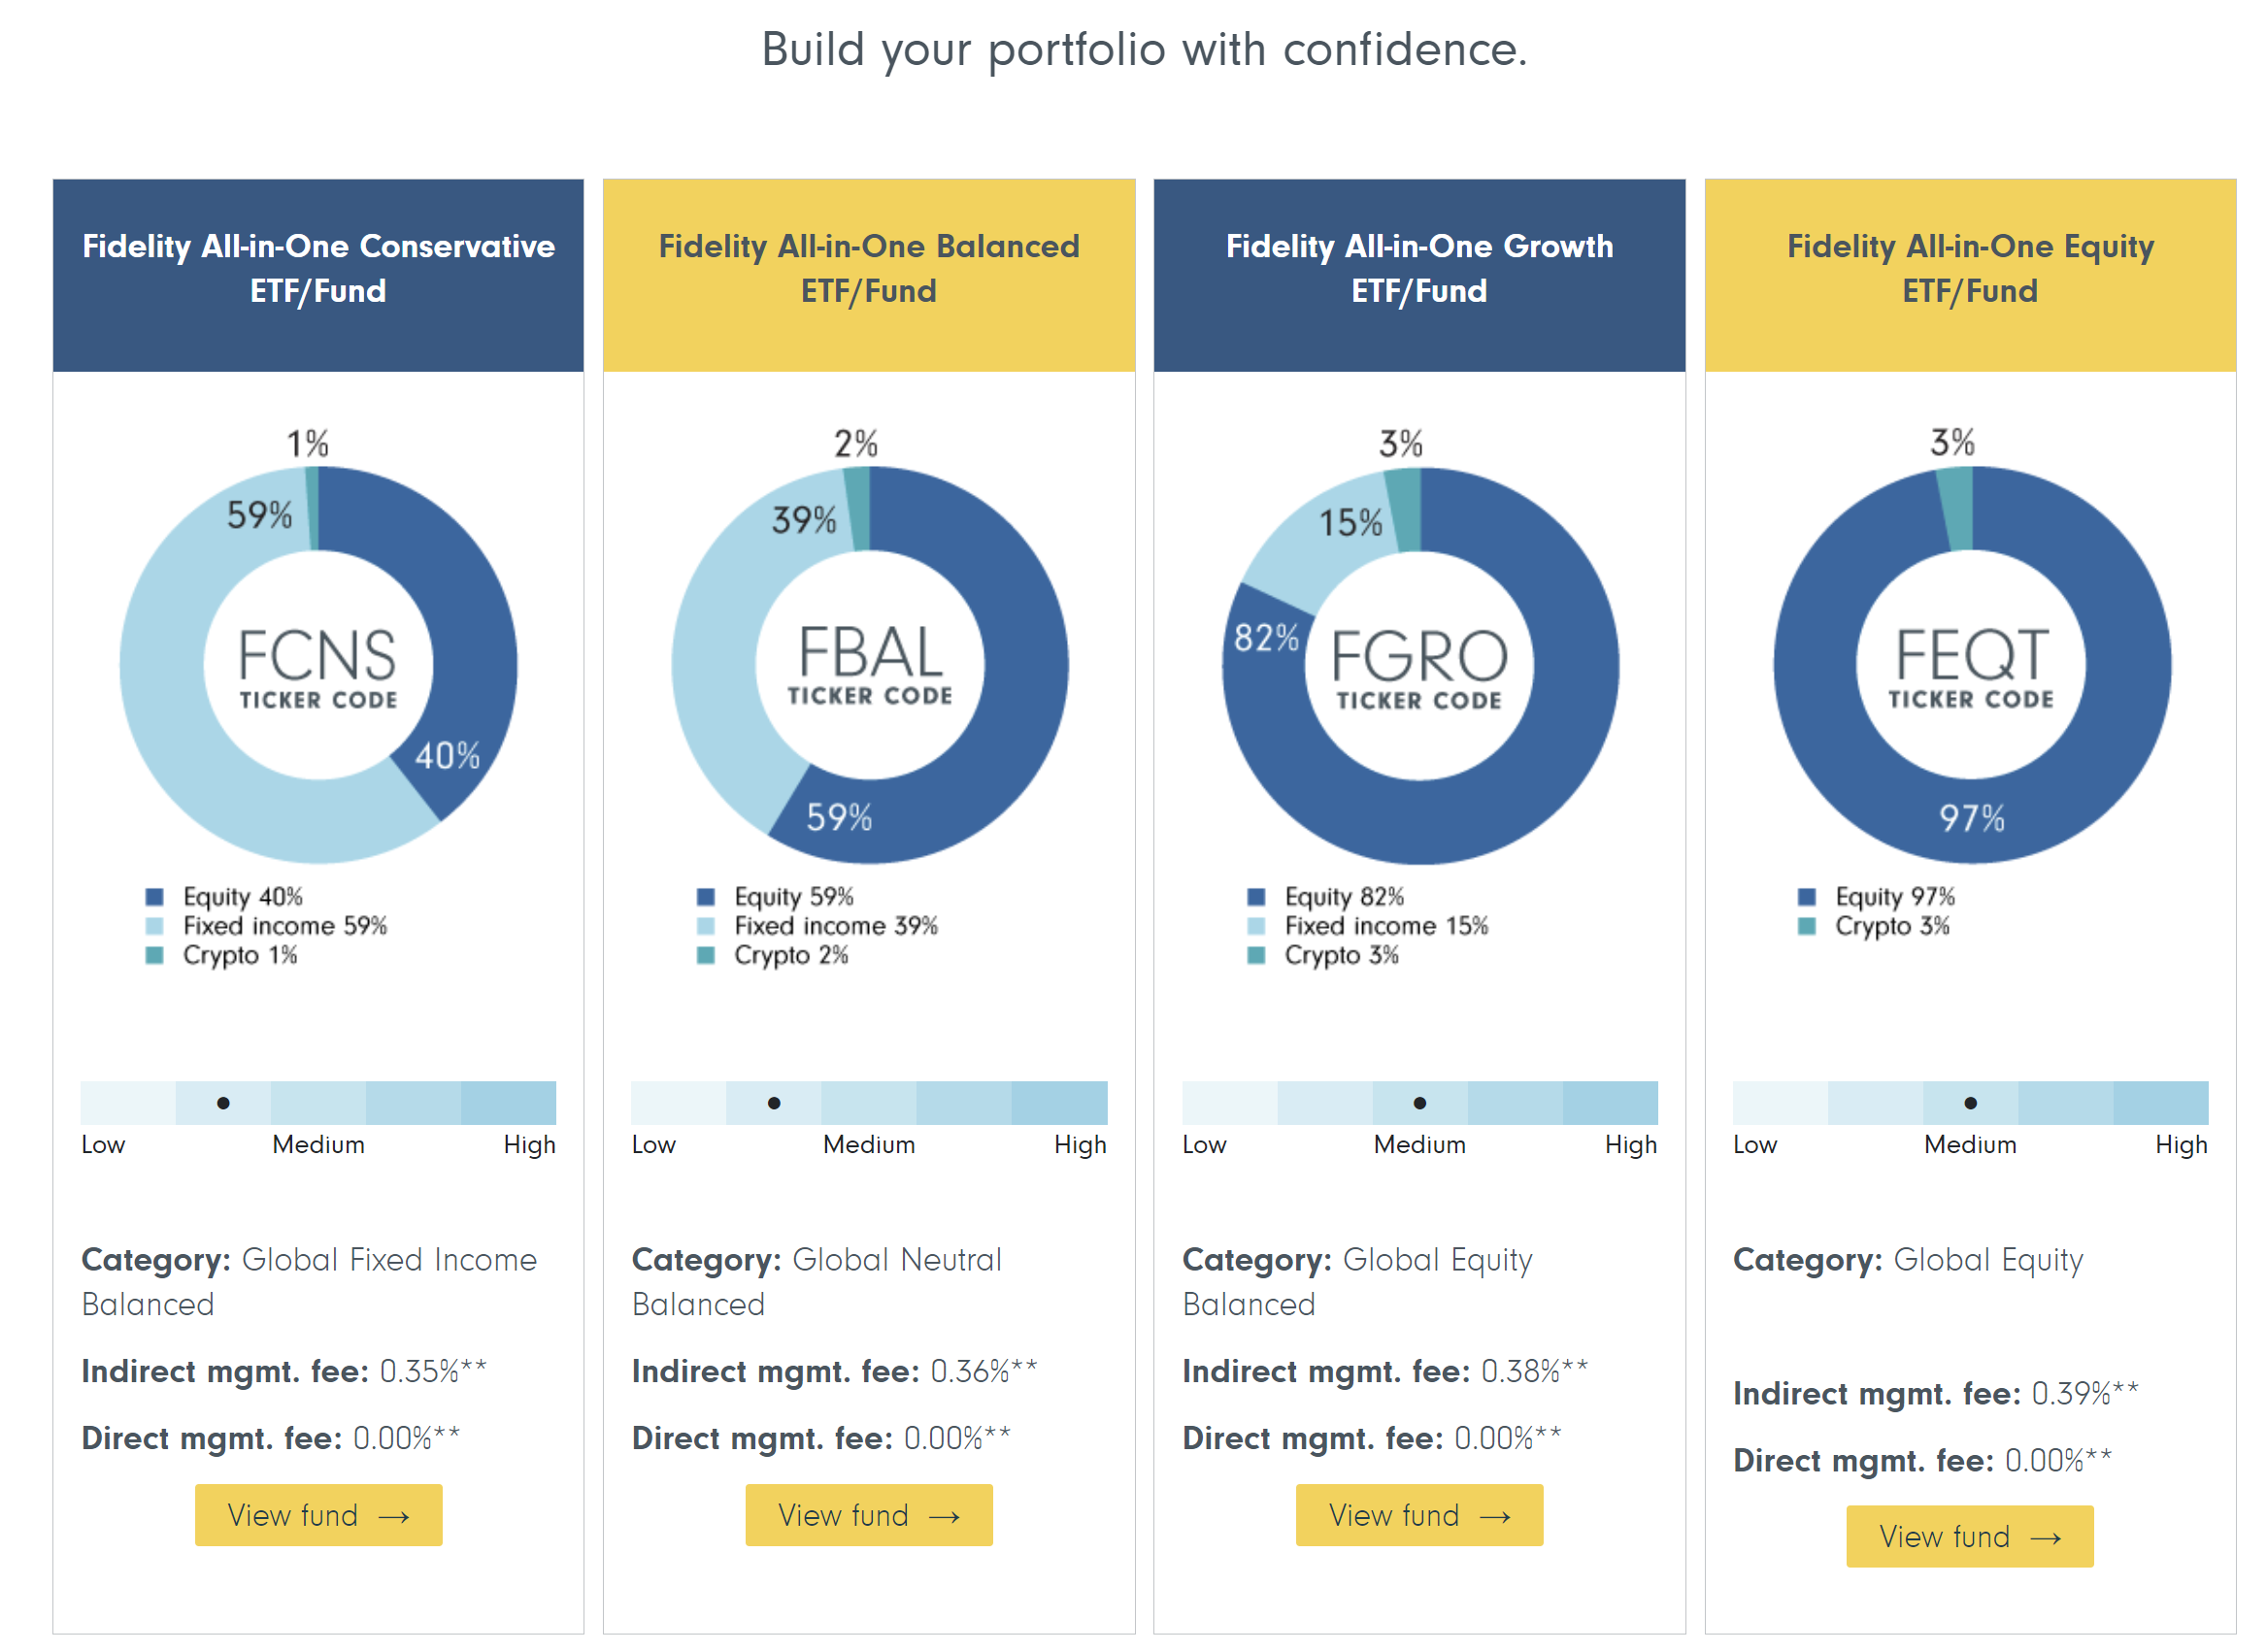
In a major shift within the financial industry, Fidelity Investments, with its colossal $12.6 trillion in assets under administration, is now recommending that the traditional 60/40 portfolio model should evolve to include a 1-3% allocation to crypto, specifically through its spot Bitcoin ETF (FBTC). This groundbreaking move is not just a nod to the burgeoning crypto market but a potential catalyst for unprecedented demand, potentially channeling hundreds of billions of dollars into Bitcoin.
Matt Ballensweig, Head of Go Network at BitGo, took to X (formerly Twitter) to express his anticipation, stating, “I’ve said this since the day of ETF approval – now that Pandora’s box has been opened, the multi-trillion dollar asset managers will sell BTC and crypto through their massive distribution channels for us. Fidelity now creates blueprint portfolios with 1-3% crypto.”
Echoing this sentiment, Will Clemente III, a renowned analyst, remarked on the potential ripple effects of Fidelity’s recommendation. “Fidelity now recommending a 1-3% crypto allocation in your portfolio. Gateway drug. What happens when that 1-3% becomes 3-6%? Slowly then suddenly,” Clemente noted, highlighting the potential for growth in crypto allocation.
What This Could Mean For Bitcoin Price
Adam Cochran, a partner at CEHV, further elaborated on the implications of Fidelity’s move for Bitcoin’s adoption and price trajectory. In a detailed analysis shared on X, Cochran laid out an ambitious future where the inclusion of crypto in traditional portfolios could lead to a substantial reevaluation of Bitcoin’s value. “How fucking wild is this to see. 60/40 portfolios are now 59/39/2,” Cochran began, underlining the historic milestone of crypto becoming a core asset class.
Cochran compares the adoption rates of the internet to cryptocurrency, stating, “Hell, the internet was 30 years in the making and didn’t reach 10m users till 1995. But the most non-conservative estimates put crypto ownership at 450M worldwide (conservative is more like 200M) that’s like the internet in 2001.”
He highlights the outsized economic impact of digital advancements, “Today the internet has somewhere around 5.5B users – 12x what it did in 2001. But according to BEA, the impact of the digital economy has been exponentially outsized with each year of growth.” By drawing this parallel, Cochran sets the stage for a crypto market that could see exponential growth in value and influence.
Cochran’s approach to calculating Bitcoin’s future valuation involves analyzing the potential influx of funds from traditional investments. “If that follows the change to 59/39/2, you’re looking at $1.6T in new buying… Given the current market is $2.24 trillion total marketcap… we get a cash to value rate of 9.3%.”
The core of Cochran’s analysis lies in his valuation prediction, where he states, “Prorata between coins at their current ratios and that’s $748,500 BTC and $43,635 ETH in raw spot buying. But since we know notional causes things to run, and we’ve got things like ETH’s yield demand and burn, we’re usually several multiples above the price of our raw spot demand.”
Cochran’s conclusion reflects a strong belief in the transformative potential of cryptocurrencies within traditional investment portfolios. “At the end of the day, even gold hasn’t broken into the 60/40 portfolio in a meaningful way, so I think blowing past the $12T mcap of gold by a good multiple over time is a no-brainer.”
At press time, BTC traded at $57,175.
XRP Sinking? A Double Blow Of Underperformance And Address Exodus
Ripple’s XRP has been struggling to regain its momentum, as its performance continues to lag behind that of its competitors in the crypto market.
Recent data from CoinMarketCap reveals that XRP has been the most underperforming large-cap cryptocurrency over the past month, with gains of just over 4%. This stands in stark contrast to the significant increases seen in cryptocurrencies such as Bitcoin, Ethereum and Solana, to name a few, leaving investors disappointed and questioning the future of the digital asset.
Are Whales Slowly Losing Appetite For XRP?
Adding to the challenges, data from Santiment indicates that XRP whales, the major holders of the cryptocurrency, have shown a lack of confidence in the digital asset. The percentage of the coin’s supply in profit has declined from almost 90% in November last year to below 80% at present.
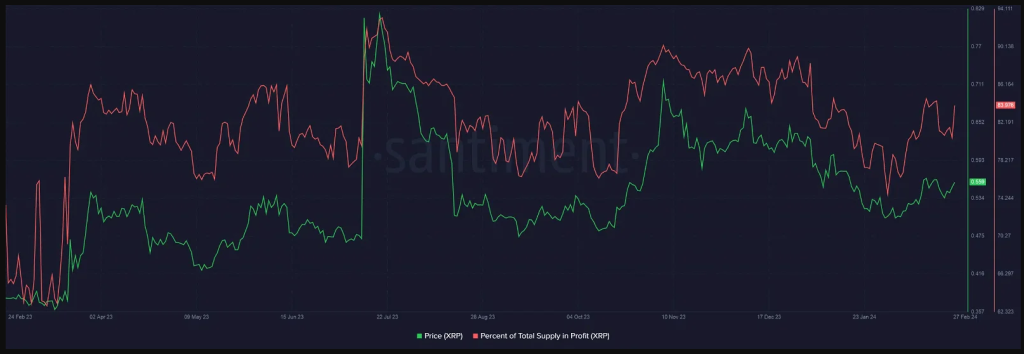
This decrease suggests that XRP whales have been selling their holdings rather than accumulating more, painting a bearish picture for the cryptocurrency’s future.
Furthermore, XRP whales have exhibited lower long exposure compared to retail investors, who are typically considered to have a better understanding of market trends. This lack of conviction among whales further dampens sentiment surrounding XRP.
Once a prominent player in the cryptocurrency market, XRP has experienced a significant decline in its influence. CoinMarketCap data highlights that XRP’s dominance in the market has plummeted from a peak of 30% in 2017 to a mere 1.48% as of February 2024.
The SEC lawsuit initiated against Ripple, the company behind XRP, along with the bear market of 2022, have taken a toll on the cryptocurrency’s value. Since reaching its peak in January 2018, XRP has lost nearly three-quarters of its market valuation, leaving investors and enthusiasts disheartened.
While the recent price action and market sentiment surrounding XRP may not inspire much optimism, the cryptocurrency landscape remains highly unpredictable. Investors and enthusiasts will closely monitor XRP’s ability to regain its footing and overcome the challenges it currently faces.
As the market continues to evolve, only time will reveal whether XRP can regain its former glory or if it will continue to struggle amidst fierce competition in the cryptocurrency space.
IMF Report Could Push XRP Price Up
Despite these challenges, there are potential catalysts that could inject positive energy into the market. A recent report from the International Monetary Fund (IMF) on the importance of digital currencies has garnered investor interest.
The report examines the potential benefits of digital money in advancing public policy goals, such as financial inclusion and improved cross-border connectivity.
Notably, the report highlights Ripple’s partnership with Palau, where they are exploring plans to launch a sovereign stablecoin. This collaboration underscores Ripple’s global reach and its involvement in the development of central bank digital currencies and sovereign stablecoins.
XRP’s struggle to regain momentum and underperformance compared to its competitors have disappointed investors. The declining influence of XRP, coupled with a lack of confidence displayed by XRP whales, further amplifies concerns about the cryptocurrency’s future.
However, potential positive developments, such as the IMF report and Ripple’s partnership with Palau, offer a glimmer of hope amidst a challenging environment.
The sixth-largest cryptocurrency was trading at $0.56 at the time of writing, and bulls’ prior attempts to break through that barrier had failed.
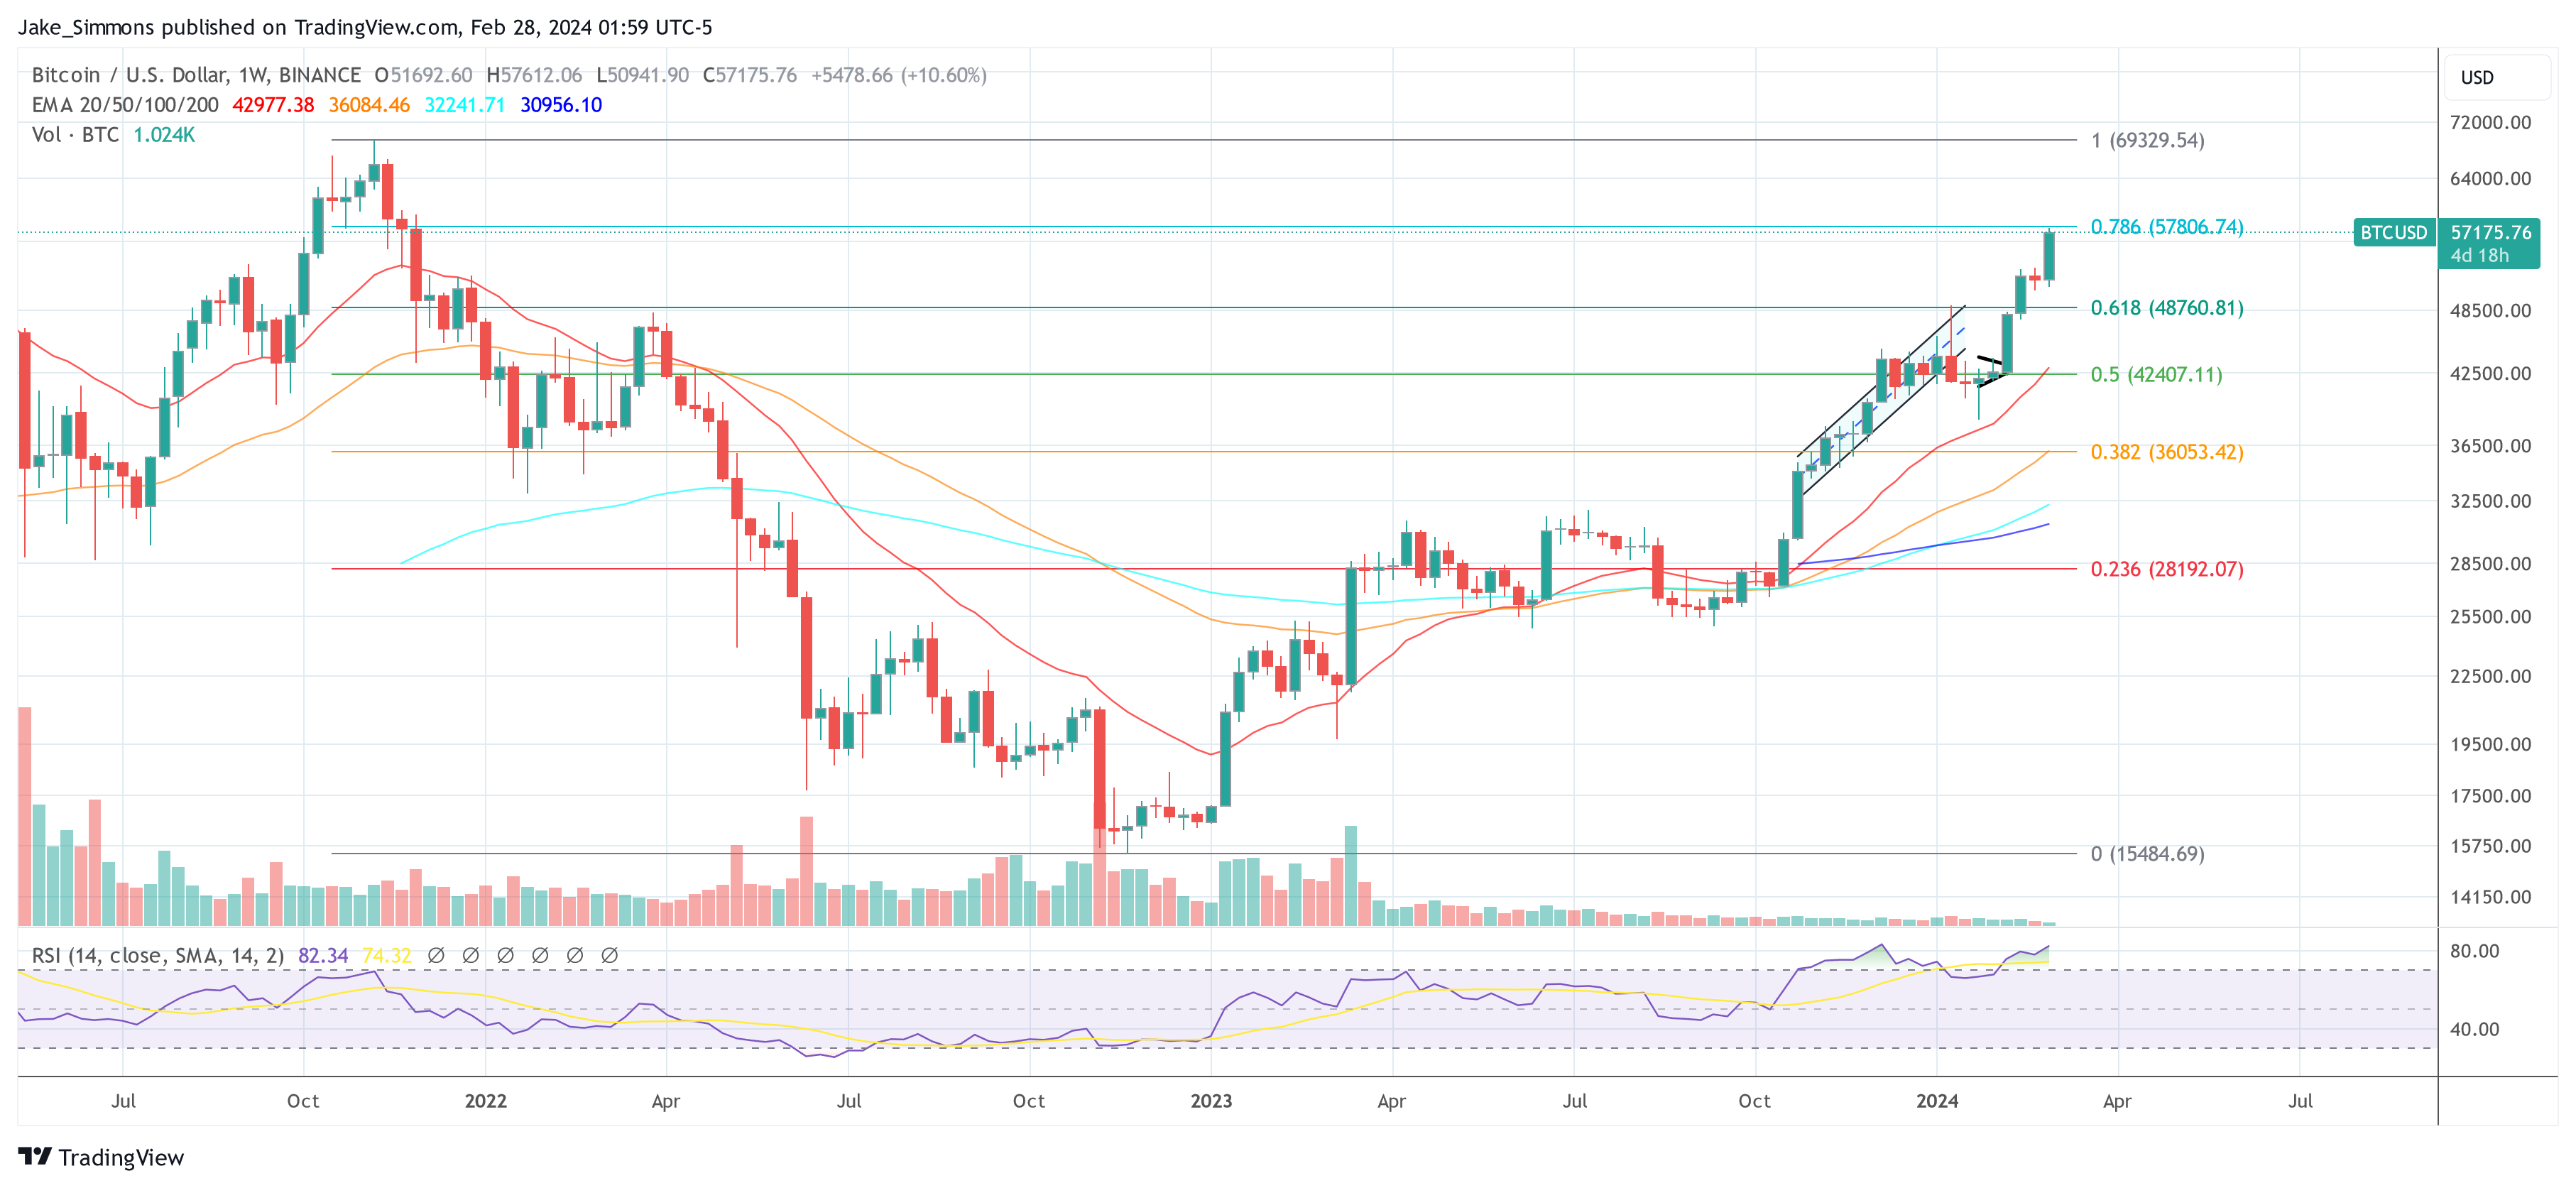
Featured image from , chart from TradingView
Bitcoin Bulls Target $69K Lifetime Highs Ahead of Halving
An expected pre-halving rally is a good spot to realize short-term profits, one market observer said.
Falling Bitcoin-Ether Spread is Music to Altcoin Traders’ Ears
The funding rate spread has collapsed, indicating increased appetite by traders to speculate further out on the risk curve, one analyst said.
PEPE Explodes 140% Today – What’s Up With This Frog-Themed Meme Coin?
Pepe Coin, the meme-inspired cryptocurrency, just doesn’t run out of surprises, skyrocketing by nearly 140% in the weekly timescale. This remarkable comeback has not only caught the attention of cryptocurrency enthusiasts but has also ignited renewed interest in meme coins as a whole.
Pepe Coin, once languishing in the shadows, has now emerged as a frontrunner in the meme coin space. Its market capitalization has soared to an impressive $1.1 billion, and analysts predict that it could potentially reach its all-time high market cap of $1.8 billion, necessitating a tenfold price appreciation from its current levels.

Pepe Coin: Speculation And Social Media Frenzy Fuel Resurgence
The crypto’s resurgence is not solely a result of market dynamics but is also driven by key factors within the meme coin ecosystem. Speculation and trading activity have played a significant role, fueled by the growing interest in Ethereum-based meme coins. Pepe Coin, with its distinctive frog-themed branding, has captured the imagination of investors and meme enthusiasts alike.
Social media platforms, particularly Twitter, have become a breeding ground for discussions surrounding Pepe Coin. The cryptocurrency has trended with over 53,000 posts dedicated to its vibrant community and its potential as a promising investment opportunity. The widespread traction on social media has further boosted Pepe Coin’s popularity and contributed to its surging value.
PEPE Whales, High-Volume Transactions Boost Profits
Notable events within the PEPE ecosystem have also contributed to its recent success. Six influential wallets executed trades, resulting in the offloading of nearly 2 trillion PEPE tokens. This high-volume transaction amounted to approximately $4.37 million in sales, generating substantial profits of around $2 million. Such significant market activity underscores the growing momentum surrounding the meme coin during this surge.
As Pepe Coin’s value continues to climb, it finds itself in the midst of a broader bullish sentiment in the cryptocurrency market. Bitcoin has reached an impressive price point of $57,000, while Ethereum trades above $3,200. This positive market sentiment provides a favorable backdrop for Pepe Coin and other digital assets, signaling a potentially lucrative period for investors.
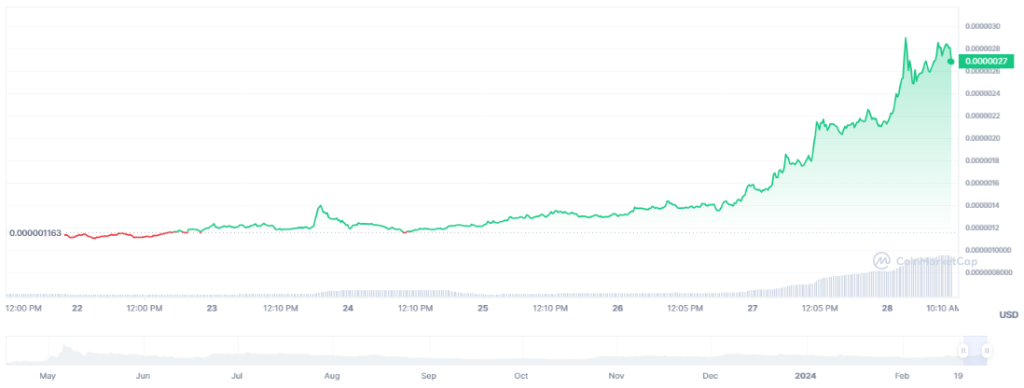
Pepe Coin, a green-colored frog-themed meme coin, was launched in May 2023 and quickly gained popularity among cryptocurrency enthusiasts. With its total supply of 420.69 trillion PEPE tokens, all of which are already in circulation, Pepe Coin stands out as a unique and intriguing player in the meme coin market.
PEPE’s recent surge of over 140% and its ascent to a market cap of over $1 billion showcases the growing influence of meme coins in the cryptocurrency landscape.
Featured image Pexels, chart from TradingView
Bitcoin Price Consolidates Gains, Can BTC Extend Rally To $60K?
Bitcoin price rallied further toward $58,000. BTC is now consolidating gains and might soon attempt more gains toward the $60,000 resistance.
- Bitcoin price is consolidating gains below the $57,500 resistance zone.
- The price is trading above $56,000 and the 100 hourly Simple moving average.
- There is a rising channel forming with resistance near $57,650 on the hourly chart of the BTC/USD pair (data feed from Kraken).
- The pair could extend its current rally toward the $60,000 resistance zone.
Bitcoin Price Faces Fresh Hurdle
Bitcoin price extended its rally above the $55,000 resistance zone. BTC gained bullish momentum after it broke the $55,500 and $56,000 resistance levels. There was also a spike above the $57,000 resistance zone.
A new multi-week high is formed near $57,572 and the price is now consolidating gains. There was a minor decline below the $57,000 level, but the price is still above the 23.6% Fib retracement level of the recent wave from the $50,950 swing low to the $57,572 high.
Bitcoin is now trading above $56,000 and the 100 hourly Simple moving average. Immediate resistance is near the $57,200 level. The next key resistance could be $57,500.
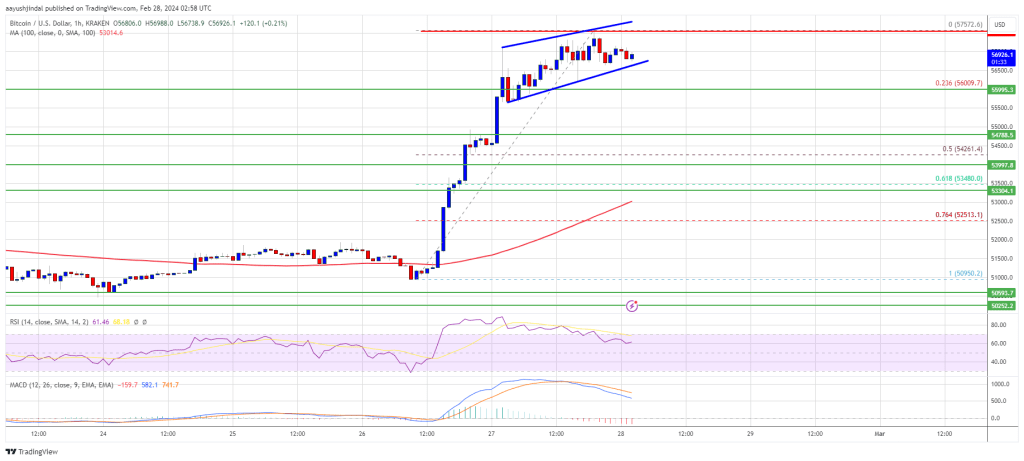
Source: BTCUSD on TradingView.com
There is also a rising channel forming with resistance near $57,650 on the hourly chart of the BTC/USD pair, above which the price could rise toward the $58,000 resistance zone. If the bulls remain in action, the price could even surpass $58,000 and test $58,800. The main hurdle for them is visible near the $60,000 zone.
Are Dips Supported In BTC?
If Bitcoin fails to rise above the $57,500 resistance zone, it could start a downside correction. Immediate support on the downside is near the $56,800 level.
The first major support is $56,000. If there is a close below $56,000, the price could start a decent pullback toward the 50% Fib retracement level of the recent wave from the $50,950 swing low to the $57,572 high at $54,250. Any more losses might send the price toward the $53,200 support zone.
Technical indicators:
Hourly MACD – The MACD is now losing pace in the bullish zone.
Hourly RSI (Relative Strength Index) – The RSI for BTC/USD is now above the 50 level.
Major Support Levels – $56,800, followed by $56,000.
Major Resistance Levels – $57,500, $57,650, and $58,000.
Bullish Forecast: Analyst Predicts Surge To $88,000 As Bitcoin Hits Highest Level In Two Years
With Bitcoin recently surpassing the $57,000 mark, marking its highest level since 2021, a surge in bullish outlook among analysts and experts has emerged.
Bitcoin To $88,000
Among them is Ryan Rasmussen, a Senior Crypto Research Analyst at Bitwise, who recently shared his insights during an interview with Yahoo Finance. Rasmussen projected a bullish trajectory for Bitcoin, foreseeing a potential price surge to $88,000 by the close of 2024.
According to Rasmussen, Bitcoin trading at this price mark is possible, citing factors such as excitement and bullish sentiment surrounding the upcoming halving event and future traders taking bullish positions.
Rasmussen noted, disclosing Bitwise’s prediction for 2024:
We think that Bitcoin will certainly set all time highs in 2024. That previous price is right around $69,000 but we don’t think its going to stop there, we think we’ll at least see a 10% to 15% bump over the last all time highs in 2024. That will take us to the mid $80,000 range so I think our target was $88,00 by 2024, and I’m still sticking by that.
Despite Bitcoin trading below Rasmussen’s projected $88,000 mark, it maintains a bullish trend, with recent highs surpassing $57,000. Other analysts, including legendary trader Peter Brandt, share this optimism and predict a $200,000 target for the current bull market cycle.
Additionally, crypto analyst Ali has identified a “megaphone pattern” on Bitcoin’s daily chart, suggesting the potential for a substantial rally towards $60,520 if $50,000 to $53,000 price levels are maintained.
Ethereum’s Momentum Surges
Notably, aside from Bitcoin, Rasmussen also talked about Ethereum. So far, Ethereum’s price has outperformed that of Bitcoin.
Rasmussen attributed this surge in Ethereum’s value to speculation surrounding approving a spot Ethereum exchange-traded fund (ETF) in the US and the DenCun upgrade scheduled for March, which is expected to reduce transaction costs.
However, regardless of Ethereum’s optimism, Rasmussen cautioned that the approval of Ethereum spot ETFs might not be as straightforward as BTC spot ETFs.
He pointed out the reluctance of the US Securities and Exchange Commission’s Chair, Gensler, towards spot Bitcoin ETFs, suggesting a similar stance towards Ethereum.
Rasmussen also noted that the recent Grayscale lawsuit may not have the same positive impact on Ethereum spot ETF approval as it did for Bitcoin. Looking ahead, he estimated a 50% chance of approval or rejection for Ethereum spot ETFs in May.
The introduction of BTC spot ETFs has already significantly impacted the market, with billions flowing into spot Bitcoin ETFs. Should Ethereum spot ETF get approved, Rasmussen anticipates a similar demand for Ethereum spot ETFs, which could drive buying pressure and potentially increase prices.
Featured image from Unsplash, Chart from TradingView
Man Who Laundered Billions in Bitcoins Says Bitcoin Fog Was a Help: Bloomberg
Ilya Lichtenstein, one of the crypto industry’s most high-stakes criminals, is now helping federal prosecutors in their case against Bitcoin Fog, one of the mixing services he said he’d used to conceal assets.
Bitcoin-Focused Payments App Strike Rolls Out Services to Africa
Bitcoin-focused payments firm Strike is expanding its services to African countries including Nigeria, South Africa and Zambia, the company announced in a blog post Tuesday.
Bitcoin Maximalist Forecasts ‘God Candle’ Formation Propelling BTC To $100,000
Bitcoin (BTC) has witnessed a remarkable ascent, surpassing the $57,000 mark and recording a year-to-date surge of over 142%. The cryptocurrency’s market capitalization has also surged towards $1.14 billion, reaching levels not seen since December 2021. With the previous all-time high (ATH) of $69,000 within sight, the bullish sentiment surrounding Bitcoin is becoming increasingly evident.
Setting Eyes On $100,000 And $200,000.
Prominent Bitcoin maximalist Max Keiser, known for his optimism even during the harshest bear markets, has suggested the possibility of a “God Candle” scenario given the current market conditions.
To provide further context, this term describes a vast and powerful candlestick pattern on a price chart that indicates a significant and sudden price movement. According to Keiser, if such a pattern were to emerge, it could propel Bitcoin toward the $100,000 price level, shattering its previous record.
Traders and analysts interpret a “God Candle” as a highly bullish signal, reflecting robust buying pressure and the potential for a trend reversal or continuation. It often signifies a notable shift in market sentiment and catalyzes further price appreciation.
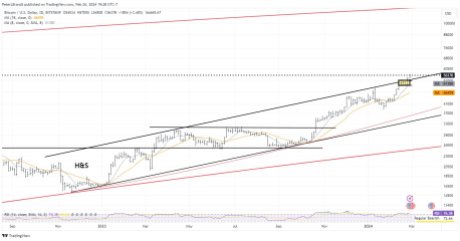
Adding to the optimistic outlook for Bitcoin, crypto analyst Gert van Lagen has projected a target of $200,000 for BTC. Analyzing the 1-week chart, van Lagen notes that Bitcoin’s price has been following a “parabolic trajectory” since November 2022 and is on track to reach $200,000 soon.
According to the analyst, this parabolic pattern aligns with the previous fifth sub-waves that have historically similarly intersected the blue trendline, as seen in the chart below.
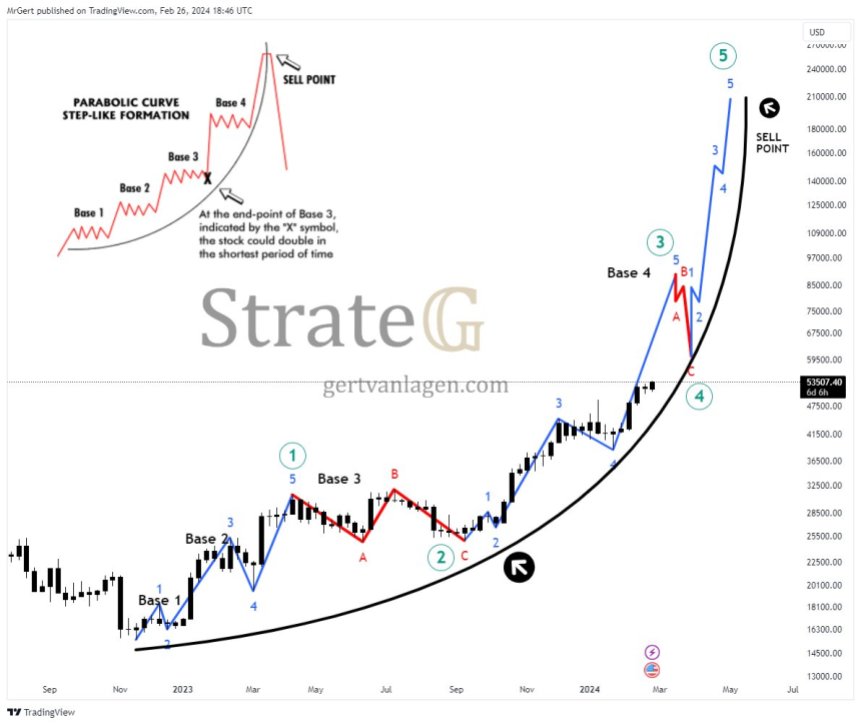
Notably, van Lagen points out that a breach of the 78.6% Fibonacci retracement level, which Bitcoin has already crossed, tends to trigger an immediate parabolic spike.
Finally, the analyst highlights the rising risk-on sentiment in the stock market and the strong correlation between Bitcoin and the S&P 500 since late 2021 as additional support for this bullish forecast.
Bull Market Cycle For Bitcoin Until 2025?
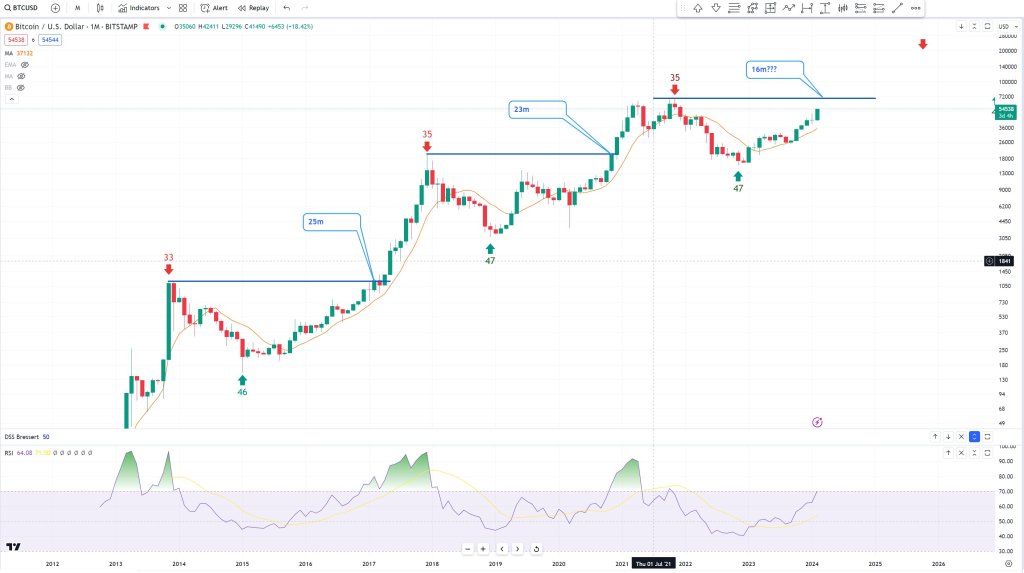
Renowned market expert Peter Brandt revised his Bitcoin price target in a recent post on social media X (formerly Twitter), raising it from $120,000 to $200,000.
Brandt attributes this adjustment to Bitcoin’s recent breakthrough above the upper boundary of a 15-month channel, indicating a potential bull market cycle until August or September 2025. However, the analyst says a close below last week’s low of $50,600 would invalidate this interpretation.
As Brandt points out, the $50,600 price level represents a 1-week resistance level for the largest cryptocurrency on the market, which, in the event of a price correction, as has historically happened whenever a sudden price spike occurs in BTC’s price action, Bitcoin would likely retest the $49,900 support level on its weekly chart. A drop towards $47,000 could be imminent in a more extreme scenario.
However, with Bitcoin currently trading at $56,800, up 4.2% in the last 24 hours, its bullish uptrend seems far from over, potentially leading to a parabolic continuation of its price, as van Lagen and other analysts suggested.
Featured image from Shutterstock, chart from TradingView.com
Bitcoin Approaching “Escape Velocity” That Will Take Prices Past $70,000: Analyst
With the Bitcoin price rallying, one analyst has taken to X, highlighting the current state of bullish affairs. In a post, the analyst thinks the world’s most valuable coin is approaching “escape velocity,” with price action deviating from candlestick arrangements in the past. This is usually the case, especially when prices are approaching all-time highs.
Will Bitcoin Rip Past $70,000 In Coming Days?
The analyst notes that a normal BTC cycle would, at current prices and considering how the coin has been rallying in the past few weeks, typically have seen a pullback. The correction would then be followed by an extended period of consolidation, often stretching at least six months.
However, since there is a clear deviation, looking at price action in the monthly chart, the analyst is convinced that Bitcoin is about to lift off. The resulting rally would be at “escape velocity,” the coin would easily extend gains, easing past all-time highs.
Bitcoin is firmly in an uptrend at spot rates, looking at events in the daily chart. Specifically, Bitcoin trades above $57,200 when writing, registering new 2024 highs. Over the past day, the coin has broken above key resistance levels, easily breaking $53,000 and later $55,000 in a buy trend continuation formation.
Rising Funding Rates And Open Interest As Institutions Double Down
With soaring interest, exchange data shows that there has been a spike in annualized funding rates and open interest across multiple platforms, enabling the trading of Bitcoin perpetual futures. Data from Coinglass shows that the funding rate in Binance is now at over 0.0686%. The same has been observed with open interest, which now stands at over $6.2 billion on Binance.
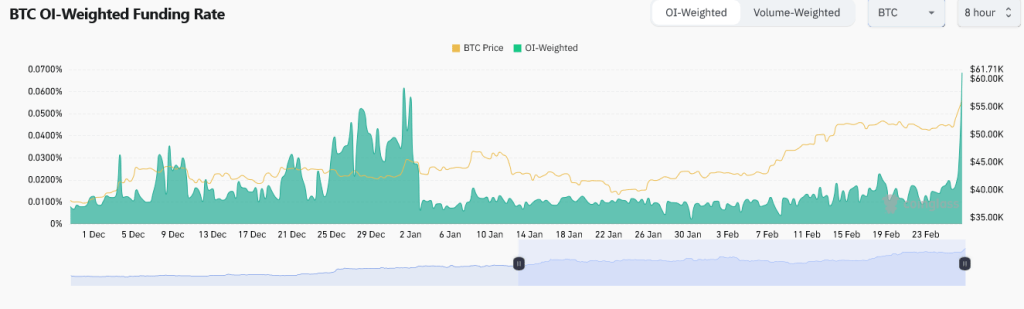
Changes in open interest and funding rates are leading indicators that can be used to gauge market sentiment. Usually, rising open interest and funding rates suggest increasing bullish sentiment, especially among leverage traders. In this scenario, the possibility of prices maintaining the uptrend remains high.
Confidence among traders is exceptionally high. It is fueled by recent institutional developments, macro factors, and the expectations ahead of the incoming halving event. For context, the ten approved spot Bitcoin exchange-traded funds (ETFs) in the United States have since received billions.
Observers now worry that at this pace, and ahead of the Bitcoin halving event, there would be a supply shock crisis. The concern is that after April, the number of coins released will be way less than those being gobbled by institutions. BTC prices will likely rally out of this, which will be out of reach for ordinary folks.
95% Of Bitcoin Now In Profit: Why This Could Be A Signal To Sell
On-chain data shows the Bitcoin supply in profit has reached levels that led to some tops in the past, like the peak of the April 2019 rally.
Bitcoin Supply In Profit Has Shot Up Following BTC’s Latest Run
As pointed out by an analyst in a CryptoQuant Quicktake post, Bitcoin supply in profit has hit very high levels after the asset’s latest rally. The “supply in profit” here refers to a metric that measures the percentage of the total circulating BTC supply that’s currently carrying some amount of unrealized gain.
This indicator works by going through the transaction history of each coin (more precisely, each UTXO) on the blockchain to see what price it was last moved at. Assuming that the previous transfer of the coin was the last time it changed hands, the price at that instance would act as its current cost basis.
As such, if the previous transfer price for any coin was less than the spot value of the cryptocurrency right now, then that particular coin would be holding a profit currently. The supply in profit sums up all such coins and calculates what percentage of the total supply they make up for.
A counterpart indicator called the “supply in loss” does the same for coins of the opposite type (that is, those with a cost basis lower than the current price). This metric’s value can also simply be found by subtracting the supply in profit from 100 (since the total supply must add up to 100%).
Now, here is a chart that shows the trend in the Bitcoin supply in profit over the past few years:

As displayed in the above graph, the Bitcoin supply in profit has naturally shot up recently as the asset’s price has gone through its rally. After the latest continuation of the run towards the $57,000 level, the metric has hit the 95% mark.
This means that 95% of all UTXOs in existence is carrying a profit at the moment. This may not entirely be a positive thing, however, if history is anything to go by.
As the quant has highlighted in the chart, the BTC rally that started in April 2019 topped out just as the supply in profit hit the same high levels as right now. Similarly, the local top in 2020 at the beginning of the last bull market also coincided with these levels.
The reason behind this pattern is likely to be the fact that investors in profit are more likely to sell their coins at any point. Thus, when a large percentage of holders are carrying gains, the probability of a mass selloff can spike up.
That said, in the 2017 and 2021 bull runs, as well as during the November 2021 peak, the indicator did manage to surpass these levels for a while before the top was encountered.
As such, it remains to be seen if the current rally is similar to the likes of the April 2019 run, in which case a top might be hit here, or if it’s a proper bull run, meaning that there might still be a while to go before the peak.
BTC Price
At the time of writing, Bitcoin is trading around the $56,500 level, up 8% over the past week.
MicroStrategy Is a Timely Play on Bitcoin Halving; Initiate at Buy: Benchmark
A price target of $990 is based on the assumption that bitcoin will reach $125,000 by year-end 2025, the report said.
Bitcoin Spot ETF Inflows Eye New Record As BTC Price Touches $57,000
Bitcoin Spot ETFs are gunning for a new record after an incredible start to the new week. The price of BTC has risen 8% in the last day, and this has caused euphoria in the market. There could be a number of factors behind this; however, institutional investors seem to be playing a big role as daily inflows continue to rise.
Spot Bitcoin ETF Inflows Cross $400 Million
According to Bloomberg analyst James Seyffart, the Spot BTC ETF inflows are not slowing down. In a screenshot shared by the analyst on Tuesday, Seyffart reveals that inflows into Spot BTC ETFs climbed above $400 million.
The image shows that the Fidelity Wise Origin Bitcoin Fund is leading the charge with $243.3 million in inflows, which accounts for more than 50% of the total inflow. The ARK 21Shares Bitcoin ETF follows behind with significant inflows of $130.6 million. The third-largest inflow to a single fund for the day was recorded in the Bitwise Bitcoin ETF, which saw $37.2 million in inflows.
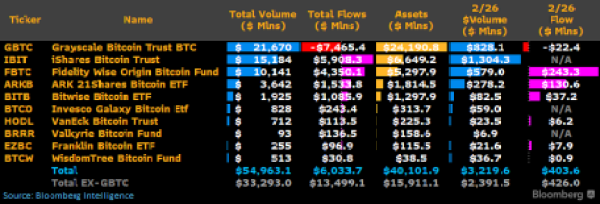
Other funds, including the Franklin Bitcoin ETF, VanEck Bitcoin Trust, and the WisdomTree Bitcoin Fund, all saw minor inflows of $7.9 million, $6.2 million, and $0.9 million, respectively. In total, the inflows to all six funds came out to $426 million.
However, the Grayscale Bitcoin Trust (GBTC) continues to bleed during this time, with outflows of $22.4 million in the 24-hour period. This brought the total net flows to $403.6 million. At the same time, funds such as the iShares Bitcoin Trust, the Invesco Galaxy Bitcoin ETF, and The Valkyrie Bitcoin Fund all saw negligible inflows during this time frame.
Gunning For A New Record
The inflows into the Bitcoin Spot ETFs over the last day are a testament to the demand that these products are getting from the market. With institutional investors gaining more exposure to BitBTCcoin, demand is expected to rise, especially as the BTC price continues to do well.
The inflow volumes, while not the largest single-day inflows so far, are significant when measured up to others. For example, Seyffart points out that the daily record was from the first day of trading when inflows climbed as high as $655 million. The second-largest single-day net flow was then recorded earlier in the month on February 13 with $631 million. “A big day from $IBIT could push us beyond that Day 1 record,” Seyffart declared.
At the time of writing, the BTC price is experiencing a retracement after reaching a new 2-year high of $57,000. It has seen 8.58% gains in the last 24 hours to trade at $55.900, according to data from CoinMarketCap.
First Mover Americas: Bitcoin’s Bitfinex-Led Surge
The latest price moves in bitcoin (BTC) and crypto markets in context for Feb. 27, 2024. First Mover is CoinDesk’s daily newsletter that contextualizes the latest actions in the crypto markets.
Bitcoin Fear & Greed Index Reaches Highest Level Since 2021, What To Expect Next
The Bitcoin Fear & Greed Index has risen to its highest level in almost three years, hitting Extreme Greed at rocket speed. Using past performance and indicators, it is possible to deduce where the BTC price is headed next after reaching this new milestone.
Bitcoin Fear & Greed Index At New 2-Year High
The Bitcoin Fear & Greed Index is a measure of investor sentiment and how they are looking at the market. This can help to figure out if investors are currently putting money into the market or if they are taking money out of it.
There are five major categories across the Fear & Greed Index, including Extreme Fear, Fear, Neutral, Greed, and Extreme Greed. The index is ranked on a scale of 0-100, with a range of numbers representing a category of investor sentiment.
Extreme Fear is the lowest on this scale, which ranges from 0 to 25. Then, from 26 to 46, we have the Fear. Both of these categories indicate an unwillingness of investors to enter the market and have often presented as the best time to invest in crypto.
Next on the scale is 47 to 52, which represents the Neutral territory. Then 53 to 75 is Greed when investors are beginning to feel confident in the market. Finally, 76 to 100 is Extreme Greed, which represents peak bullishness. As the Bitcoin Fear & Greed Index currently sits at 79, which is Extreme Greed, it could carry some implications for the market.
Extreme Greed Marks The Top?
Just as the Bitcoin Fear & Greed Index can be helpful in determining what is a good time to buy, it can also provide pointers for when a market top might be in. Looking through the historical performance of the crypto market compared to the Fear & Greed Index, we see a persistent correlation between peak euphoria and the market top.
The most recent example of this is November 2021, when the index’s score climbed to as high as 84, just 5 points shy of the current 79 score. At this point, the price of Bitcoin had risen to $69,000 before meeting resistance, which it will eventually succumb to,
In the following days, sentiment would begin turning, as did the price of Bitcoin. A similar pattern was also seen in February and March 2021 when the index hit a high of 94. The next few days saw interest taper off, marking the peak at that particular point.
If the same pattern were to be repeated in this scenario, then Bitcoin could have another few days of runway before it blows off top. Presently, the cryptocurrency is already seeing significant resistance at $57,000, which could suggest that the top is near.
Bitcoin Price Soars: Analyst Sets 2025 Price Target At $200,000
Bitcoin, the largest cryptocurrency asset by market cap, suddenly took off on Monday, reaching the $57,000 price mark for the first time in the last 26 months, prompting several predictions of a new all-time high before the end of 2025.
Bitcoin Could Hit $200,000 Before 2025 Closes
Amid the recent market surge, cryptocurrency analyst and Chief Executive Officer(CEO) of Factor LLC, Peter Brandt, has expressed his optimism towards Bitcoin, while sharing an intriguing prediction with the crypto community on the social media platform X (formerly Twitter).
Peter Brandt’s analysis delves into Bitcoin’s recent price action and how high the crypto asset could go before 2025 closes. With BTC’s current bull market cycle, Brandt has set an ambitious goal of $200,000 next year.
Brandt’s initial Bitcoin price target for 2025 was $120,000, but with the recent rally, he has placed his mark at the aforementioned price. His modifications came in light of BTC exhibiting a bullish trend, surpassing the “upper boundary of the 15-month channel.”
Furthermore, he highlighted that the current market bull cycle might “end in August or September 2025” if this bullish trend continues. However, according to him, this interpretation will be void if there is a Bitcoin “close below last week’s low.”
The post read:
With the thrust above the upper boundary of the 15-month channel, the target for the current bull market cycle scheduled to end in August or September 2025 is being raised from $120,000 to $200,000. A close below last week’s low will nullify this interpretation.
The analyst’s daring predictions have since caused quite a stir within the crypto space. Several community members have expressed their pleasure in the crypto expert’s analysis.
A pseudonymous X user commented on Brandt’s forecast, saying his overview shares “fascinating insights into Bitcoin’s market projection.” They asserted that “the upward momentum breaking through barriers is indeed intriguing.”
Additionally, they also believe that a close below last week’s low would change Brandt’s narrative, which will highlight the fragile balance in the cryptocurrency space.
Factors That Could Be Responsible For BTC’s Rally
BTC’s current rally is believed to be buttressed by several developments that have garnered attention in the crypto market today. These include increased demand from investors through Exchange-Traded Funds (ETFs) and additional BTC purchases by Microstrategy.
It is noteworthy that since the start of the year, investors’ demands through ETFs have served as a major support for BTC. On January 11, the United States Securities and Exchange Commission (SEC) approved 11 Bitcoin spot ETFs, which has triggered confidence ever since.
Meanwhile, Michael Saylor’s Microstrategy made an additional 3,000 BTC purchase, valued at $155 million before the uptick. This development suggests institutional interest in BTC, indicating confidence in its long-term potential.
Over the past day, the price of Bitcoin has increased by more than 9%, and it is presently trading at $56,321. Its market cap is up by 9% and its trading volume is up by over 235% in the last 24 hours.
Ethereum Outperforms Bitcoin As Institutional Investors Clamor For ETH Exposure
Reports have revealed that institutional investors are shifting their focus to Ethereum, displaying a preference compared to the largest cryptocurrency, Bitcoin. Despite Bitcoin’s recent rally to over $55,000, Ethereum’s unique features and potential developmental capabilities continue to capture institutional players’ interest.
Institutions Favor Ethereum Over Bitcoin
On February 24, cryptocurrency exchange, Bybit, published a research report on its users’ asset allocation. The research examined investors’ hodling and trading behaviours, covering the period from July 2023 to January 2024. Bybit’s report also provided valuable insights into investors’ asset allocation across cryptocurrencies such as altcoins, stablecoins and meme coins, shedding light on the specific coins users are currently bullish or bearish on.
According to the research report, Ethereum has unexpectedly emerged as the primary cryptocurrency choice for institutional investors. The report revealed that “institutions are betting big on Ethereum,” allocating more of their funds to ETH compared to BTC.
Bybit has disclosed that the recent rise in interest in Ethereum began in September 2023, when ETH was still trading around $2,000. Subsequently, Ethereum’s market sentiment became more bullish, experiencing a surge in investor interest to about 40% by January 2024. The crypto exchange has confirmed that, as of January 31, ETH has become the single largest cryptocurrency held by institutions.
Bybit’s report also revealed that institutional investors’ interest in Bitcoin began to wane following the United States Securities and Exchange Commission (SEC) approval of Spot Bitcoin ETFs on January 10, 2024. At the time, Bitcoin had experienced massive selling pressures, resulting in investors trimming their BTC holdings to favour other cryptocurrencies.
The excessive allocation of Ethereum is reportedly attributed to investors anticipating a favourable outcome from Ethereum’s upcoming Decun Upgrade, slated to launch in March 2024.
Notably, Bybit has disclosed that it is still being determined if the recent shift to Ethereum is a short-term manoeuvre or a more prolonged move. However, the approaching Bitcoin halving in April potentially adds a layer of bearish risks, as projections indicate Bitcoin’s significant rise in value to new all-time highs during the halving phase.
Retail Investors Think Otherwise
Bybit’s research report also examines the asset allocation trend for retail investors on the cryptocurrency exchange. The report revealed that retail investors are significantly more bullish on Bitcoin than Ethereum, allocating more funds into BTC than ETH despite Ethereum’s recent surge in value.
Over the past week, Ethereum has experienced a substantial hike in its price, jumping over 7% and outpacing Bitcoin, suggesting a potential for a more extensive upward trajectory. At the time of writing, Ethereum is trading at $3,227, reflecting a 4.05% increase in the last 24 hours, according to CoinMarketCap.
While Ethereum’s massive rally has successfully elevated the sentiment among institutional investors, retail investors remain less swayed, opting to hold onto or incorporate additional Bitcoin into their diversified portfolio of digital assets.
Bitwise CEO: Bitcoin Had Its ‘IPO Moment’, What It Means For Price
In a statement via X (formerly Twitter), Hunter Horsley, CEO of Bitwise Invest, shared insights from a recent memo to advisors and institutional clients penned by Matt Hougan, Bitwise’s Chief Investment Officer. The memo heralded the onset of a new era for Bitcoin, likening its current trajectory in the financial markets to having an ‘initial public offering’ (IPO) moment, signaling a major shift in price discovery mechanisms for the cryptocurrency.
Bitcoin’s IPO Moment
Hougan’s memo elaborates on the seismic shift within the Bitcoin investment landscape, stating, “Previously, only a fraction of the world’s investors could access Bitcoin—mostly self-directed retail investors and technologists. That group drove the price above $40,000. Now, thanks to the ETFs, every investor in the world—financial advisors, family offices, institutions, endowments, and others—can access Bitcoin.” This transition is likened to “going from 10 normal people bidding on a house to 100 very wealthy people bidding on a house, overnight,” thus naturally propelling the price upward.
Emphasizing the magnitude of this shift, the memo reads, “It’s like bitcoin had its initial public offering and the market is now finding its true price,” underlining the transformative impact of ETFs in democratizing access to Bitcoin for a global pool of investors. With the world’s asset and wealth managers controlling approximately $115 trillion in capital, a modest allocation of 1% to Bitcoin could result in over $1 trillion of buying pressure, a figure that is approximately equal to Bitcoin’s current market capitalization.
The memo also draws attention to the pivotal role of long-term Bitcoin holders in this new era of price discovery. With Bitcoin ETFs acquiring more than the total new supply generated by miners, the decision of these long-term holders to sell or hold could significantly influence market dynamics. Hougan notes, “Close to 70% of all bitcoin hasn’t moved in a year,” suggesting a robust holding pattern among investors which could set the stage for price escalations as demand continues to surge.
Further reinforcing Bitwise’s bullish outlook, Ryan Rasmussen, a researcher at the firm, provided a tangible price target during a Yahoo Finance interview. He affirmed, “We think that Bitcoin will certainly set all-time highs in 2024…We still stand by that prediction. […] That previous price is around $69,000, but we think it won’t stop there, we will see at least a 10-15% bump over the all-time high […] That would take us to […] $88,000, and I am still sticking by that with all the excitement in the market.”
"Ultimately what we're seeing is crypto kind of rising from the ashes of the 2022 market," Bitwise's @RasterlyRock says on the crypto rally. "We think that we're in a multi-year bull cycle and all elements of the crypto space will certainly have their moment." pic.twitter.com/Fj1ohKUwjS
— Yahoo Finance (@YahooFinance) February 26, 2024
These projections and analyses from Bitwise’s leadership highlight a consensus view of Bitcoin entering a groundbreaking phase of price discovery. The narrative of Bitcoin’s ‘IPO moment’, coupled with expanded investor access through ETFs and the steadfastness of long-term holders, crafts a compelling forecast of growth and new price benchmarks for the world’s leading cryptocurrency.
At press time, BTC traded at $