Why Did Bitcoin Price Crash 10% After Reaching $69,000 All-Time High?

The flagship crypto token, Bitcoin, finally hit a new all-time high (ATH) on March 5 but quickly dipped by over 10% after this price surge. As explained by this market analyst, this sharp correction was to be expected and could become a norm heading into the bull market.

“Bull Markets Are Not Straight Lines Up”

Alex Thorn, Head of Research at Galaxy Digital, noted in an X (formerly Twitter) post that the market doesn’t move to the upside unfettered, even in a bull market, and corrections are to be expected. He alluded to the 2021 bull run, where Bitcoin experienced around 13 corrections of 10% or more between 2020 and the peak when the crypto token hit its previous ATH.

Thorn also referenced the 2017 bull run, noting that the same thing occurred then as Bitcoin experienced 13 drawdowns of 12% or more. Therefore, what happened with Bitcoin recently isn’t unusual, and more corrections are likely to occur as the crypto token hits new highs on its way to the peak of this market cycle. 

Meanwhile, as revealed by Thorn, something similar happened in December 2020 when BTC touched its prior ATH of $20,000, then traded 11.3% lower for the next 15 days before going on to “definitively” break its ATH. If the same thing happens now, the analyst believes that could be good for Bitcoin, stating that “some consolidation would be healthy” after its year-to-date gains. 

Moreover, it is worth mentioning that Bitcoin has been on a run since the end of last year (just before the Spot Bitcoin ETFs were approved) and hasn’t slowed since then. Therefore, a significant pullback for the flagship crypto token seems long overdue. 

Profit Taking Is To Be Expected For Bitcoin

Crypto analyst Guy Turner suggested in an X post that profit-taking could have been the cause of the pullback and that more profit-taking is likely to take place. Investors aggressively taking profit was to be expected considering that Bitcoin hitting a new ATH ultimately put all wallets holding the crypto token in profits. 

Turner also noted that these corrections are healthy for a sustainable long-term market. It also allows investors to position themselves and accumulate more BTC during the dip. On the bright side, the bull market is all but confirmed, with Bitcoin hitting a new ATH. According to crypto analyst Ali Martinez, this cycle is expected to continue until sometime in October 2025. 

At the time of writing, Bitcoin is trading at around $65,900, down over 2% in the last 24 hours, according to data from CoinMarketCap. 

Bitcoin price chart from Tradingview.com

Bitcoin Crash Or Surge? Fed’s BTFP Program Ends In 5 Days

As the US Federal Reserve’s Bank Term Funding Program (BTFP) approaches its conclusion on March 11, 2024, the Bitcoin and crypto market stands at a critical juncture. Instituted in March 2023 in the aftermath of the sudden collapses of Signature Bank and Silicon Valley Bank, the largest since the 2008 financial crisis, the BTFP has been a lifeline for US banks, offering loans against high-quality collateral to ensure liquidity in turbulent times.

The BTFP’s Closure And Its Implications For Bitcoin

The BTFP’s conclusion could send ripples through the financial sector, affecting banks’ liquidity and possibly leading to tighter lending practices. Crypto analyst Furkan Yildirim recently detailed on X, “With the BTFP’s end, banks may face liquidity constraints impacting their operations and profit margins. This could slow down economic growth due to reduced lending.”

However, he added that “the Fed might counter this by adopting a more lenient monetary policy, which could stabilize asset prices and prove beneficial for Bitcoin and the broader market.”

Arthur Hayes, the visionary behind BitMEX, provided a similar opinion in one of his latest essays. He identifies a trio of macroeconomic indicators – the Reverse Repo Program (RRP), the BTFP, and the imminent March interest-rate decision – as pivotal to the Bitcoin and crypto market.

Hayes predicts a severe market correction should liquidity sources, including the BTFP, dry up. “The market could face a harsh reality check without new dollar liquidity injections,” he suggests, indicating a possibly rough transition period for all asset classes, including cryptocurrencies.

The BitMEX founder anticipates a tumultuous March, with the possibility of a 30-40% correction in Bitcoin prices triggered by the BTFP’s expiry. Yet, he remains optimistic about a potential rebound ahead of the Federal Reserve’s meeting on March 20, hypothesizing that anticipatory actions by the Fed, such as rate cuts, could reinvigorate the market.

“This critical period could define the near-term liquidity scenario, offering a rebound opportunity for Bitcoin before further assessing the impact of the Fed’s decisions on market dynamics,” he explains.

More Expert Opinions

Balaji Srinivasan, former CTO of Coinbase, recently also offered a strategic viewpoint on the synchronicity of more key events, “BTFP expires in March. BTC halves in April. RRP runs out in May. All around the same time. So, the US banking system gets stressed right as Bitcoin gets scarce.” His analysis underscores the coincidental timing of the BTFP’s conclusion with Bitcoin’s halving event, suggesting a unique set of circumstances that could amplify market reactions.

Ansel Lindner, host of BTC Markets, provided a commentary amidst growing concerns over regional banking stability. Following revelations of “material weakness” in New York Community Bank’s (NYCB) loan risk tracking and a significant increase in its loan loss reserves earlier this month, Lindner pointed to potential early signs of another banking sector stress.

“It’s starting… Remember what happened to Bitcoin during last March’s banking crisis? The BTFP was created on 12 March 2023, Bitcoin rallied 40% within 2 weeks. #SafeHaven,” Lindner said, highlighting the potential for Bitcoin if the US Fed decides to intertwine again.

In conclusion, the Bitcoin and crypto markets are at a crossroads on March 11, with potential outcomes ranging from significant downturns to bullish recoveries, contingent on the Federal Reserve’s actions and broader macroeconomic trends. The end of the BTFP signifies more than just the cessation of a temporary liquidity program; it represents a moment of truth for the banking sector’s resilience and the crypto market’s response to shifting economic tides.

At press time, BTC traded at $67,005.

Bitcoin price

Can DOGE Avoid A Dive? Sell Pressure Puts Memecoin To The Test

Dogecoin (DOGE) has solidified its position as the eighth-largest cryptocurrency by market capitalization, leaving industry observers amused and sparking humor from Cardano’s founder, Charles Hoskinson. The memecoin experienced a substantial upswing, propelling its market cap to approximately $28 billion, surpassing Cardano’s $27 billion valuation.

Related Reading: Bitcoin On The Brink, Price Soars Above $68,000 – Will BTC Break Its 2021 Record?

DOGE Market Dynamics And Technical Indicators

At the time of writing, Dogecoin was trading at $0.16, reflecting a remarkable 103% surge in the past seven days. This increase catapulted DOGE ahead of major cryptocurrencies like AVAX, DOT and TRON. Despite this positive momentum, technical indicators suggest a nuanced situation.

The Relative Strength Index (RSI) for Dogecoin stands at slightly above 67, signaling an overbought condition. While the price is on an upward trajectory, there is a possibility of susceptibility to a corrective phase. Meanwhile, the Chaikin Money Flow (CMF) at nearly 0.20 presents a mixed picture. A positive CMF indicates strong buying pressure, but an upward trend may also signify potential profit-taking, hinting at a possible sell-off.

Sentiment And Social Activity

Social dynamics appear to play a pivotal role in Dogecoin’s recent surge. The social volume, often linked with price movements, witnessed an uptick, indicating a positive correlation between growing interest and discussions around Dogecoin and its upward momentum.

Weighted sentiment, a crucial metric reflecting community sentiment, has shown an increase, with positive comments outweighing negative ones. This surge in positive sentiment adds fuel to DOGE’s positive momentum in the market.

Holder Metrics, Cautionary Signs

Despite the positive indicators, cautionary signs emerge as the rise in the percentage of short positions against DOGE reveals a cautious sentiment among traders. The increase in short positions suggests a bearish outlook, prompting investors to be mindful of potential impacts on the coin’s prices,

Industry Observations

The overtaking of Cardano by Dogecoin in market capitalization has drawn attention from industry observers, including Hoskinson. In a light-hearted manner, he declared the beginning of what many are calling “alt-season.” This observation adds a layer of industry perspective to the ongoing developments in the cryptocurrency market.

Dogecoin’s recent surge to become the eighth-largest cryptocurrency brings a mix of excitement and caution. While positive sentiment, social activity, and industry observations contribute to its momentum, technical indicators and cautionary signs suggest a need for prudence.

Related Reading: FLOKI Grows Over 300% As Memecoin Breaches $400 Million TVL – Details

Featured image from Freepik, chart from TradingView

Bitcoin Price Crashes After New ATH, Are Dips Supported At $60K?

Bitcoin price traded to a new all-time high above $69,000 before crashing. BTC is now consolidating near $63,000 and might decline toward the $60,000 support.

  • Bitcoin price created history again and traded to a new all-time above $69,000.
  • The price is trading below $65,000 and the 100 hourly Simple moving average.
  • There was a break below a key bullish trend line with support at $66,000 on the hourly chart of the BTC/USD pair (data feed from Kraken).
  • The pair could extend losses and revisit the key $60,000 support zone.

Bitcoin Price Takes Hit

Bitcoin price extended its increase above the $68,000 resistance. BTC even broke the $68,800 level and traded to a new all-time high at $69,218. However, there was a strong bearish reaction from $69,200.

The price crashed over 10% and dived toward the $60,000 zone. There was a break below a key bullish trend line with support at $66,000 on the hourly chart of the BTC/USD pair. A low was formed near $59,150 and the price is now attempting a recovery wave.

There was a move above the $62,000 resistance. It is now facing resistance near the $64,000 zone and the 50% Fib retracement level of the downward move from the $69,218 swing high to the $59,150 low.

Bitcoin is now trading below $64,000 and the 100 hourly Simple moving average. Immediate resistance is near the $64,000 level. The next key resistance could be $64,200, above which the price could rise toward the $65,500 resistance zone.

Bitcoin Price

Source: BTCUSD on TradingView.com

If there is a clear move above the $65,500 resistance zone or the 61.8% Fib retracement level of the downward move from the $69,218 swing high to the $59,150 low, the price could rise toward the $67,000 level. Any more gains might send the price toward the $70,000 level.

More Losses In BTC?

If Bitcoin fails to rise above the $64,200 resistance zone, it could start another downside correction. Immediate support on the downside is near the $62,000 level.

The first major support is $61,500. If there is a close below $61,500, the price could start a decent pullback toward the $60,000 zone. Any more losses might send the price toward the $58,500 support zone.

Technical indicators:

Hourly MACD – The MACD is now gaining pace in the bearish zone.

Hourly RSI (Relative Strength Index) – The RSI for BTC/USD is now below the 50 level.

Major Support Levels – $62,000, followed by $60,000.

Major Resistance Levels – $64,200, $65,500, and $67,000.

Deribit Exchange Expects Bitcoin To Rise 20% In The Next 30 Days, Targeting $80,000

In a significant milestone for the cryptocurrency market, Bitcoin (BTC), the largest digital asset, shattered its previous records, surging past the $69,000 mark to establish a new all-time high (ATH) of $69,300 on Tuesday. 

The achievement marked a historic moment for BTC, which hadn’t reached such levels in over two years. However, the crypto’s upward trajectory shows no signs of slowing down, with experts predicting further price gains.

Bitcoin Price And ETFs In Perfect Harmony

According to data from Deribit, an options and futures crypto exchange and analytics firm GenesisVol, BTC is anticipated to experience a potential increase of up to 20.8% within the next 30 days. 

These projections suggest that, under ideal circumstances, Bitcoin’s price could break through the $80,000 barrier. Even conservative traders are optimistic, expecting BTC to easily surpass $70,000 and reach around $75,000.

In addition, the recent approval of spot Bitcoin exchange-traded funds (ETFs) has played a pivotal role in Bitcoin’s success, suggesting that the upward trend in BTC prices, coupled with bullish sentiment among options traders and institutional and retail investors, is far from over.

Bloomberg ETF expert Eric Balchunas emphasized the significance of this development, stating that it represents a crucial moment for both Bitcoin and ETFs. Balchunas believes the surge from $25,000 to $69,000 was largely driven by hopes of ETF approval and subsequent flows. 

Bitcoin

The expert claimed that the synergy between ETFs and Bitcoin has proven mutually beneficial, as ETFs have enhanced liquidity, affordability, convenience, and standardization for investors. 

Notably, the ten-spot Bitcoin ETFs have amassed over $50 billion in assets, with a staggering $8 billion generated from flows and the rest attributed to the rising value of Bitcoin.

However, as Bitcoin reached its new peak, increased market volatility led to a liquidation surge. Journalist Colin Wu reported a sharp 5% drop in Bitcoin’s price within an hour, with Binance recording below $65,000. During this hour, liquidations amounted to a staggering $142 million. 

BTC Sell Signal

Although bullish investors are currently on cloud nine, renowned crypto analyst Ali Martinez has sounded the alarm as the TD Sequential indicator recently flashed a sell signal on the daily chart of Bitcoin.

The TD Sequential indicator, developed by market expert Tom DeMark, utilizes price patterns and sequences to identify potential trend reversals in various financial markets, including cryptocurrencies. 

Martinez emphasized the indicator’s notable track record in predicting Bitcoin’s price movements since the beginning of the year. The TD Sequential indicator issued a buy signal in early January, just before Bitcoin’s price surged 34%. 

Conversely, a sell signal was given in mid-February, followed by a 4.44% drop in the value of BTC. So, considering the previous sell signals, a potential drop towards the $62,000 price level could be in the making for the largest cryptocurrency on the market, still holding the $60,000 support, which will be key for BTC’s prospects.

Bitcoin

Featured image from Shutterstock, chart from TradingView.com

Bitcoin Sets New All-Time High Above $69,000 As Institutionals Show FOMO

Bitcoin has set a new all-time high (ATH) above the $69,000 level as institutional investors have aggressively bought on Coinbase.

Bitcoin Has Set A New ATH Above $69,000

The moment that every Bitcoin investor had been looking forward to has finally arrived today. The cryptocurrency just smashed past the record set in November 2021 to create a brand new ATH beyond the $69,000 level.

Bitcoin All-Time High

This historical moment has come for the asset as institutional investors have been showing some strong buying pressure recently.

Bitcoin Coinbase Premium Index Spikes To Highest Levels For 2024

As an analyst in a CryptoQuant Quicktake post explained, US institutional investors appear to be scrambling to buy Bitcoin as they are starting to feel FOMO with the sharp bullish momentum the cryptocurrency has enjoyed.

The metric of interest here is the “Coinbase Premium Index,” which keeps track of the percentage difference between the Bitcoin prices listed on cryptocurrency exchanges Coinbase (USD pair) and Binance (USDT pair).

The former exchange is the preferred platform for institutional traders based in the US, while the latter serves more global traffic. As such, the Coinbase Premium Index can provide hints about the differences in the buying and selling behaviors of the two groups.

When the indicator has a positive value, the price listed on Coinbase is higher than on Binance. Such a trend implies that the buying pressure is higher (or selling pressure is lower) from the US-based investors compared to Binance users.

On the other hand, the negative metric suggests that American institutional traders may be applying relatively high selling pressure on the market.

Now, here is a chart that shows the trend in the Bitcoin Coinbase Premium Index over the past few months:

Bitcoin Coinbase Premium Index

As displayed in the graph, the Bitcoin Coinbase Premium Index has registered a large positive spike recently, implying the difference between the prices on Coinbase and Binance has widened.

The indicator had been floating inside the green territory for a while before this spike, and in this period of high buying pressure on Coinbase, the coin observed a sharp rally.

This recent buying pressure would probably include sources like the spot exchange-traded funds (ETFs) approved this year. From the chart, it’s visible that the buying pressure has been even higher in the last couple of weeks, culminating in the latest spike.

Interest around the asset among these institutional entities had only been growing recently, but the latest spike suggests FOMO has gone up a level for these investors.

Given that institutional buying has been one of the main forces behind the latest rally in the cryptocurrency, it’s no wonder that its price has hit a fresh high off the back of the latest spike.

If Bitcoin Clears $70,000, How Fast Will Ethereum Ease Past $5,000?

As Bitcoin surges towards its all-time high (ATH) of nearly $70,000, analysts are closely watching Ethereum, the world’s second-largest cryptocurrency, wondering how quickly it will follow suit and break its record ATHs of approximately $5,000 printed in late 2021.

How Will Ethereum React When Bitcoin Breaks Above $70,000?

One analyst, posting on platform X, highlights the difference in the two coins’ positions compared to the last time Bitcoin broke above 2017 highs of $20,000 in December 2020. Then, Ethereum was trading at $600, a full 57% below its previous ATH of about $1,400. 

As Bitcoin nears its record peak of around $70,000 registered in December 2021, Ethereum is approaching $4,000. However, the difference between then and now is that ETH is about 36% shy of its ATH of around $5,000. 

The question in the analyst’s mind is, considering historical performance, how fast ETH will ease past $5,000. When Bitcoin broke above $20,000 in late December 2020, the analyst notes that it took approximately two months for ETH to sweep past $1,400 and record new highs.

The boom after this breakout lifted ETH to around $5,000, accelerated mainly by retail activities cycling around decentralized finance (DeFi) and non-fungible token (NFT) minting.

Ethereum price trending upward on the daily chart | Source: ETHUSDT on Binance, TradingView

Looking at the Ethereum price action in the daily chart, it is clear that buyers are in control. ETH prices, CoinMarketCap data reveals, are up roughly 7% in the past 24 hours and 15% in the previous week. However, how quickly ETH might repeat the prior 2020-2021 feat remains to be seen. 

Exploring ETH’s Chances

Like in the past, the Ethereum price action benefits from the Bitcoin expansion. The revival in Bitcoin prices has seen capital flow to Ethereum, priming its broader ecosystem comprising DeFi and NFT protocols. DeFiLlama data shows that Ethereum manages over $56 billion worth of assets.

Notably, almost all top DeFi protocols in Ethereum, including Lido, Maker, Uniswap, and EigenLayer, have posted strong inflows in the past day, week, and month.

Ethereum DeFi protocols pulling in capital | Source: DeFiLlama

Aside from market-related factors, Ethereum prices are also steadied by hopes around the eventual approval of a spot Ethereum exchange-traded fund (ETF). BlackRock is among the leading asset managers to file with the United States Securities and Exchange Commission (SEC). 

However, the agency postponed a ruling on BlackRock’s application for a spot Ethereum ETF, citing concerns about the network’s new proof-of-stake consensus mechanism. The SEC expressed worries that staking, a core aspect of proof-of-stake, could create opportunities for manipulation. 

The clear reservation regarding proof-of-stake cast a shadow on Ethereum’s near-term outlook despite the current uptick in prices. Still, the community finds relief realizing that the Commission rejected approving a spot Bitcoin ETF for roughly ten years before January 2024.

Bitcoin Mining Firm CEO Predicts Start Of ‘Supercycle’, What It Means

In a series of statements made on X (formerly Twitter), Marc van der Chijs, the CEO of the publicly traded Bitcoin mining firm Hut 8, shared an optimistic outlook on the future of Bitcoin, suggesting that the cryptocurrency may be on the brink of a ‘supercycle.’ “I think I have never been more bullish about Bitcoin than I am right now,” he remarked, pointing to the cryptocurrency’s recent performance and the absence of widespread hype as a prelude to what he terms a ‘supercycle.’

Understanding the concept of a ‘supercycle’ is crucial to grasping van der Chijs’ perspective. Unlike regular market cycles that see periodic rises and falls, a supercycle in the Bitcoin domain refers to an extended period of bullish growth over several years. This phase is characterized by a substantial increase in adoption, demand, and price, often leading to far-reaching economic implications.

In essence, a supercycle marks a paradigm shift where the asset’s value escalates dramatically, supported by a continuous inflow of investment and a growing consensus about its long-term viability. To come to this conclusion, Van der Chijs’ prediction hinges on several observations and trends within the Bitcoin sector.

Why A Bitcoin Supercycle Could Be Possible

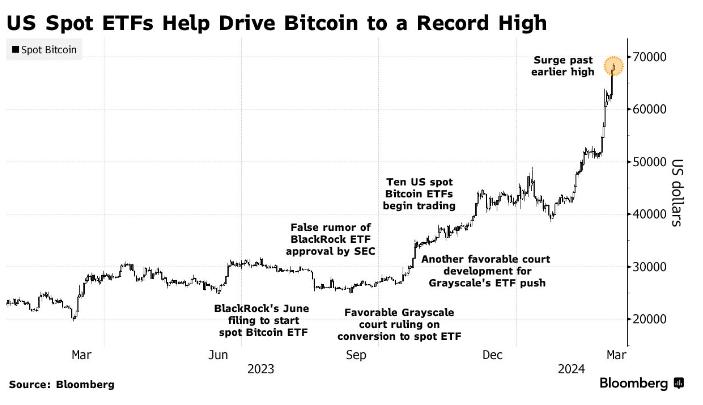
First, he notes a significant shift towards Bitcoin ETFs by funds, including yesterday’s landmark announcement from Blackrock’s Strategic Income Opportunities Fund. This movement signifies a robust institutional interest that could feed a constant stream of investment into Bitcoin, setting the stage for a supercycle.

“This will be a constant flow of new money into the ETFs. […] The flows into the ETF are getting bigger, not smaller,” van der Chijs remarked. With financial advisors poised to recommend Bitcoin ETFs to clients following a regulatory settling period, van der Chijs sees a torrent of new capital on the horizon. This anticipation is not unfounded, considering the groundbreaking success of the Bitcoin ETF launch, which he cites as “the most successful ETF launch ever.”

Corporate strategies around Bitcoin also play a pivotal role in van der Chijs’ supercycle theory. He points to Microstrategy’s aggressive leverage-based Bitcoin purchases as a harbinger of a trend where companies increasingly view Bitcoin not just as an investment, but as a fundamental aspect of their financial strategy. This shift, according to van der Chijs, could prompt other CEOs to follow suit, further accelerating Bitcoin’s ascendancy.

Moreover, a critical mass of financial advisors is on the brink of recommending Bitcoin ETFs to clients, pending the expiration of regulatory and due diligence waiting periods. This opens the gates for substantial new investments from a segment traditionally cautious about direct cryptocurrency investments. “They can’t sell the ETF during the first 90 working days (internal regulations mostly because of DD), although they are fast tracking it for this ETF,” van der Chijs stated.

FOMO And A Self-Fulfilling Prophecy

The speculation around unidentified large-scale Bitcoin acquisitions adds another layer to the supercycle narrative. Van der Chijs alludes to the intrigue surrounding a wallet that has been steadily accumulating Bitcoin, hinting at the involvement of a billionaire possibly akin to Jeff Bezos. “Since November 2023 a wallet has been adding on average about 100 BTC per day, the wallet now contains over 50,000 BTC,” he states, pointing to the potential for influential figures to catalyze broader market movements.

Another argument is potential purchases by nation-states. Although nation-state involvement in Bitcoin has been minimal, with El Salvador being a notable example, any increase in such activities could trigger a domino effect. The participation of nation-states in the Bitcoin market could significantly elevate Bitcoin’s status as a sovereign asset class.

Next, the retail sector remains largely on the sidelines in the current cycle, but van der Chijs anticipates a surge in retail interest following new all-time highs and increased media coverage. This could initiate a FOMO cycle, drawing more investment from traditional asset classes into Bitcoin.

Last, van der Chijs mentions the concept of a self-fulfilling prophecy: As Bitcoin continues to rise without significant dips due to constant new money inflow, more people and institutions will entertain the concept of a supercycle. This, in turn, could lead to increased capital allocation to Bitcoin, making the supercycle more likely.

Macroeconomic Implications Of A Supercycle

Van der Chijs’ theory also touches on the potential macroeconomic implications of a Bitcoin supercycle, predicting a significant shift in wealth and power structures. The redistribution of wealth could see Bitcoin at the center of a new economic order, with traditional asset classes potentially losing ground.

In conclusion, Marc van der Chijs outlines a compelling case for a forthcoming Bitcoin supercycle, supported by a confluence of institutional, corporate, speculative, and retail trends. He acknowledged the speculative nature of his prediction, “Right now I think there is a chance of maybe 10% that this will happen and that chance is (very slowly) going up.”

However, the implications could be massive. “[I]t will change the existing world order. It will suck money out of the stock and bond markets, out of gold and other commodities, and even out of real estate (global housing prices could collapse). This will lead to BTC prices that we can’t even imagine today, potentially millions of dollars per BTC.”

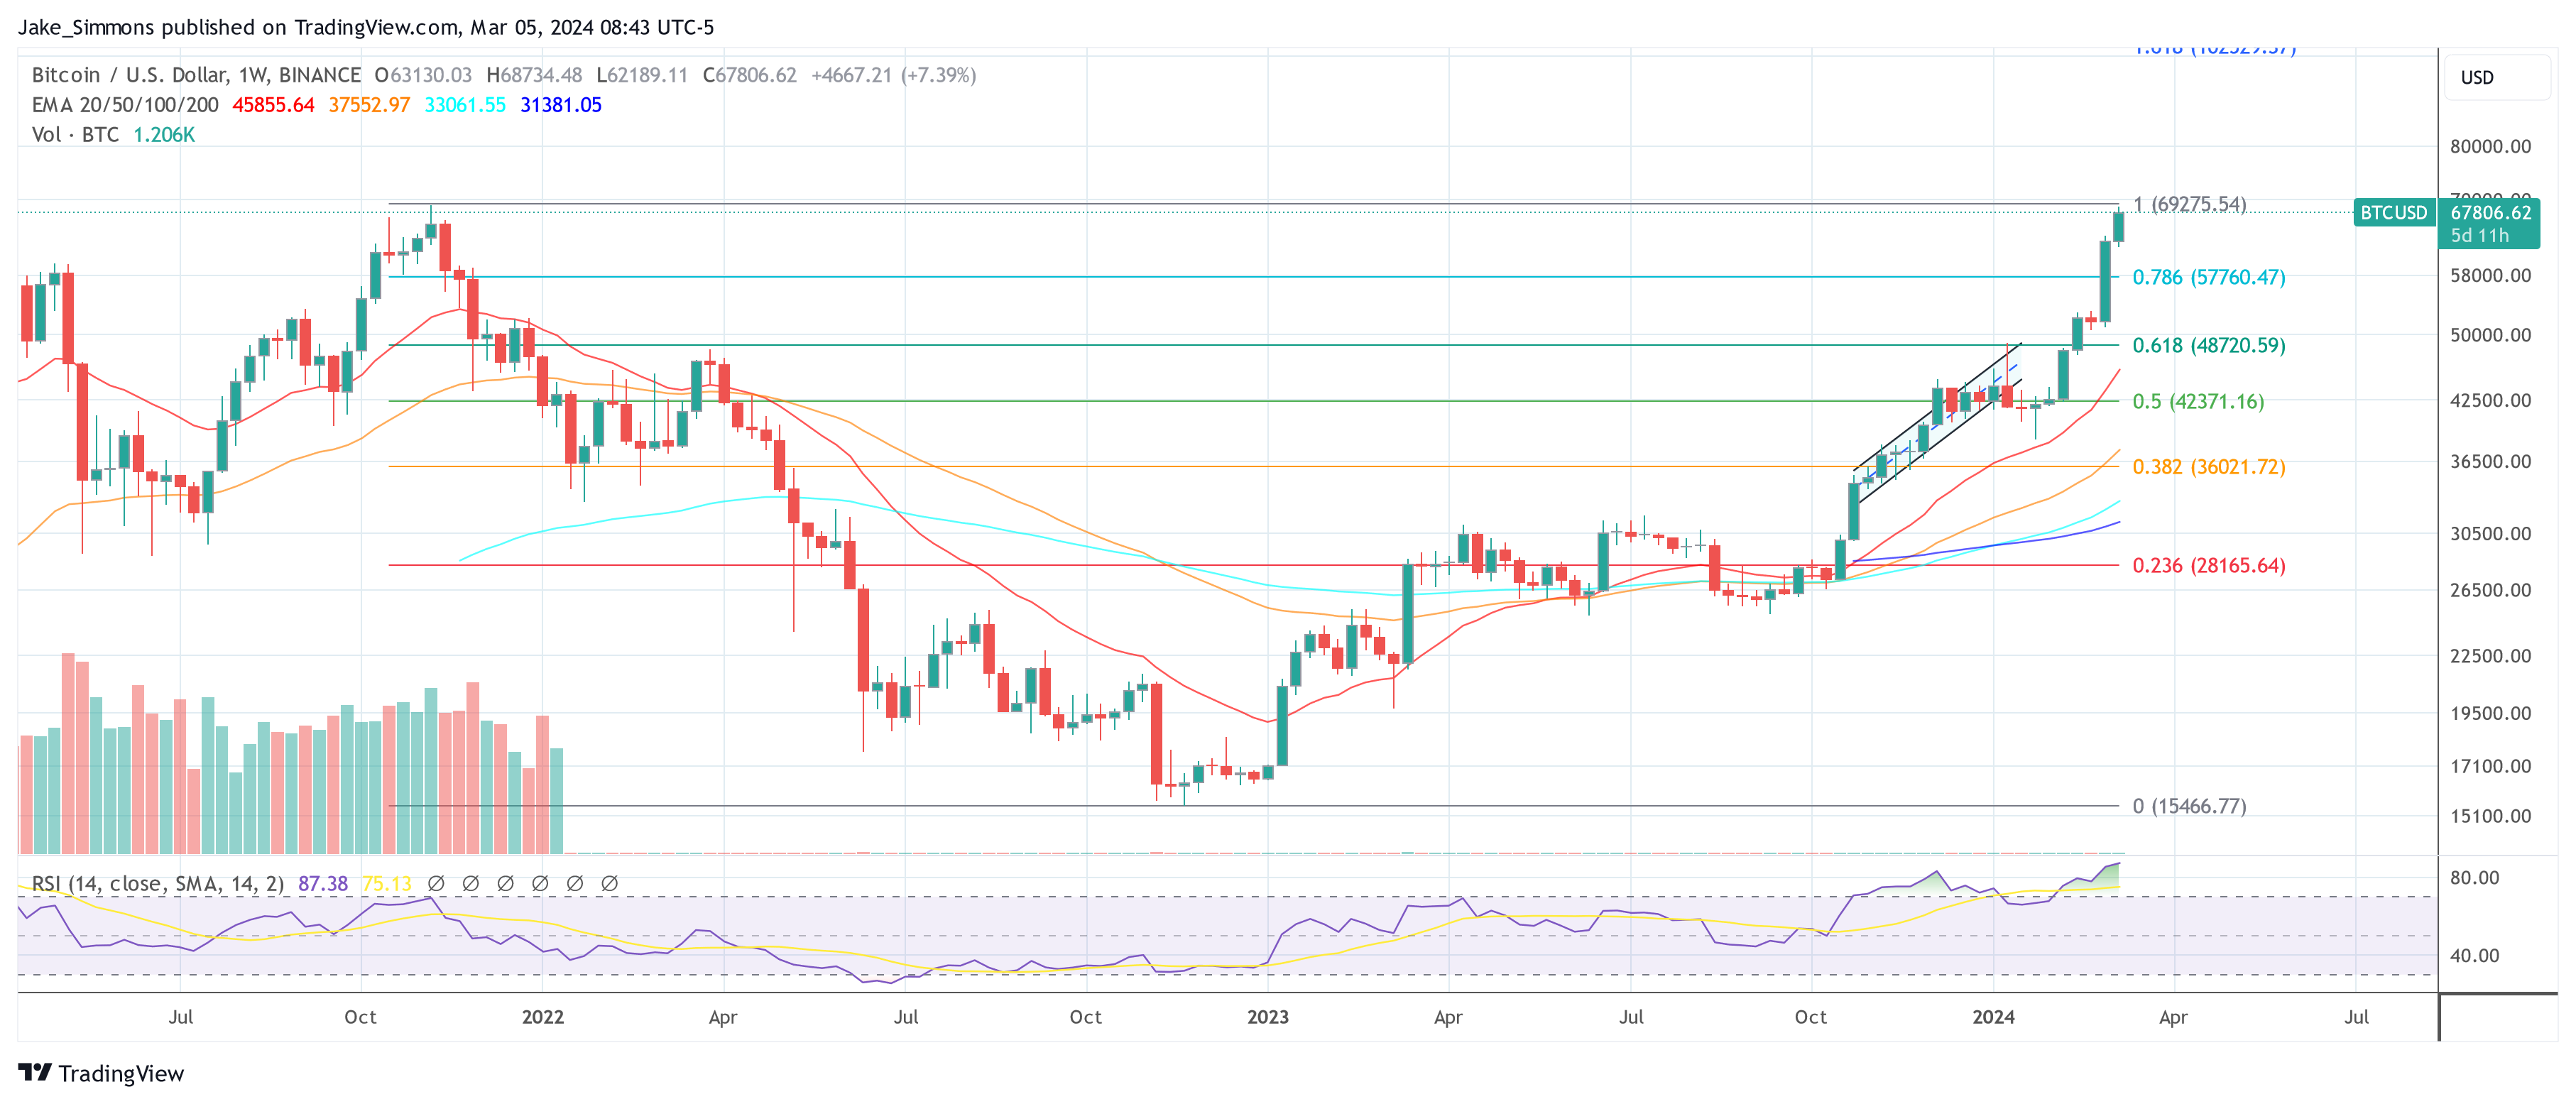
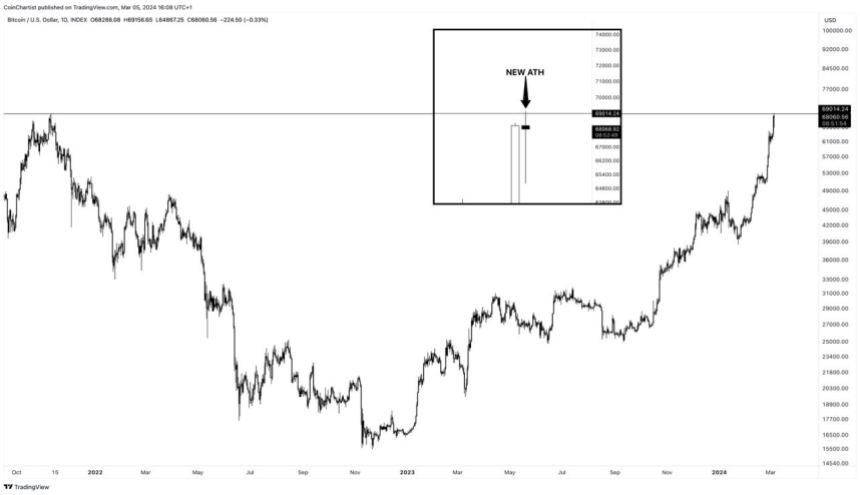
At press time, BTC traded at $67,806.

Bitcoin price