Finance Expert Predicts Bitcoin Will Touch $100,000 Soon, Here’s When

Renowned finance author Robert Kiyosaki has once again made a bullish price prediction for the flagship cryptocurrency, Bitcoin. This time, he predicts that Bitcoin will hit $100,000 and mentions when exactly this will happen. 

When Bitcoin Will Hit $100,000

Kiyosaki mentioned in an X (formerly Twitter) post that Bitcoin will hit $100,000 by June 2024. However, he didn’t mention what will propel this massive price surge. The finance expert is known to be a huge advocate of the foremost crypto token and, at different times, given his opinion on its potential. 

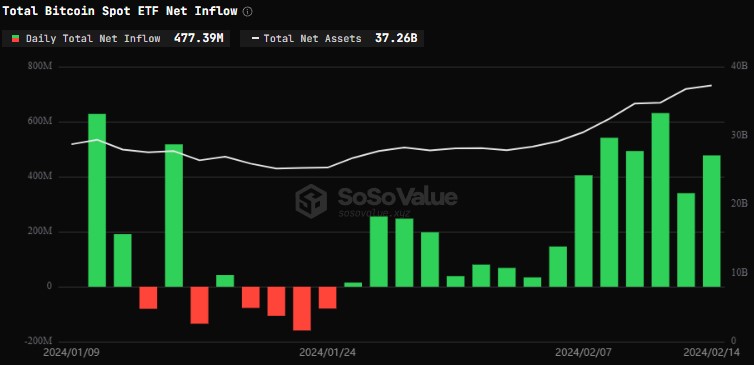
Before now, Kiyosaki, who authored the best-selling book ‘Rich Dad, Poor Dad,’ said that Bitcoin was going to rise to $150,000 and singled out the Spot Bitcoin ETFs as what would drive this parabolic move. He had also once identified the Bitcoin Halving as being pivotal for BTC’s growth. 

Interestingly, the author is believed to be a ‘crypto OG’ as he previously shared his excitement about investing in BTC “years ago.” He also continues to urge others to do the same, claiming that it is the way to avoid becoming poorer due to the actions of the government. Kiyosaki doesn’t shy away from criticizing the government and recently went as far as branding the Federal Reserve “a criminal organization.”

According to him, the “Fed has destroyed the economy, made the poor and middle class poorer, and bailed out their rich banking friends.” Instead of trusting the Fed (possibly to fight inflation), Kiyosaki stated that he would rather put his trust in Bitcoin and other assets like Gold and Silver. 

Bitcoin price chart from Tradingview.com

BTC Will Hit $100,000 But How Soon?

There seems to be a consensus among several crypto analysts that Bitcoin will no doubt hit $100,000 in the next bull run. However, the ultimate question remains when exactly this will happen. Just like Kiyosaki, crypto analyst Kevin Svenson believes that this price level isn’t far off. 

Tom Dunleavy, Partner and Chief Investment Officer (CIO) at MV Capital, also predicted that Bitcoin will hit $100,000 this year, although he didn’t give a more precise timeframe like Kiyosaki. While some predictions remain devoid of a specific timeframe, the belief is that this parabolic price surge will happen after Bitcoin Halving.

The Halving event has been projected to be what kickstarts the next bull run. That isn’t surprising, considering that Bitcoin is known to claim a new all-time high (ATH) after miners’ rewards are cut in half. One of the most bullish post-halving price predictions is Anthony Scaramucci’s prediction that BTC will hit $170,000 in 2025.  

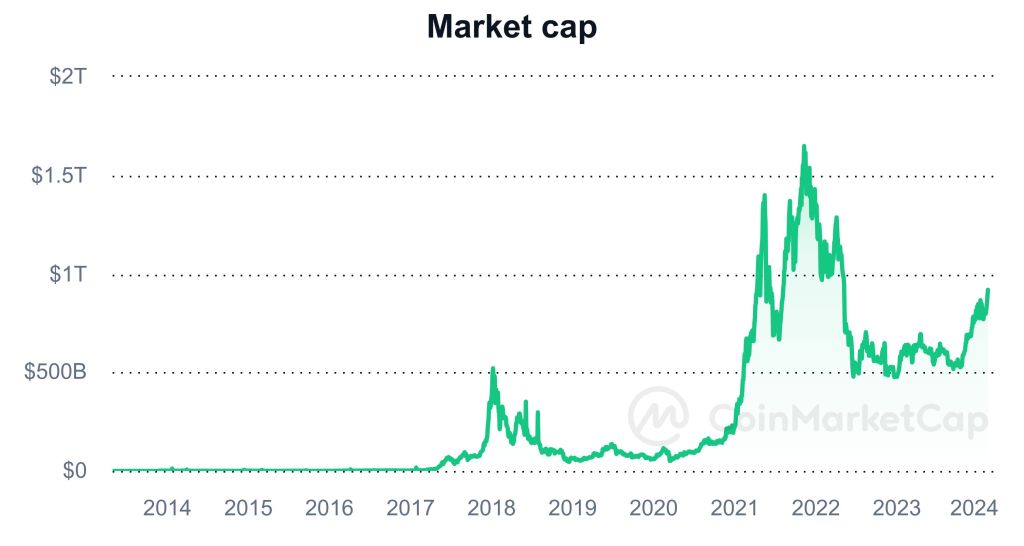
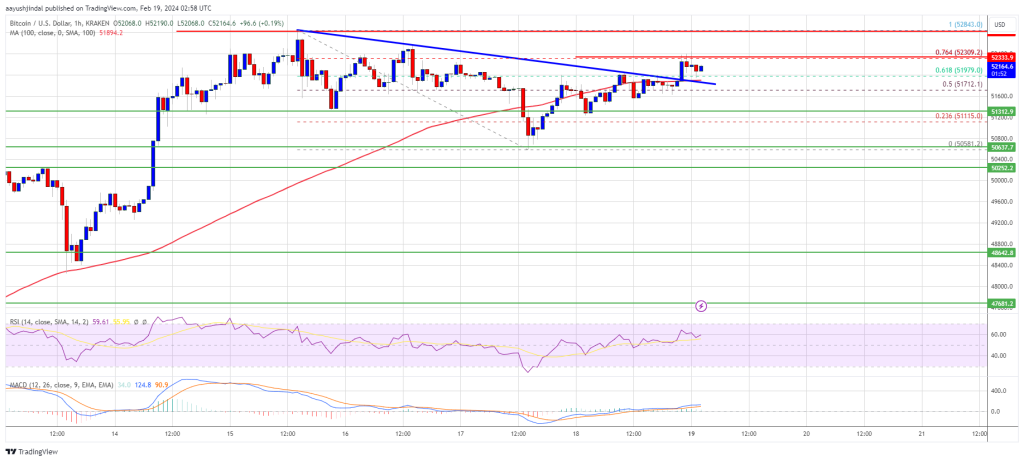
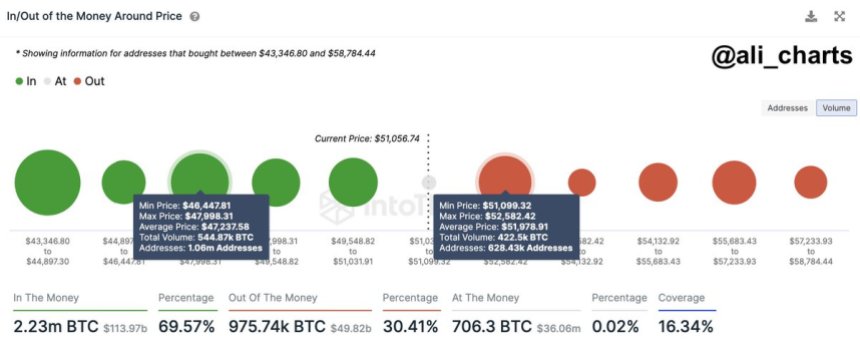
At the time of writing, Bitcoin was trading at around $52,300, up over 1% in the last 24 hours, according to data from CoinMarketCap. 

Bitcoin Bulls Persists: Analyst Identifies Trend As Catalyst To $60,000

As the entire cryptocurrency market is currently experiencing a notable upward trajectory, several market analysts are anticipating more gains for Bitcoin, the leading cryptocurrency asset, as they predict the token’s price to go even higher.

Historical Trend That Will Send Bitcoin To $60,000 

Crypto Jelle, a cryptocurrency analyst and investor, has expressed his optimism toward Bitcoin’s price action. Jelle recently shared a positive prediction for BTC in the near future on the social media platform X (formerly Twitter).

The expert’s projections delve into the present price movement of Bitcoin and its potential to increase even further. He highlighted a trend which serves as a catalyst for a price increase.

Jelle’s X post was accompanied by a chart that shows that the crypto asset has formed a “Bullish Megaphone” pattern. According to him, this is “yet another bullish megaphone pattern,” suggesting the price will go higher, putting his price target at $60,000. If Bitcoin manages to maintain its current momentum amid the crypto market’s rally, it is possible that BTC’s price might reach $60,000.

Bitcoin

In another X post, Jelle also pointed out that the token is presently in an area in which it normally sees the best gains. Jelle revealed that the BTC always experiences the best return when its “weekly Relative Strength Index (RSI) is above 70.” Due to this, he has urged his thousands of followers to invest significantly in the token to position themselves for more gains.

BTC finished the previous week on a bullish note, staying put above the $52,000 threshold in the face of strong opposition. This simply suggests a strong faith and dependency on the digital asset from investors.

After going past the $52,000 level, it set a new weekly culmination record spanning two years. Because of Bitcoin’s tenacity and upward movement, investors and market watchers are anticipating what lies ahead.

Massive Whale Moves Amid Price Rally

In light of BTC’s rally, Whale Alert has reported massive whale transactions carried out hours ago. Whale Alert revealed that around 18,484 BTC valued at about $962 million were taken out of the decentralized exchange Coinbase.

The on-chain tracker reported that the aforementioned withdrawals were carried out in two distinct transactions. Whale Alert noted that the first transaction saw 9,322 BTC worth approximately $485 million being withdrawn from Coinbase.

Meanwhile, the second transaction witnessed 9,162 BTC valued at about $476 million being extracted from the same exchange. Both wallet addresses involved in the withdrawal appear to be new ones, as they had no previous transaction history.

As of the time of writing, Bitcoin was trading at $52,336, indicating an increase of over 9% in the past 7 days. Despite the price rise, its trading volume appears to be down by over 10% in the past 24 hours.

Bitcoin

Bitcoin Open Interest Reaches $69,000 ATH Levels, What This Means For Price

The Bitcoin open interest has been on the rise over the last few weeks as the price has climbed continuously. This sustained rise in the open interest is a reflection of the heightened interest in the cryptocurrency since the United States Securities and Exchange Commission (SEC) approved Spot Bitcoin ETFs for trading. The BTC open interest has now climbed to historical levels, reaching 2021 all-time high levels.

Bitcoin Open Interest At 2021 Levels

According to data from Coinglass, the Bitcoin open interest has risen to more than $24 billion. This growth represents around a 50% jump in the open interest since the year 2024 began. But more importantly, the open interest has risen to levels not seen since 2021.

Looking at the open interest chart, the last time that the Bitcoin OI was this high was back in November 2021, when the cryptocurrency reached its all-time high price of $69,000. This rise in the OI has been consistent across crypto exchanges, with CME, Binance, and ByBit leading the charge and commanding more than 50% of the open interest.

Bitcoin open interest

The continuous rise has also come with a rise in the greed levels among crypto investors. Currently, the Crypto Fear & Greed Index is sitting firmly in Greed, suggesting that crypto investors are in a place where they are willing to take more risks than usual.

Implications For The BTC Price

With the Bitcoin open interest this high, it could end up being negative for the BTC price. This is because past performances where the open interest has risen so rapidly have often ended in a market crash. The same was the case in 2021 when the Bitcoin OI had set its previous record.

In 2021, when the BTC price crossed $69,000 and the open interest crossed $22 billion, the euphoria was incredibly high as it is now. However, this would be short-lived, with a market crash happening shortly after. The BTC price would eventually go from $69,000 to $46,000 by December, dropping by almost 40% in the space of one month.

If this same trend were to repeat itself in the current trend, then there could be a massive crash in the cards for Bitcoin. A similar decline would see Bitcoin fall back toward $41,000, which would wipe out the gains of the last few weeks.

However, there are different factors at play in the current market, such as Spot Bitcoin ETF issuers seeing massive interest in their exchange-traded products. Just last week, inflows into Spot BTC ETFs reached a new record of $2.2 billion. So if these large institutions continue buying BTC to meet the demand of their customers, then the BTC price could continue to rally.

Bitcoin price chart from Tradingview.com

16,000 Bitcoin Dormant Since 5+ Years Suddenly Moves, What’s Going On?

On-chain data shows 16,000 BTC, which have been dormant for 5-7 years, have finally shown some movement on the Bitcoin blockchain.

5-7 Years Old Bitcoin Age Band Has Made A Large Move

As pointed out by an analyst in a post on X, a large stack of dormant coins has moved across the network today. The relevant on-chain indicator here is the “Spent Output Age Bands” (SOAB), which keeps track of the movements of the various Age Bands on the blockchain.

“Age Bands” here refer to groups of coins divided based on their total holding time. For example, the 1-month to 3-month Age Band would include all coins that have been dormant (that is, staying inside the same address) since between one and three months ago.

If a large number of coins belonging to this holding time range would transfer on the blockchain, then the SOAB for this particular Age Band would register a spike. In the context of the current discussion, the 5-7 years Age Band is of interest.

The chart below shows the recent SOAB data for this Age Band specifically:

Bitcoin Spent Output Age Bands

As displayed in the above graph, a large amount of coins aged between 5-7years old appear to have just been moved on the network as the corresponding Age Band has registered a spike.

This Age Band is a segment of the wider and “long-term holder” (LTH) group, which includes investors who have been holding onto their coins since at least 155 days ago.

Statistically, the longer a holder keeps their coins dormant, the less likely they become to sell at any point. As such, the LTHs are generally considered to be more resolute than the rest of the market (the “short-term holders“).

Since the 5-7 years Age Band would include coins that are old even in LTH terms, their owners would have to be diamond hands among diamond hands. Due to this reason, it can be something notable when such ancient entities finally decide to break their silence.

Related Reading: Cardano (ADA) To Break $8 In Bull Run: Analyst Predicts Timeline

During the latest SOAB spike, these investors have moved a massive stack of 16,000 BTC (around $837.8 million at the current exchange rate). Now, what implications this move may have on the market depends on what these investors intend to achieve with it.

A dive deeper into on-chain data suggests the move was an outflow from the cryptocurrency exchange Coinbase, as the chart below shows:

Bitcoin Coinbase Outflow

The fact that it is an outflow may be a positive sign for Bitcoin, as it means that selling may not have been the goal here. Rather, the move implies the whale entity behind it may be moving towards self-custody to HODL further, or a large buyer like an ETF is gobbling this BTC up.

BTC Price

Bitcoin had made a visit down to $50,600 during the weekend, but the cryptocurrency already appears to have bounced back as its price is now floating around the $52,400 level.

Bitcoin Price Chart

Bitcoin Spot ETFs: Issuers Set New Record As Weekly Inflows Cross $2.2 Billion

Bitcoin spot exchange-traded funds have been online in the US for only two months, but their performance has far eclipsed any other asset class. These ETFs recently hit a new milestone, drawing over $2.2 billion in inflows last week alone, shattering the previous weekly record set on the first week of trading. This is a particularly noteworthy development because, as senior Bloomberg analyst Eric Balchunas pointed out, this inflow skyrocketed past the 3,400 plus ETFs available in the US, like the SPLG US and the SPY US. 

Bitcoin ETF Inflows Surge Amid Competition

Bitcoin ETFs have fully captured the interest of institutional investors, with trading volume indicating their appealing nature. Trading volume statistics reveal these 10 ETFS have been experiencing a great deal of activity since their launch, netting more than $2.3 billion last week alone to bring the total inflow to $4.926 billion since they went live. As pointed out by Eric Balchunas, the significant inflow last week puts the ETFs above more established ETFs in the United States.

Notably, most of this inflow went into BlackRock’s iShares Bitcoin Trust (IBIT), which has outperformed the nine other Bitcoin ETFs and ETFs of other asset classes. IBIT accumulated $1.673 billion in net inflows throughout the week, making it the third-largest inflow among any of the 3,500 plus exchange-traded funds. 

At the close of last week’s trading session, BlackRock’s IBIT has received a $5.2 billion net inflow since its launch. Notably, this amounts to 50% of the investment company’s net inflow of $10.4 billion from its 417 ETFs since the beginning of the year. 

It’s important to note that these staggering inflow numbers have come amidst an ongoing outflow from the Grayscale Bitcoin Trust ETF (GBTC). While outflows from the ETFs have slowed down compared to recent weeks, the GBTC witnessed $624 million in outflows during the week. “Again, this is all net GBTC bleed,” Balchunas noted.

BTC Bullish Price Momentum Set To Continue

Bitcoin’s price has skyrocketed over 33% in the past 30 days, recently topping $52,000 per coin for the first time since 2021. Current price action shows Bitcoin has somehow stabilized around this price point, with the crypto trading between $52,700 and $50,700 in the past five days. At the time of writing, Bitcoin is trading at $52,307.

However, the fear of missing out on further gains is driving many new investors to Bitcoin ETFs. According to an analyst, inflows into these ETFs are on track to reach $150 billion by the end of 2025. With a new all-time high now looking plausible, Bitcoin is set to continue on its price gain as spot ETF trading commences throughout the week.

Bitcoin On Steroids: Key Technical Factors Fueling The Rally To $70,000

The price of Bitcoin has been on a tear in recent weeks, surging over 30% and breaching the $50,000 mark. At the time of writing, Bitcoin was trading at $52,377, up 1.3% and 8.8% in the daily and weekly timeframes, data from Coingecko shows.

This bullish momentum has ignited fresh optimism among investors, with many wondering if the world’s leading cryptocurrency is poised for another assault on its all-time high of $69,000.

Analysts point to several key technical factors that could propel Bitcoin towards new heights in the coming months. Here are three of the most prominent:

Halving Frenzy

April 2024 marks the next Bitcoin halving, a highly anticipated event that occurs roughly every four years. During this event, the block reward for miners, currently 6.25 BTC, is slashed in half, effectively reducing the rate at which new Bitcoins enter circulation. This engineered scarcity has historically triggered significant price rallies, and analysts predict a similar outcome this time around.

IntoTheBlock, a quantitative crypto analysis firm, estimates a surge to a new all-time high just one month after the halving. They reason that miners, better prepared for the halving’s impact this time, will hold onto their rewards, limiting selling pressure and potentially boosting the price. Additionally, the halving reduces Bitcoin’s inflation rate from 1.7% to 0.85%, further enhancing its store-of-value appeal.

The CEO of Sound Planning Group and an investment adviser representative, David Stryzewski, gave an explanation of his belief that the price of bitcoin is about to experience a significant upswing on the Schwab Network on Thursday.

He clarified that the triggers for the rising price momentum for bitcoin are the impending halves of the cryptocurrency and the recently introduced spot exchange-traded funds (ETFs) that the U.S. Securities and Exchange Commission (SEC) approved last month.

Macroeconomic Tailwinds

The Federal Reserve’s dovish monetary policy stance, aimed at combating deflationary pressures, is another factor buoying Bitcoin’s prospects. The anticipation of interest rate cuts and increased liquidity injections into the financial system could benefit Bitcoin alongside other risk assets.

ETF Explosion

The long-awaited approval of Bitcoin Exchange-Traded Funds (ETFs) in late 2023 has opened the floodgates for institutional investors to enter the crypto market. These investment vehicles, which track the price of Bitcoin without requiring direct ownership, have already attracted billions of dollars in inflows. This surge in institutional participation is expected to continue in Q2 2024, potentially pushing the price of Bitcoin even higher.

The Impact Of US Elections 

Furthermore, the upcoming US presidential election in November 2024 could provide an additional tailwind. If a Bitcoin-friendly candidate emerges victorious, it could lead to policies that accelerate cryptocurrency adoption and further legitimize Bitcoin as an asset class.

Not Without Risks

The remarkable surge of Bitcoin as it tries to go a notch higher to the vaunted $70,000 level can be attributed to a convergence of key technical factors, propelling the cryptocurrency into uncharted territory. The relentless growth of the hash rate, improved scalability solutions, and ongoing developments in the blockchain ecosystem are collectively fueling this rally.

Featured image from Freepik, chart from TradingView

Bitcoin Price Rally In Jeopardy? Decoding Key Hurdles To More Upsides

Bitcoin price is attempting a fresh increase above the $52,000 resistance. BTC must clear the $52,800 resistance to continue higher in the near term.

  • Bitcoin price is gaining pace above the $52,800 resistance zone.
  • The price is trading above $52,000 and the 100 hourly Simple moving average.
  • There was a break above a key bearish trend line with resistance at $51,880 on the hourly chart of the BTC/USD pair (data feed from Kraken).
  • The pair could continue to move up if it clears the $52,800 resistance zone.

Bitcoin Price Eyes More Gains

Bitcoin price started a downside correction from the $52,800 resistance zone. BTC corrected lower below the $52,000 and $51,500 levels. However, the bulls were active above the $50,500 zone.

A low was formed near $50,581 and the price is now attempting a fresh increase. There was a move above the $51,200 and $51,500 resistance levels. The price cleared the 50% Fib retracement level of the downward move from the $52,843 swing high to the $50,581 low.

Besides, there was a break above a key bearish trend line with resistance at $51,880 on the hourly chart of the BTC/USD pair. Bitcoin is now trading above $52,000 and the 100 hourly Simple moving average.

Bitcoin Price

Source: BTCUSD on TradingView.com

Immediate resistance is near the $52,300 level. It is near the 76.4% Fib retracement level of the downward move from the $52,843 swing high to the $50,581 low. The next key resistance could be $52,800, above which the price could extend its rally. The next stop for the bulls may perhaps be $53,200. A clear move above the $53,200 resistance could send the price toward the $54,000 resistance. The next resistance could be near the $55,000 level.

Another Decline In BTC?

If Bitcoin fails to rise above the $52,300 resistance zone, it could start another downside correction in the near term. Immediate support on the downside is near the $51,850 level and the trend line.

The first major support is $51,300. If there is a close below $51,300, the price could gain bearish momentum. In the stated case, the price could decline toward the $50,500 support zone.

Technical indicators:

Hourly MACD – The MACD is now gaining pace in the bullish zone.

Hourly RSI (Relative Strength Index) – The RSI for BTC/USD is now above the 50 level.

Major Support Levels – $51,850, followed by $51,300.

Major Resistance Levels – $52,300, $52,800, and $54,000.

Is Bitcoin Price Facing A Correction To $46,000? Here’s What This Analyst Thinks

Over the past week, the Bitcoin price put in one of its finest performances since the start of 2024, breaking above $50,000 for the first time since 2021. While the premier cryptocurrency has been moving mostly sideways in the past few days, it continues to hold its own above the $51,000 mark.

However, a popular crypto analyst on the X platform has put forward an interesting prognosis for the Bitcoin price, stating that the coin might experience some bearish pressure in the near future.

Is BTC Headed To $46,000?

On Thursday, February 15, prominent crypto analyst Ali Martinez sounded the sell alarm – based on the Tom Demark Sequential indicator – for Bitcoin. According to the analyst, investors should anticipate a one-to-four candlesticks correction on BTC’s daily chart in the coming days.

Ali Martinez took to the X platform on Saturday, February 17, to share an in-depth analysis of an impending correction for the Bitcoin price. This evaluation is based on the distribution of holders’ cost basis across the various BTC price zones near the current price of the cryptocurrency.

With this on-chain indicator, the strength of any resistance or support level depends on the number of coins acquired by investors within the price range. And this strength is portrayed by how large or small the circles (representing the price ranges) are.

Bitcoin price

As shown in the chart above, the price of Bitcoin seems to be facing significant resistance between $51,099 and $52,582. Recognizing this pattern, Martinez said in his post that if the flagship cryptocurrency fails to reclaim the $52,000 level, then it is at risk of an 8% price correction. 

An 8% decline from the current point would see the Bitcoin price drop to between the $48,000 and $46,500 zone. According to the on-chain resistance data, more than 1 million addresses bought 544,870 BTC within this range, making it a significant support level.

Bitcoin Price Overview

As of this writing, the Bitcoin price stands at around $51,650, reflecting an almost 0.9% dip in the past 24 hours. Despite the recent bearish pressure slowing down its momentum, the market leader has maintained most of its profit from the past week.

According to data from CoinGecko, Bitcoin’s value has jumped by more than 8% in the last seven days. Meanwhile, the cryptocurrency has registered over 20% growth so far in the month of February.

Thanks to the recent price rise, BTC surpassed the $1 trillion mark in terms of market capitalization, solidifying its position as the largest asset in the cryptocurrency sector.

Bitcoin price

Bitcoin Bull Run: On-Chain Data Points To Declining Retail Participation

The price of Bitcoin has continued to soar this week, with the premier cryptocurrency consolidating its place above the $50,000 mark. Interestingly, on-chain data shows that a particular class of investors had less to do about the recent rally, sparking conversations about their participation in the current bull cycle.

Recent BTC Price Primarily Fueled By ‘Institutional Demand’

In a recent post on X, analyst Ali Martinez pointed out that there has been an apparent decline in the involvement of retail investors in the Bitcoin market. This shift comes despite the recent surge in the flagship cryptocurrency’s price.

This revelation is based on the noticeable fall in the daily creation of new Bitcoin addresses. According to the crypto intelligence platform Glassnode, this metric tracks the number of unique addresses that appeared for the first time in a transaction of the native coin in the network.

Bitcoin

Typically, more individuals are inclined to enter the market as the value of Bitcoin increases, often resulting in a spike in new addresses to store and transact the coin. However, there is currently a deviation between the BTC price and the creation of new addresses.

According to Martinez, this curious trend suggests a lack of retail participation in the ongoing Bitcoin bull run. The crypto analyst, however, tied the flagship cryptocurrency’s recent positive performance to institutional players’ activity.

This analysis seems to hold some weight, considering it’s been a little over a month since the Securities and Exchange Commission approved the trading of spot BTC exchange-traded funds in the United States. These investment products are issued and managed by some of the world’s largest financial companies, including BlackRock, Grayscale, Fidelity, and so on.

Bitcoin Whales Show Highest Activity Since 2022

Another on-chain revelation that somewhat supports the argument of increased institutional participation has emerged. According to analytics platform Santiment, BTC whale activity has been heating up lately, reaching its highest level in over 20 months.

Data from Santiment shows that wallets with 1,000 – 10,000 BTC are on an accumulation spree, adding roughly 249,000 coins (worth about $12.8 billion) in 2024 only. However, it is worth mentioning that a lower tier of investors (100 – 1,000 BTC) has sold more than 151,000 Bitcoin since the year started.

As of this writing, Bitcoin is valued at $51,950, reflecting a 0.6% decline in the past day. Nonetheless, the premier cryptocurrency has retained most of its weekly profit, having gained almost 10% in the last seven days.

Bitcoin

Bitcoin ETFs Threaten Gold’s Dominance As Digitalization Trends Gain Momentum

In just over a month since their approval by the US Securities and Exchange Commission (SEC), Bitcoin ETFs have swiftly gained traction in the market, posing a formidable challenge to the long-standing dominance of gold ETFs.

Bitcoin ETFs Gain Ground on Gold ETFs

The rapid rise of Bitcoin ETFs has led to a convergence in asset values, with BTC ETFs closing the gap with gold ETFs. Bitcoin ETFs hold approximately $37 billion in assets after only 25 trading days, while gold ETFs have accumulated $93 billion in over 20 years of trading. 

Bitcoin ETFs

In this regard, Bloomberg’s Senior Commodity Strategist, Mike McGlone, emphasizes the shifting landscape, stating, “Tangible Gold is Losing Luster to Intangible Bitcoin.” 

According to McGlone, the US stock market’s continued resilience, the US currency’s strength, and 5% interest rates have presented headwinds for gold. Moreover, as the world increasingly embraces digitalization, the emergence of Bitcoin ETFs in the United States adds further competition to the precious metal.

McGlone further states that while the bias for gold prices remains upward, investors who solely focus on gold may risk falling behind potential paradigm-shifting digitalization trends. 

Ultimately, McGlone suggests that investors should consider diversifying their portfolios by incorporating Bitcoin or other digital assets to stay ahead in the evolving investment landscape.

Bitcoin Rally Driven By Institutional Demand 

The success of Bitcoin ETFs is further demonstrated by recent data suggesting that the upward trend in Bitcoin prices is driven primarily by institutional demand. At the same time, retail participation appears to be declining.

According to analyst Ali Martinez, as the price of Bitcoin continues to hover between $51,800 and $52,100, there has been a noticeable decrease in the creation of new Bitcoin addresses daily, indicating a lack of retail participation in the current bull rally and highlighting the growing influence of institutional investors in the cryptocurrency market.

Bitcoin ETFs

However, market expert Crypto Con points out a significant shift in Long-Term Bitcoin holder positions, signaling a potential downside movement. 

As seen in the chart below shared by Crypto Con, the position change line crossed below -50.00 for the first time in over a year, a pattern that has historically occurred at critical moments in Bitcoin’s market cycles. These moments include the cycle bottom, mid-top (which occurred only once), and the start/end of a cycle top parabola (which occurred most frequently).

Bitcoin ETFs

According to Crypto Con, this recent shift in long-term holder positions raises two possible scenarios: a mid-top or an imminent parabolic movement. Such a movement at this stage in the cycle is considered unusual. 

Primarily, it indicates that long-term Bitcoin holders are exiting their positions in significant numbers, possibly anticipating a market correction or a change in the overall trend.

Overall, the shift in Bitcoin holder positions and the decline in retail participation present contrasting dynamics in the current market landscape. While institutional demand continues to drive the price of Bitcoin higher, long-term holders appear to be taking profit or adjusting their positions. 

BTC chart

While BTC is currently trading at $51,800, it remains to be seen what the direction of the next move will be and how institutions will continue to influence the price action of the largest cryptocurrency as spot Bitcoin ETFs gain traction.

Featured image from Shutterstock, chart from TradingView.com

Altcoins Like Solana And Ethereum Are About To Explode: Analyst

A technical indicator shift has sparked predictions of an imminent altcoin surge, with one analyst on X forecasting gains as sharp as those posted in 2017 and 2021.

This Technical Indicator Just Shifted To Green

Taking to X, the analyst said this optimism follows a change in the Gaussian Channel, a technical indicator used to assess market momentum. On X, the trader notes that the Gaussian Channel has, after weeks, flipped from red to green.

Reading from historical performance and indicator changes suggests that there could be a bullish shift for leading altcoins like Ethereum, Solana, and even Dogecoin in the days ahead.

Altcoins about to explode | Source: Analyst on X

However, from a technical standpoint, this upswing would be better confirmed once there is a comprehensive breakout above the immediate resistance. If this happens, the altcoin market could have a “parabolic” rally.

The broader crypto market is bullish, sparked by the encouraging Bitcoin rally. The world’s most valuable coin trades above $50,000, trending at December 2021 levels. Supporters are optimistic that not only will Bitcoin register more gains in the days ahead but will likely float to break November 2021 highs.

This uptick in demand follows institutions and investors leveraging spot Bitcoin exchange-traded funds (ETFs) to hold Bitcoin. 

Surging Bitcoin prices have immensely benefited coins like Solana and Ethereum and meme coins like BONK, which continue to trend. To illustrate, SOL is now trading above $100 despite a recent network outage that questioned the platform’s reliability. In January, SOL peaked at over $125.

Solana price trending upward on the daily chart | Source: SOLUSDT on Binance, TradingView

On the other hand, Ethereum continues to rally but remains below $3,000. Rising decentralized finance (DeFi) activity and optimism of the United States Securities and Exchange Commission (SEC) approving a spot Ethereum exchange-traded funds (ETF) continue to fuel demand. Recently, Franklin Templeton applied with the regulator for a spot in Ethereum ETF, joining BlackRock and Fidelity.

Altcoin Market Cap Approaches $1 Trillion

It is unclear how strongly altcoins will rally should buyers take over. Gauging from how leading altcoins like Solana and Cardano have performed in Q1 2024, it is likely that prices will explode to register new 2024 highs, breaking above 2023 resistance levels.

Altcoins market cap | Source: CoinMarketCap

Based on CoinMarketCap data, the altcoin market cap has nearly doubled. It is up from around $475 billion in late 2022 to over $910 billion when writing in mid-February. When altcoins peaked in November 2021, their cumulative market cap exceeded $1.6 trillion.

Bitcoin Short-Term Holders Just Locked In $647 Million In Profits

On-chain data from Glassnode shows that the Bitcoin short-term holders have recently participated in a massive $647 million profit-taking event.

Bitcoin Short-Term Holders Have Realized Large Net Profits Recently

According to data from the on-chain analytics firm Glassnode, the short-term holders have given a strong reaction to the $52,000 break. The “short-term holders” (STHs) here refer to the Bitcoin investors who bought their coins within the past 155 days.

Statistically, the longer an investor holds onto their coins, the less likely they become to sell at any point. The STHs have a relatively low holding time, so they easily sell during price rallies or crashes.

On the other hand, the “long-term holders” (LTHs), which make up the rest of the userbase (that is, those withholding time greater than 155 days), tend to carry a strong resolve.

Since the STHs are fickle-minded, it’s not surprising that they have made some selling moves after the latest rally in the asset. One way to gauge the reaction of this cohort is through the “Net Realized Profit/Loss” metric.

This indicator keeps track of the net profit or loss the investors realize across the network. The metric finds this value by going through the on-chain history of each coin being transferred right now to check the price it was moved at before.

Assuming that a change of hands occurred in the previous transfer and that another such change is happening with the current one, then the coin’s sale would realize a profit or loss equal to the difference between the two prices.

The Net Realized Profit/Loss sums up all such profits and losses and outputs the net value. Now, here is a chart that shows the trend in this indicator specifically for the Bitcoin STHs over the past few years:

Bitcoin STH Net Realized Profit/Loss

As displayed in the above graph, the Bitcoin STH Net Realized Profit/Loss has spiked to highly positive levels recently, implying that these investors’ profits have significantly outweighed the losses.

This cohort has realized $647 million in net profits during this latest selling spree. The chart shows that the last time the indicator was at higher positive values was back around the formation of the 2021 all-time high.

The current values aren’t off this mark, but the STH Net Realized Profit/Loss levels that hit back during the first half of the 2021 bull run are still far away. For perspective, the peak in the metric achieved back then was $2.5 billion, which remains the all-time high for the indicator.

BTC Price

Since the rapid surge above $52,000, Bitcoin has calmed down slightly, as it has moved sideways in the past few days. At present, BTC is trading at around $52,500.

Bitcoin Price Chart