Bitcoin Gearing Up For Recovery As Large Whales Stop Moving Old Coins

There may finally be light at the end of the tunnel for the Bitcoin price as selling has begun to subside for the cryptocurrency. So far, it seems that the large holders have been the main driving force behind the price decline, which could explain why the rally has been suppressed for so long. However, as these large investors start to scale back their selling, the Bitcoin price could be looking at another recovery.

Bitcoin Whales Stop Selling Old BTC

According to a report posted by Santiment, the reason for the suppressed Bitcoin price over the last week could be traced back to large Bitcoin holders. These holders who have a massive stash of old coins, which means coins that have not moved in a long time, had begun to move their coins after the price of BTC found its legs due to anticipation around the Spot ETF approvals.

Once these whales began to move these coins, there was a definite drop in the asset’s price that can be linked back to this move. As these whales moved these coins out of their wallets, the age of their BTC holdings went down, suggesting that they were selling these older coins.

On average, the age of their holdings went from around 640 days to around 624 days in the days following the Spot ETF approvals by the SEC. The on-chain tracker suggests that this was a sign that the market was back in the bull market.

However, after around a week of doing this, these whales seem to have come to a point where they are no longer moving coins. “There are mild signs that this continued movement of older coins is finally done for the time being,” Santiment said.

Now, while Santiment interprets this as a sign that the bull cycle may be over, there is also the possibility that these whales have stopped moving their coins in a bid to wait for the price to recover. In this case, selling pressure will recede, allowing Bitcoin the space to regain its footing once more.

Bitcoin price chart from Tradingview.com

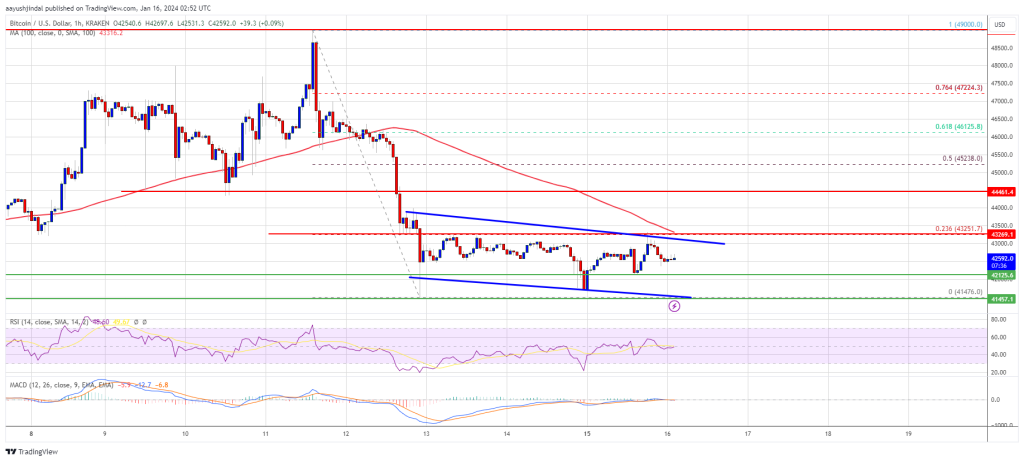
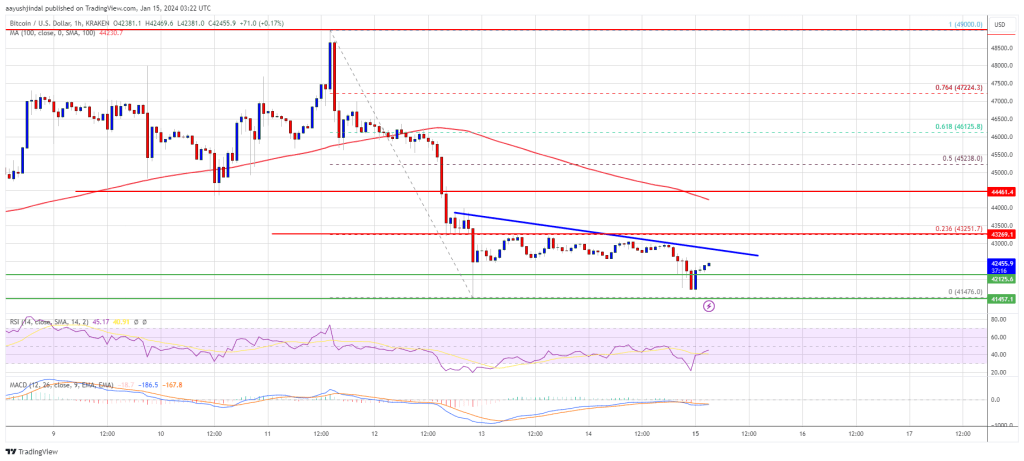
BTC Struggles With $43,000 Resistance

The Bitcoin price is currently struggling with the resistance mounting at $43,000. Since the crash last week, bulls have continued to lag behind as bears have chosen this level to pitch their tents. The sell pressure also seems to be localized at this point, so it has become the next important level to beat.

If Bitcoin is able to surmount the $43,000 resistance, it could signal a return of the rally. At this point, $45,000 becomes the next major resistance as investors flock back in. However, failure to turn $43,000 into support could result in a further decline in the price.

Bitcoin Bearish Forecast: Analyst Signals Continued Downfall

The price of Bitcoin appears to be experiencing a bearish moment in the past few days now despite the approval of multiple Bitcoin Spot Exchange-Traded Funds (ETFs), which has raised speculations about the token’s future.

Bitcoin Could See Further Collapse

Bitcoinhyper, a cryptocurrency analyst, has offered his insights on the current state of Bitcoin. The analyst unveiled his predictions to the community during one of his YouTube videos.

According to him, BTC is currently undergoing a decline, which could potentially lead to a further collapse in price. In the beginning, Bitcoinhyper noted an upswing in the price of Bitcoin to $49,000 following the approval of BTC spot ETFs by the SEC. 

However, the market did not react as anticipated, and there was a notable decline from the $49,000 price mark.  “Unfortunately, we got a significant dump, and in rejection, from $49,000,” he stated.

The analyst highlighted that BTC was up for several days before the ETF approval, with experts anticipating the crypto would hit $50,000. Thus, in a surprising turn of events, the asset’s price witnessed a drop of about 16%.

Bitcoin

In spite of the Bitcoin spot ETF approval, the market’s perception swiftly took an unpleasant shift. The correction took retail investors by surprise as they were unprepared since they had assumed that the price would rise.

With the crypto asset experiencing such a collapse in price, it is believed that the market will see a massive liquidation. Remarkably, during this decline, liquidations were not as large as anticipated.

Bitcoinhyper noted that during the decline, around $18.8 million in short positions were liquidated, which is less than expected. The news caused traders to become overconfident while ignoring the possibility of a correction.

No Positive Impact On BTC Price Despite Substantial Inflow

Reportedly, Bitcoin saw a whopping $1.18 billion inflow in digital assets funds worldwide following ETF approval. Despite the significant inflow of capital, the anticipated impact of boosting the price of BTC has not yet been realized.

On Monday, January 15, the price of BTC dropped below the support level of $42,000 as traders turned to Ethereum and other tokens. The approval of ETFs might be a “sell the news” moment, as BTC had dropped by 16% since the announcement.

As of now, it is crucial to observe that the market is becoming less enthusiastic about Bitcoin ETFs. A lot of people are now discussing the potential for an Ethereum ETF.

Currently, Bitcoin is trading at $42,951, indicating a decline of over 7% in the past seven days. Its trading volume is up by 3.86% in the last 24 hours, while its market cap is up by 0.75%, according to CoinMarketCap.

Bitcoin

Bitcoin Price Consolidates Losses, Why 100 SMA Is The Key To Recovery

Bitcoin price is struggling below the $43,500 resistance zone. BTC could start another decline if it stays below the 100 hourly SMA.

  • Bitcoin price started a major decline from the $49,000 resistance zone.
  • The price is trading below $43,250 and the 100 hourly Simple moving average.
  • There is a key declining channel forming with resistance near $43,050 on the hourly chart of the BTC/USD pair (data feed from Kraken).
  • The pair could start a fresh decline if it stays below the $43,250 resistance zone.

Bitcoin Price Turns Red

Bitcoin price started a major decline from the $49,000 resistance zone. BTC traded below the $46,500 and $45,000 support levels to enter a short-term bearish zone.

The bears even pushed the price below the $42,500 support zone before the bulls appeared. A low was formed near $41,476 and the price is now consolidating losses. It recovered a few points above the $42,000 level. The price tested the 23.6% Fib retracement level of the key drop from the $49,000 swing high to the $41,476 low.

Bitcoin is now trading below $43,250 and the 100 hourly Simple moving average. There is also a key declining channel forming with resistance near $43,050 on the hourly chart of the BTC/USD pair.

On the upside, immediate resistance is near the $43,000 level and the channel zone.  The first major resistance is $43,250 or the 100 hourly Simple moving average. A clear move above the $43,250 resistance could send the price toward the $44,450 resistance.

Bitcoin Price

Source: BTCUSD on TradingView.com

The next resistance is now forming near the $45,250 level. It is near the 50% Fib retracement level of the key drop from the $49,000 swing high to the $41,476 low. A close above the $45,250 level could start a strong increase and send the price higher. The next major resistance sits at $47,000.

More Losses In BTC?

If Bitcoin fails to rise above the $43,250 resistance zone, it could start a fresh decline. Immediate support on the downside is near the $42,120 level.

The next major support is $41,500. If there is a close below $41,500, the price could gain bearish momentum. In the stated case, the price could drop toward the $40,000 support in the near term.

Technical indicators:

Hourly MACD – The MACD is now losing pace in the bearish zone.

Hourly RSI (Relative Strength Index) – The RSI for BTC/USD is now below the 50 level.

Major Support Levels – $42,120, followed by $41,500.

Major Resistance Levels – $43,050, $43,250, and $44,450.

How Spot Bitcoin ETFs Could Catapult BTC Price To $500,000, According To This Crypto Trader

Ash Crypto, a prominent figure in the crypto trading community, predicted that the US spot Bitcoin Exchange-Traded Funds (ETFs) could propel BTC’s price to $500,000.

Bitcoin To Follow Gold’s ETF Success Story

The rationale behind Ash Crypto’s forecast stems from a comparison with gold, whose market capitalization witnessed a significant surge after the introduction of its ETFs. Historically, gold’s market cap escalated from approximately $2 trillion before the ETFs to roughly $16 trillion over the following years.

Ash Crypto posits that with its finite supply and growing popularity, Bitcoin might not only replicate but potentially exceed gold’s post-ETF trajectory. Considering Bitcoin’s current market cap of around $840 billion, reaching even half of gold’s market cap would catapult BTC’s value to “$500,000 in the coming years.”

The implications of Bitcoin’s rising market cap extend beyond the crypto sphere, encroaching on traditional financial markets. Ash Crypto points out the colossal market capitalizations of the global stock and bond markets, amounting to $109 trillion and $133 trillion, respectively.

The crypto trader suggests that as Bitcoin continues to establish itself as a legitimate financial asset, it will likely absorb a significant portion of the market cap from these traditional markets. This belief is grounded in the notion that Bitcoin offers a “novel value proposition, aligning with the investment preferences of a new generation of investors.”

Adding to this perspective, several trillion-dollar companies have begun promoting Bitcoin, signaling the advent of institutional investors in the crypto market.

These developments indicate a growing recognition of Bitcoin as a mainstream financial asset, further supporting the potential for a significant increase in its market cap. The crypto trader noted:

Now we have trillion dollar companies shilling Bitcoin for us with ads. Institutions are finally here and trillions are coming into crypto boyz!!

Ash Crypto further emphasizes that the journey to an $8 trillion market cap is a “long-term” vision that won’t “happen overnight,” advising investors to maintain focus beyond the market’s short-term volatility.

Global Mega Bank Foresees $200,000 Price Target

Furthermore, echoing Ash Crypto’s bullish stance, Standard Chartered’s Head of Digital Assets Research, Geoff Kendrick, and Precious Metal Analyst, Suki Cooper, forecasted a six digit price target for Bitcoin.

They project a potential target of $200,000 for Bitcoin, contingent upon an influx of $50 to $100 billion into the Spot Bitcoin ETFs. Their predictions draw parallels between the historical impact of Gold exchange-traded products (ETPs) and the expected trajectory of Spot Bitcoin ETFs, foreseeing a rapid development for the latter compared to the former.

Meanwhile, over the past week, Bitcoin has shown bearish price action. The asset has notably plunged over 5% over this period and has continued to decline even in the past 24 hours by 1.1%, with a current trading price of $42,419 at the time of writing.

Bitcoin price chart on TradingView

Featured image from Unsplash, Chart from TradingView

How Low Can Bitcoin Go? CryptoQuant Head Reveals Target

In the midst of Bitcoin’s recent price struggle, CryptoQuant head of research has revealed the level Bitcoin can potentially sink down to.

Bitcoin Might Go Down To As Low As Realized Price Of 1 To 3 Months Old Hands

In a new post on X, CryptoQuant Head of Research Julio Moreno has discussed how low the BTC price can go following the latest correction. “To evaluate this I like to look at the realized price of 1 to 3 month-old holders,” explains Moreno.

The “realized price” refers to an indicator that basically tells us about the average price at which investors in the Bitcoin market acquired their coins. This metric uses on-chain data to find the cost basis of holders, by assuming that the last transfer of any coin in circulation was when the coin changed hands.

When the spot price of the cryptocurrency is above the realized price, it means that the investors as a whole are carrying some unrealized gains currently. On the other hand, the price being lower than the metric suggests the overall market is underwater.

Naturally, when the realized price and spot price are exactly equal, the average investor in the sector could be assumed to be just breaking even on their investment.

In the context of the current topic, Moreno hasn’t applied the realized price to the entire user base but rather to just a segment of the investors: the 1-to 3-month-old holders.

The below chart shows the trend in the Bitcoin realized price for this particular holder group over the last year:

Bitcoin Short-Term Holder Realized Price

The 1 to 3 months old investors make up a part of the wider “short-term holder” (STH) cohort. The STHs are defined as investors who bought their coins within the last 155 days.

Thus, the holders who bought between 1 and 3 months ago would be on the younger side of this group. Generally, the STHs behave in a fickle manner, reacting to any significant changes in the market, like a rally or crash.

The more mature a holder’s coins become, the less likely the investor turns to show any such reaction. Since the 1 to 3-month-old hands, although not the youngest, are still young STHs, they are likely to react to price changes.

According to Moreno, the realized price of these STHs has “represented a support level historically and during 2023.” The reason behind the level being supported is likely the fact that these investors would closely watch their average cost basis and move to buy more when the price dips around there if the general mood around the market is bullish.

In times when the prevailing Bitcoin trend is bearish, the level can act as resistance instead, as these STHs would be willing to exit the market at their break-even point.

At present, the realized price of the 1 to 3-month-old STHs is $36,700. Given the historical pattern, it’s possible Bitcoin might dip to around there before finding support, if the current correction continues for long.

BTC Price

Since the asset’s price plunged under the $45,000 level a few days back, the Bitcoin price has been trading sideways around the $42,500 level.

Bitcoin Price Chart

Bitcoin To Reach $1 Million In Days To Weeks, Crypto Analyst

The CEO of Jan3 and Bitcoiner, Samson Mow, has once again reiterated his ultra-bullish prediction for Bitcoin. The Bitcoin advocate noted that the ‘Max Pain Theory’ was still in play, and this is one of the reasons why he isn’t backing down from his assertion that Bitcoin will hit this price level sooner rather than later. 

Bitcoin’s Rise To $1 Million To Happen “In Days To Weeks”

Samson Mow stated in an X (formerly Twitter) post that his “main prediction” is that Bitcoin’s run to $1 million will happen in “days to weeks.” However, he further claimed that the starting point for this meteoric rise has yet to be decided. 

The analyst’s bullish prediction for Bitcoin stems from his belief in the max pain theory, which relates to a Bitcoin price that could cause most options traders to experience maximum loss. In Mow’s opinion, Bitcoin bulls have experienced this loss following the approval of the Spot Bitcoin ETFs, and the bears could experience “some pain soon.”

Right before the approval order came in, Mow had predicted that Bitcoin was going to surge to $1 million in “days to weeks” and that most people were going to experience “max pain.” These ETFs also form part of the basis for why he believes that Bitcoin will hit this price level soon enough, as Mow foresees a huge demand for btc following this.

Mow says that the Bitcoin market is getting to a point where the existing supply will not meet current demand. He also alluded to the upcoming Bitcoin Halving, hinting that it could be one of the catalysts that will spark this parabolic rise in Bitcoin’s price. Interestingly, he had before now mentioned that Bitcoin will hit a new all-time high (ATH) before the Halving event takes place. 

Bitcoin price chart from Tradingview.com

A Market Adjustment Is Currently Ongoing

Mow also gave his opinion on the reason for Bitcoin’s recent decline as he noted that the market was simply adjusting. He further explained that GBTC holders were currently rotating out, which was pushing Bitcoin’s price down. He also alluded to how MicroStrategy’s stock was “trading below BTC par value.”

Therefore, the crypto community needs to be patient as “time is needed for everything to recalibrate,” Mow says. It shouldn’t be long for that to happen, though, as the crypto analyst claimed that the GBTC sell pressure “won’t be a long drawn out process.” 

He believes that many of GBTC’s investors won’t be able to offload their stocks because the “tax hit is too big” and that Grayscale will eventually capitulate on its fees. The asset manager currently has the largest fee among all Spot Bitcoin ETF issuers, and this is believed to be the reason why its investors are offloading their shares and rotating to other funds. 

Crypto Analyst Predicts Next Moves For Bitcoin As Price Dips

In the ever-fluctuating world of cryptocurrencies, crypto analyst Doctor Profit has shared his insights on the upcoming trajectory for Bitcoin amid the digital asset’s price decline.

Here’s What’s Next For Bitcoin

The cryptocurrency analyst took to the social media platform X (formerly Twitter) to share his projections with the crypto community. Doctor Profit offered his insights after correctly foreseeing the recent drop in BTC, which started at the $48,000 price mark.

The analyst correctly identified the $48,000 level as a major resistance level and advised the community to short at this level. His accuracy in predicting has brought him a great deal of reputation and trust in the cryptocurrency space. 

His recent predictions, which are detailed in the most recent Sunday report, cover technical, psychological, and market analysis. It also offers a sophisticated perspective on both the current status of Bitcoin and its possible future movements.

Doctor Profit pointed out the Exponential Moving Average (EMA50) as a crucial aspect in determining Bitcoin’s next moves. He noted the importance of the EMA50, highlighting that the current market wick dropped below it but closed above it, suggesting the market’s resiliency. 

The post read:

One of these facts is the power of EMA50 that should not be ignored. I mentioned its importance two weeks ago, and you can check how the latest wick got fully eaten below EMA50 and closed its candle above. 

Furthermore, he revealed the next price level for BTC, if any breakout occurs from the EMA50. “Very important to keep your eyes on EM50 any breakout of EMA will send us to our target of 39.500 regions,” he stated.

Emphasizing the current market dynamics, Doctor Profit characterized them as being manipulated by market makers. According to the analyst, the dump is part of a broader plan to wear down investors and instil dread in them.

However, as a result of the dump, he noted that prices will certainly go much higher in the coming months. He further urged investors to hold fast and avoid falling victim to market traps, as he believes the “mother of all bull markets” is imminent.

Phase Two Of The Analyst’s Big Prediction 

Doctor Profit highlighted that we are in phase two of his predictions which kickstarts the “big manipulation.” Additionally, the phase will lead to pumps and dumps in order to make investors “lose hope in Bitcoin.”

Bitcoin

Despite the current bearish period, Doctor Profit’s long-term forecast for Bitcoin is still bullish. He further emphasized that the “continuous correction will not put an end to the ETF pump.”

So far, the expert believes that the “real bull market has not yet begun.” Meanwhile, he expects the price of BTC to reach a new peak by the “end of the year.”

Related Reading: Bitcoin Price Stuck Below $48K Despite ETF Approval, Is This Bearish?

The price of Bitcoin is surprisingly down despite the approval of multiple BTC Spot Exchange-Traded Funds (ETFs) by the SEC. BTC is currently trading at $42,624, indicating a drop of 2.90% in the past week.

Bitcoin

Bitcoin Misery Worsens: King Crypto’s Worst Week Has Investors Shivering Near $35,000

The Bitcoin market is experiencing a period of adjustment following the much-anticipated launch of US spot ETFs last week. After a surge to a two-year high near $49,000, the leading cryptocurrency has pulled back over the past four days, currently trading at $42,588 with a market capitalization of $834 billion.

This correction presents an opportunity to assess the underlying dynamics and potential future trajectories of the digital asset.

ETF Approval Hype Fades: Markets React

The initial excitement surrounding the ETF approval was palpable, fueling a rapid price increase as investors anticipated increased accessibility and institutional adoption. However, profit-taking and market uncertainty quickly set in, pushing the price back down closer to pre-ETF levels.

This pattern aligns with the “buy the rumor, sell the fact” phenomenon often observed in financial markets, highlighting the distinction between anticipation and actualization.

Adding to the selling pressure are recent outflows from the Grayscale Bitcoin Trust. The massive fund, previously trading at a discount due to its closed-ended structure, converted into an ETF last week.

However, some investors opted to redeem their shares instead of transitioning to the new structure, resulting in a net outflow of $579 million. This suggests that liquidity considerations and potential portfolio adjustments played a role in the post-ETF price movement.

Furthermore, the activity of Bitcoin miners, the decentralized network responsible for validating transactions and generating new coins, presents another factor to consider. The Bitcoin Miners’ Position Index (MPI) spiked to 9.43 on January 12, indicating a significant increase in Bitcoin movement by miners.

While the exact reasons for this activity remain unclear, it could potentially signal profit-taking by miners who wish to capitalize on the recent price appreciation.

Despite the recent correction, analysts remain divided on the short-term and long-term prospects for Bitcoin. Ali Martinez, a prominent crypto analyst, identifies a “parallel channel” pattern in the price chart, suggesting a potential retracement to $35,000 before a potential rebound towards $50,000.

However, Martinez also acknowledges the risk of further downside pressure if miners continue to sell their holdings.

Bitcoin Outlook: Analysts Cautious Amid Complexity

Tony Sycamore, another market analyst, takes a more conservative approach, anticipating range-bound trading between $38,000 and $40,000 in the near future. Both analysts emphasize the importance of monitoring miner activity and investor sentiment in the coming weeks, as these factors will play a crucial role in determining the next directional move for Bitcoin.

Ultimately, the recent market dynamics highlight the complexity of the Bitcoin ecosystem. While the ETF launch represents a significant milestone for institutional adoption, it is not a guaranteed catalyst for immediate price appreciation.

Meanwhile, just a few days after the historic approval of spot Bitcoin ETFs in the US, the Crypto Fear and Greed Index has dropped back to “neutral” levels, last seen in October 2023.

The indicator shows that the current market sentiment score for Bitcoin is 52 out of 100, which is the lowest since October 19 of last year, when the price of Bitcoin was trading for about $31,000 on a daily average.

Featured image from Shutterstock

Bitcoin Price Turns At Risk of More Losses – Why BTC Could Revisit $40K

Bitcoin price topped near the $49,000 resistance zone. BTC started a major decline and broke many key supports at $45,000 to enter a short-term bearish zone.

  • Bitcoin peaked near the $49,000 level and started a steady decline.
  • The price is trading below $43,500 and the 100 hourly Simple moving average.
  • There is a connecting bearish trend line forming with resistance near $42,850 on the hourly chart of the BTC/USD pair (data feed from Kraken).
  • The pair could start a fresh decline if there is a move below the $41,500 support zone.

Bitcoin Price Takes Major Hit

Bitcoin price failed to test the $50,000 resistance zone. BTC peaked near the $49,000 level and started a major decline. There was a strong decline below the $48,000 and $46,500 support levels.

The bears even pushed the price below the $45,000 support zone. It declined over 12% and tested the $41,500 support zone. A low was formed near $41,476 and the price started a recovery wave. There was a minor increase above the $42,000 resistance zone.

However, Bitcoin is still trading below $43,500 and the 100 hourly Simple moving average. On the upside, immediate resistance is near the $42,800 level.

There is also a connecting bearish trend line forming with resistance near $42,850 on the hourly chart of the BTC/USD pair. The first major resistance is $43,250 or the 23.6% Fib retracement level of the downward move from the $49,000 swing high to the $41,476 low.

Bitcoin Price

Source: BTCUSD on TradingView.com

A clear move above the $43,250 resistance could send the price toward the $44,000 resistance. The next resistance is now forming near the $45,200 level. It is near the 50% Fib retracement level of the downward move from the $49,000 swing high to the $41,476 low. A close above the $45,300 level could start a strong increase and send the price higher. The next major resistance sits at $47,000.

More Losses In BTC?

If Bitcoin fails to rise above the $43,250 resistance zone, it could start a fresh decline. Immediate support on the downside is near the $42,120 level.

The next major support is $41,500. If there is a move below $41,500, the price could gain bearish momentum. In the stated case, the price could drop toward the $40,000 support in the near term.

Technical indicators:

Hourly MACD – The MACD is now losing pace in the bearish zone.

Hourly RSI (Relative Strength Index) – The RSI for BTC/USD is now below the 50 level.

Major Support Levels – $42,120, followed by $41,500.

Major Resistance Levels – $42,800, $43,250, and $44,000.

Spot Bitcoin ETFs Record Over $800 Million In Net Inflows in Debut Week – Details

On Wednesday, January 10, the US Securities and Exchange Commission (SEC) finally approved the launch of spot Bitcoin ETFs, representing a remarkable event in US trading history. 

So far, market data on these investment funds have confirmed theories of increased institutional demand for Bitcoin, with over $800 million in total net inflows and $3.6 billion in trading volume recorded across the first two days of trading. 

Although these inflows are yet to be reflected in BTC’s price, as the premier cryptocurrency dipped by 2% in the last week, the spot Bitcoin ETFs have certainly kicked off with a blast which is indicative of potential gains for the world’s largest asset and the general crypto market. 

Spot Bitcoin ETFs Attract Over $1.4 Billion In Two Days – Bloomberg Data

In an X post on January 13, Bloomberg ETF analyst Eric Balchunas shared some insight on the impressive performance of the spot Bitcoin ETFs in their debut trading week. 

Balchunas noted that of the 11 approved spot BTC ETFs, nine have recorded a total inflow of over $1.4 billion. Leading the lot is BlackRock’s IBIT, with an estimated asset inflow of $497.7 million, closely followed by Fidelity’s FBTC, which boasts about $422.3 million in investment. 

The BTC spot ETFs of Bitwise and ARK/21 Shares have also produced a significantly positive performance attracting $237.9 million and 105.2 million, respectively.  On the other hand, Grayscale’s GBTC has been the market outcast, recording a stunning $579 million in outflows over the first two days of trading. 

Bitcoin spot ETF

Following the SEC’s approval on Wednesday, investors cashed in heavily on GBTC, which was recently converted from a closed-end fund to a spot ETF. SkyBridge Capital founder Anthony Scaramucci has already commented on this trend describing it as one of the potential reasons behind Bitcoin’s dip in the last week. 

In total, the spot Bitcoin ETF market recorded an impressive net inflow of $818.9 million in its debut trading week. These figures are likely to improve in the next few weeks as selling volume eventually declines. Meanwhile, investors still anticipate the debut of Hashdex’s spot ETF – DEFI – which is undergoing fund conversion from the company’s Bitcoin futures ETF.

BTC Price Overview

At the time of writing, Bitcoin exchanges hands at $42,980 reflecting a 0.73% loss in the last day. Meanwhile, the token’s daily trading volume has plummeted by 62.33% and is now valued at $16.9 billion. However, with a market cap of $842.23 billion, Bitcoin remains the largest cryptocurrency in the world.

spot Bitcoin ETFs

Featured image from Yahoo Finance, chart from Tradingview

Bitcoin Hashrate Hits New All-Time High Amid Spot ETF Frenzy

Bitcoin’s hash rate, that is the network’s computing power, recently reached a new all-time high amidst the frenzy that came with the debut of spot Bitcoin ETFs in the US. According to data from IntoTheBlock, the Bitcoin hashrate reached an all-time high of 630.91 million TH/s or 630 EH/s on January 11, less than 24 hours after the U.S. Securities and Exchange Commission approved 11 Spot Bitcoin ETFs in the country.

Bitcoin Hashrate Reaches Record Highs

The hashrate measures the total combined computational power used to mine new bitcoins and process transactions. The Bitcoin mining hashrate has been on a steady rise since 2021 irrespective of market sentiment, be it bullish or bearish, cementing Bitcoin as the most secure cryptocurrency network. Based on the information provided by Coinwarz, the hashrate started 2023 at 266 EH/s and ended the year at 598 EH/s, a 125% growth. 

The hashrate spiked further to an all-time high of 630 EH/s on January 11, and the timing was no coincidence. The surge in hashrate came right after the SEC approved the first US Bitcoin Spot ETFs to open the doors for mainstream investors to invest in the top crypto without actually owning the asset.

https://x.com/intotheblock/status/1745826801106956323?s=20 

As expected, the approval of these ETFs led to a frenzy of activities in Bitcoin, pushing its on-chain volume to its highest since the collapse of crypto exchange FTX. Consequently, the hashrate also increased, indicating miners are ramping up operations in anticipation of increased interest and trading volume that often follows the launch of new ETFs.

BTC Price And Mining Profitability Fall

The approval of spot ETFs is a sign of mainstream acceptance that strengthens Bitcoin’s credibility. Despite the increase in trading volume and growth of the network, Bitcoin’s price seems to have deviated from this positive trend. The crypto’s price initially reacted positively to the approval of the spot ETFs, pushing it over $48,600, its highest point since April 2022. In a dramatic turn of events, this spike has since reversed, to give the notion of a “sell the news event.” 

At the time of writing, Bitcoin has retraced 11% from this local high and is trading just above $43,000. Trading volume has also fallen by 62% in the past 24 hours.

Bitcoin mining profitability, which saw steady growth in December has failed to react positively to the approval of spot ETFs. According to data from Hashrateindex, the drop in Bitcoin prices led to mining profitability falling to as low as $0.07958 per terahash/second per day on January 13th, a 22% decline from $0.10270 per terahash/second per day on January 1. 

Featured image from iStock

Bitcoin To $34,000? Analyst Predicts Next Move For BTC With This Chart Pattern

Bitcoin had a surprisingly underwhelming price performance over the past week despite the United States Securities and Exchange Commission (SEC) approving the trading of spot BTC ETFs. The price of the flagship cryptocurrency almost broke into $49,000 at the peak of this positive news but has since retraced back below $43,000.

Ali Martinez, a popular crypto analyst on the X platform, has offered insight into the current market climate of Bitcoin, highlighting that the cryptocurrency’s price may face further downward pressure over the coming weeks.

Analyst Forecasts 20% Price Drop For BTC 

In a recent post on X, the crypto pundit shared an update on his analysis of the Bitcoin’s price chart on the three-day timeframe. On January 4, Martinez initially identified an ascending parallel channel, which seems to be governing the Bitcoin price action since September 2023.

In price analysis, an ascending parallel channel is a technical analysis pattern that features two parallel upward-sloping trend lines. While it is mostly a bullish chart pattern, the ascending parallel channel can signal a short-term bearish move or even a trend reversal.

Bitcoin

Martinez noted in his post that the current setup appears to be holding true after the Bitcoin price faced rejection from the parallel channel’s upper boundary at $48,000. Following this price correction, the analyst has predicted $34,000 at the channel’s lower boundary as the natural next stop for the premier cryptocurrency.

A downward move to $34,000 would represent a significant 20% decline from Bitcoin’s current price point. However, according to Martinez’s analysis, it might not be looking all gloomy for the world’s largest cryptocurrency.

On the bright side, the analyst expects a quick recovery for the Bitcoin price after the downward spiral to $34,000. Martinez said that the pioneer crypto could make a rebound back to the upper boundary at $57,000.

Bitcoin Price Overview

As of press time, the Bitcoin price stands at $42,909, reflecting a negligible 0.6% decline in the past 24 hours. The premier cryptocurrency has struggled to hold above $43,000 since experiencing a massive downturn to below $42,000 on Friday.

Meanwhile, BTC’s profits since the turn of the year have been cut back to a mere 1.6%, putting the bullish future of the coin into question. Bitcoin is down by nearly 3% on the weekly timeframe, according to data from CoinGecko.

Nevertheless, BTC maintains its position as the largest asset in the cryptocurrency sector, with a market capitalization of roughly $841 billion.

Featured image from iStock, chart from TradingView

ETF Frenzy: Bitcoin Takes A Dip, Ethereum Goes Hot And The Next Crypto Chapter

In a week etched in crypto history, the long-awaited arrival of Bitcoin ETFs in the US sent shockwaves through the market. Yet, despite the monumental achievement, the king of crypto, Bitcoin, took a step back on Saturday, dipping 6% to end the week barely above $43,000.

Many analysts predicted a “sell-the-news” scenario, where investors cashed in on profits built upon anticipation of the ETF approval. Others suggest a rotation into Ethereum, which surged 15% on the week and touched highs not seen since May 2022.

Ethereum ETF Speculation: Shaping Crypto Narratives

This speculation is fueled by expectations of imminent Ethereum ETF decisions from the SEC, potentially mirroring the winds that propelled Bitcoin towards a 60% rally in recent months.

According to Alex Saunders, a Citi analyst, the cryptocurrency market has transitioned to a new narrative, as Ethereum has outperformed Bitcoin. This surge is believed to be driven by anticipation that the second-largest cryptocurrency could receive approval for an ETF.

“In our view, the crypto market has already moved to the next narrative, with ETH rallying more than bitcoin, likely on the expectation that crypto’s second largest token could also see an ETF approval,” Saunders said.

While the immediate price action might paint a contrasting picture, the significance of the ETF launch for Bitcoin’s long-term trajectory remains undeniable. Market participants across the board agree that ETFs will pave the way for increased institutional adoption, a crucial step towards legitimizing Bitcoin as a serious asset class.

Analysts at Citi anticipate “extra prominence” for Bitcoin in diversified portfolios, although widespread inclusion is still some distance away.

The road to crypto acceptance, however, isn’t paved solely with Bitcoin. Litecoin, often dubbed “silver to Bitcoin’s gold,” emerged as another bright spot this week, on track for an impressive 11% gain. This signifies diversification within the crypto landscape, a trend likely to continue with the potential influx of other crypto ETFs.

Crypto Equities Shake Amidst Bitcoin’s Slide

Beyond the digital coins themselves, the news wasn’t as rosy for crypto-related equities and miners. Coinbase and MicroStrategy, heavily invested in Bitcoin, took tumbles of 6% and 8%, respectively. Miners, already on the back foot after suffering substantial losses on Thursday, extended their descent, with CleanSpark and Iris Energy experiencing double-digit drops.

This market snapshot illustrates the dynamic nature of the crypto ecosystem. While Bitcoin might have taken a breather after its historic week, the overall sentiment remains positive. Ethereum’s ascent and the anticipation of broader ETF access signal a shift in investor focus, suggesting a future where the crypto playing field isn’t solely Bitcoin’s domain.

The dust settles on Bitcoin’s ETF debut, leaving a wobbly king and a market yearning for the next narrative. Ethereum, bathed in its own ETF hopes, gleams like a challenger. In this dance of highs and lows, understanding the evolving stories matters more than chasing fleeting profits. Bitcoin’s wobble may yet be a prelude to a high-flying future. The crypto saga, after all, has only just begun.

Featured image from Shutterstock