BNB Price Reclaims $600 and Bulls Could Now Aim For New 2024 High

BNB price is attempting a fresh increase from the $550 zone. The price cleared the $600 resistance and might extend its increase above $630.

  • BNB price started a fresh increase after it cleared the $550 resistance zone.
  • The price is now trading above $580 and the 100 simple moving average (4 hours).
  • There is a key bullish trend line forming with support at $592 on the 4-hour chart of the BNB/USD pair (data source from Binance).
  • The pair could gain bullish momentum if it clears the $608-$610 resistance zone.

BNB Price Gains Strength

After forming a base above the $520 level, BNB price started a fresh increase. There was a steady increase above the $550 and $565 resistance levels, like Ethereum and Bitcoin.

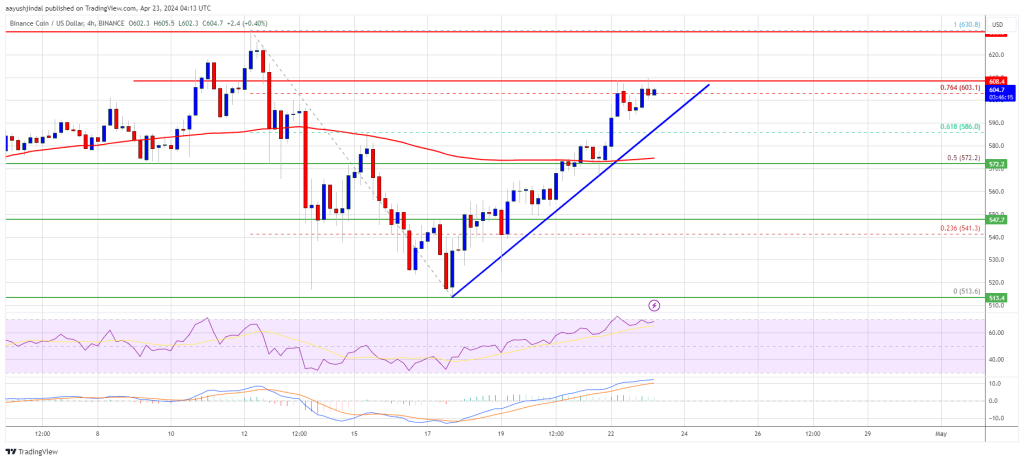
The bulls pushed the price above the $580 pivot level and the 61.8% Fib retracement level of the downward wave from the $630 swing high to the $512 low. More importantly, the price is now trading above $580 and the 100 simple moving average (4 hours).

It is consolidating just above the 76.4% Fib retracement level of the downward wave from the $630 swing high to the $512 low. There is also a key bullish trend line forming with support at $592 on the 4-hour chart of the BNB/USD pair.

BNB Price

Source: BNBUSD on TradingView.com

Immediate resistance is near the $608 level. The next resistance sits near the $630 level. A clear move above the $630 zone could send the price further higher. In the stated case, BNB price could test $650. A close above the $650 resistance might set the pace for a larger increase toward the $680 resistance. Any more gains might call for a test of the $720 level in the coming days.

Are Dips Supported?

If BNB fails to clear the $608 resistance, it could start a downside correction. Initial support on the downside is near the $592 level and the trend line.

The next major support is near the $585 level. The main support sits at $570. If there is a downside break below the $570 support, the price could drop toward the $550 support. Any more losses could initiate a larger decline toward the $532 level.

Technical Indicators

4-Hours MACD – The MACD for BNB/USD is gaining pace in the bullish zone.

4-Hours RSI (Relative Strength Index) – The RSI for BNB/USD is currently above the 50 level.

Major Support Levels – $592, $585, and $570.

Major Resistance Levels – $608, $630, and $650.
BNB Price May Have Another Chance For A Bullish Streak: Here’s How

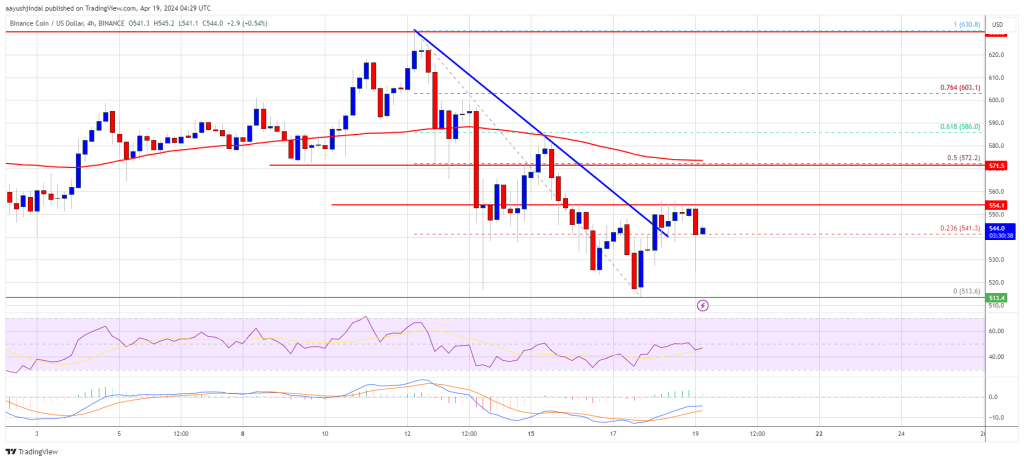
BNB price is attempting a fresh increase from the $515 zone. The price could gain bullish momentum if it clears the $572 resistance zone.

  • BNB price started a fresh increase after it found support near the $515 zone.
  • The price is now trading below $555 and the 100 simple moving average (4 hours).
  • There was a break above a key bearish trend line with resistance at $540 on the 4-hour chart of the BNB/USD pair (data source from Binance).
  • The pair could gain bullish momentum if it clears the $572 resistance zone.

BNB Price Faces Hurdles

After a downside correction below $550, BNB price found support near the $515 zone. A low was formed at $513.6 and the price started a recovery wave, like Ethereum and Bitcoin.

There was a move above the $525 and $530 resistance levels. The bulls pushed the price above the $540 pivot level and the 23.6% Fib retracement level of the downward move from the $630 swing high to the $513 low. There was also a break above a key bearish trend line with resistance at $540 on the 4-hour chart of the BNB/USD pair.

The price is still trading below $550 and the 100 simple moving average (4 hours). Immediate resistance is near the $555 level. The next resistance sits near the $572 level or the 50% Fib retracement level of the downward move from the $630 swing high to the $513 low.

BNB Price

Source: BNBUSD on TradingView.com

A clear move above the $572 zone could send the price further higher. In the stated case, BNB price could test $600. A close above the $600 resistance might set the pace for a larger increase toward the $630 resistance. Any more gains might call for a test of the $650 level in the coming days.

Another Decline?

If BNB fails to clear the $572 resistance, it could start another decline. Initial support on the downside is near the $532 level.

The next major support is near the $520 level. The main support sits at $515. If there is a downside break below the $515 support, the price could drop toward the $500 support. Any more losses could initiate a larger decline toward the $465 level.

Technical Indicators

4-Hours MACD – The MACD for BNB/USD is losing pace in the bullish zone.

4-Hours RSI (Relative Strength Index) – The RSI for BNB/USD is currently below the 50 level.

Major Support Levels – $532, $520, and $515.

Major Resistance Levels – $555, $572, and $600.

BNB Price Regains Strength As The Bulls Aim For $650

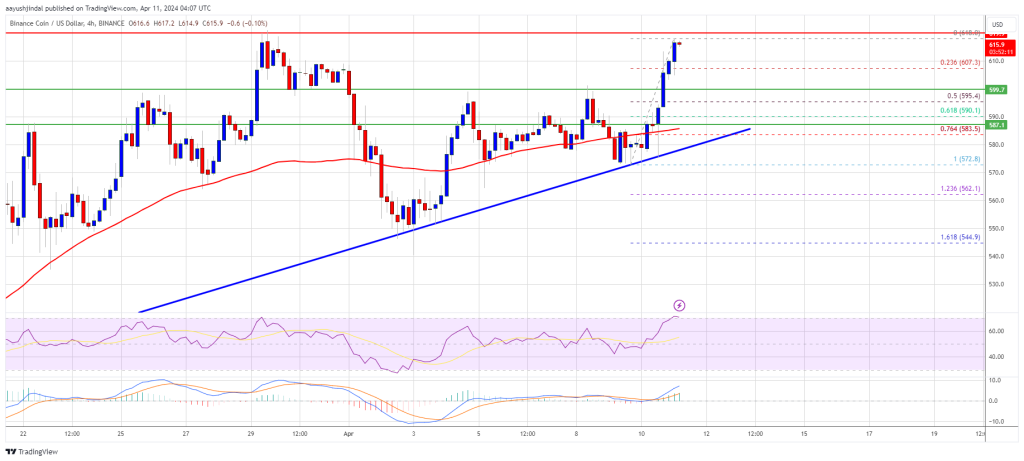
BNB price is attempting a fresh increase from the $575 zone. The price is up over 5% and the bulls seem to be aiming for a move above $620.

  • BNB price started a fresh increase after it found support near the $575 zone.
  • The price is now trading above $600 and the 100 simple moving average (4 hours).
  • There is a key bullish trend line forming with support at $587 on the 4-hour chart of the BNB/USD pair (data source from Binance).
  • The pair could gain bullish momentum if it clears the $620 resistance zone.

BNB Price Could Surge 15%

After a downside correction below $600, BNB price found support near the $575 zone. A low was formed at $572.8 and the price started a fresh increase, unlike Ethereum and Bitcoin.

There was a move above the $595 and $600 resistance levels. The bulls pushed the price above the $605 pivot level. It is up over 5% and showing many positive signs above the 23.6% Fib retracement level of the recent increase from the $572.8 swing low to the $618.0 high.

The price is now trading above $600 and the 100 simple moving average (4 hours). There is also a key bullish trend line forming with support at $587 on the 4-hour chart of the BNB/USD pair.

BNB Price

Source: BNBUSD on TradingView.com

Immediate resistance is near the $618 level. The next resistance sits near the $620 level. A clear move above the $620 zone could send the price further higher. In the stated case, BNB price could test $632. A close above the $632 resistance might set the pace for a larger increase toward the $650 resistance. Any more gains might call for a test of the $700 level in the coming days.

Another Decline?

If BNB fails to clear the $620 resistance, it could start a downside correction. Initial support on the downside is near the $600 level.

The next major support is near the $590 level and the trend line or the 61.8% Fib retracement level of the recent increase from the $572.8 swing low to the $618.0 high. The main support sits at $575. If there is a downside break below the $575 support, the price could drop toward the $562 support. Any more losses could initiate a larger decline toward the $550 level.

Technical Indicators

4-Hours MACD – The MACD for BNB/USD is gaining pace in the bullish zone.

4-Hours RSI (Relative Strength Index) – The RSI for BNB/USD is currently above the 50 level.

Major Support Levels – $600, $585, and $575.

Major Resistance Levels – $620, $632, and $650.

BNB Price Rally In Jeopardy? Decoding Key Hurdles To Fresh Increase

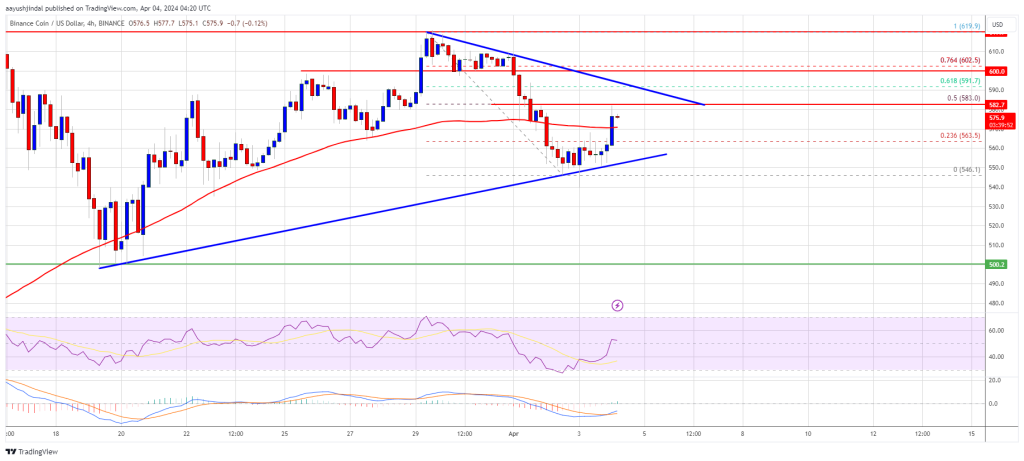
BNB price is attempting a fresh increase from the $545 zone. The price could gain bullish momentum if it clears the $585 and $590 resistance levels.

  • BNB price started a fresh increase after it found support near the $545 zone.
  • The price is now trading above $560 and the 100 simple moving average (4 hours).
  • There is a key contracting triangle forming with resistance near $585 on the 4-hour chart of the BNB/USD pair (data source from Binance).
  • The pair could attempt a fresh rally if it clears the $590 resistance zone.

BNB Price Eyes Fresh Surge

After a downside correction from $620, BNB price found support near the $545 zone. A low was formed at $546.1 and the price started a fresh increase, unlike Ethereum and Bitcoin.

There was a move above the $560 and $565 resistance levels. The bulls pushed the price above the 23.6% Fib retracement level of the downward move from the $619 swing high to the $546 low. The price is now trading above $560 and the 100 simple moving average (4 hours).

Immediate resistance is near the $585 level. There is also a key contracting triangle forming with resistance near $585 on the 4-hour chart of the BNB/USD pair. It is close to the 50% Fib retracement level of the downward move from the $619 swing high to the $546 low.

BNB Price

Source: BNBUSD on TradingView.com

The next resistance sits near the $590 level. A clear move above the $590 zone could send the price further higher. In the stated case, BNB price could test $620. A close above the $620 resistance might set the pace for a larger increase toward the $640 resistance. Any more gains might call for a test of the $700 level in the coming days.

Another Decline?

If BNB fails to clear the $590 resistance, it could start another decline. Initial support on the downside is near the $555 level and the trend line.

The next major support is near the $545 level. The main support sits at $532. If there is a downside break below the $532 support, the price could drop toward the $500 support. Any more losses could initiate a larger decline toward the $465 level.

Technical Indicators

4-Hours MACD – The MACD for BNB/USD is gaining pace in the bullish zone.

4-Hours RSI (Relative Strength Index) – The RSI for BNB/USD is currently above the 50 level.

Major Support Levels – $555, $545, and $532.

Major Resistance Levels – $585, $590, and $620.

BNB Price Could Resume Upside Unless The Bulls Fail At $610

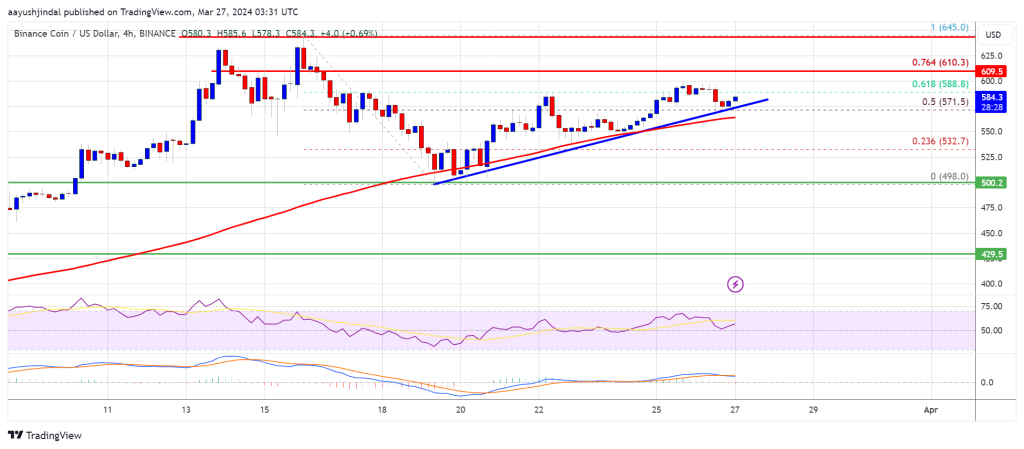
BNB price is attempting a fresh increase from the $500 zone. The price could gain bullish momentum if it clears the $588 and $610 resistance levels.

  • BNB price started a fresh increase above the $520 and $540 levels.
  • The price is now trading above $575 and the 100 simple moving average (4 hours).
  • There is a key bullish trend line forming with support near $580 on the 4-hour chart of the BNB/USD pair (data source from Binance).
  • The pair could attempt a fresh rally if it clears the $610 resistance zone.

BNB Price Eyes Fresh Surge

After a downside correction from $645, BNB price found support near the $500 zone. A low was formed at $498 and the price started a fresh increase, like Ethereum and Bitcoin.

There was a move above the $520 and $550 resistance levels. The bulls pushed the price above the 50% Fib retracement level of the downward move from the $645 swing high to the $498 low. The price is now trading above $575 and the 100 simple moving average (4 hours).

There is also a key bullish trend line forming with support near $580 on the 4-hour chart of the BNB/USD pair. Immediate resistance is near the $588 level. It is close to the 61.8% Fib retracement level of the downward move from the $645 swing high to the $498 low.

BNB Price

Source: BNBUSD on TradingView.com

The next resistance sits near the $610 level. A clear move above the $610 zone could send the price further higher. In the stated case, BNB price could test $645. A close above the $645 resistance might set the pace for a larger increase toward the $680 resistance. Any more gains might call for a test of the $700 level in the coming days.

Another Decline?

If BNB fails to clear the $610 resistance, it could start another decline. Initial support on the downside is near the $580 level and the trend line.

The next major support is near the $560 level. The main support sits at $540. If there is a downside break below the $540 support, the price could drop toward the $500 support. Any more losses could initiate a larger decline toward the $450 level.

Technical Indicators

4-Hours MACD – The MACD for BNB/USD is gaining pace in the bullish zone.

4-Hours RSI (Relative Strength Index) – The RSI for BNB/USD is currently above the 50 level.

Major Support Levels – $580, $560, and $540.

Major Resistance Levels – $598, $610, and $640.

BNB Price Could Restart Rally If It Is Able To Hold This Key Support

BNB price rallied further above $600 before it faced sellers. The price corrected gains and now testing an important support at $500.

  • BNB price started a downside correction from the $645 resistance zone.
  • The price is now trading near $515 and the 100 simple moving average (4 hours).
  • There is a key bearish trend line forming with resistance near $520 on the 4-hour chart of the BNB/USD pair (data source from Binance).
  • The pair could attempt a fresh increase if it stays above the $500 support zone.

BNB Price Holds Support

In the last BNB price prediction, we discussed the chances of more gains above the $550 resistance zone. The price continued to rise and broke many hurdles near the $580 level.

BNB even outperformed Bitcoin and Ethereum with a move above the $600 resistance. Finally, it faced resistance near the $645 zone. A high was formed near $645 and the price recently started a downside correction. There was a move below the $600 level.

The price declined below the 23.6% Fib retracement level of the upward move from the $365 swing low to the $645 high. The price is now trading near $515 and the 100 simple moving average (4 hours). Immediate resistance is near the $520 level.

There is also a key bearish trend line forming with resistance near $520 on the 4-hour chart of the BNB/USD pair. The next resistance sits near the $550 level. A clear move above the $550 zone could send the price further higher.

BNB Price

Source: BNBUSD on TradingView.com

In the stated case, BNB price could test $580. A close above the $580 resistance might set the pace for a larger increase toward the $600 resistance. Any more gains might call for a test of the $645 level in the coming days.

More Losses?

If BNB fails to clear the $520 resistance, it could continue to move down. Initial support on the downside is near the $500 level or the 50% Fib retracement level of the upward move from the $365 swing low to the $645 high.

The next major support is near the $470 level. The main support sits at $430. If there is a downside break below the $430 support, the price could drop toward the $400 support. Any more losses could initiate a larger decline toward the $350 level.

Technical Indicators

4-Hours MACD – The MACD for BNB/USD is gaining pace in the bearish zone.

4-Hours RSI (Relative Strength Index) – The RSI for BNB/USD is currently below the 50 level.

Major Support Levels – $500, $470, and $430.

Major Resistance Levels – $520, $550, and $580.

BNB Price Breaks $600, Why Bulls Could Now Aim New ATH

BNB price is gaining bullish momentum above the $550 resistance. The price is showing positive signs and might extend its rally above $650.

  • BNB price is up over 15% and it broke the $600 resistance zone.
  • The price is now trading above $580 and the 100 simple moving average (4 hours).
  • There is a key bullish trend line forming with support at $598 on the 4-hour chart of the BNB/USD pair (data source from Binance).
  • The pair could continue to rise toward the $650 resistance zone or even $700.

BNB Price Extends Rally

In the last BNB price prediction, we discussed the chances of more gains above the $500 resistance zone. The price continued to rise and broke many hurdles near the $550 level.

BNB is now outperforming Bitcoin and Ethereum with a move above the $580 resistance. It is up over 10% today and trading above $600. A high was formed near $633 and the price is now consolidating gains. It is trading above the 23.6% Fib retracement level of the upward move from the $364 swing low to the $633 high.

The price is now trading above $600 and the 100 simple moving average (4 hours). Immediate resistance is near the $625 level. The next resistance sits near the $635 level. A clear move above the $635 zone could send the price further higher.

BNB Price

Source: BNBUSD on TradingView.com

In the stated case, BNB price could test $650. A close above the $650 resistance might set the pace for a larger increase toward the $700 resistance. Any more gains might call for a test of the $780 level in the coming days.

Dips Limited?

If BNB fails to clear the $635 resistance, it could start a downside correction. Initial support on the downside is near the $600 level and the trend line.

The next major support is near the $570 level. The main support sits at $500 or the 50% Fib retracement level of the upward move from the $364 swing low to the $633 high. If there is a downside break below the $500 support, the price could drop toward the $450 support. Any more losses could initiate a larger decline toward the $420 level.

Technical Indicators

4-Hours MACD – The MACD for BNB/USD is gaining pace in the bullish zone.

4-Hours RSI (Relative Strength Index) – The RSI for BNB/USD is currently above the 50 level.

Major Support Levels – $600, $570, and $500.

Major Resistance Levels – $635, $650, and $700.

BNB Price Zooms 10%, Here Are Next Possible Barriers For Bulls

BNB price is gaining bullish momentum above the $450 resistance. The price is signaling a strong uptrend and might soon surpass the $500 resistance.

  • BNB price is showing bullish signs above the $450 resistance level.
  • The price is now trading above $465 and the 100 simple moving average (4 hours).
  • There was a break above a connecting trend line with resistance at $430 on the 4-hour chart of the BNB/USD pair (data source from Binance).
  • The pair could continue to rise toward the $500 resistance zone or even $520.

BNB Price Extends Rally

In the last BNB price prediction, we discussed the chances of more gains above the $400 resistance zone. The bulls did remain active and were able to push the price above the $400 level.

BNB is now outperforming Bitcoin and Ethereum with a move above the $450 resistance. There was a break above a connecting trend line with resistance at $430 on the 4-hour chart of the BNB/USD pair. It is up over 10% today and trading above $470.

A high was formed near $478 and the price is now consolidating gains. It is trading above the 23.6% Fib retracement level of the upward move from the $364 swing low to the $478 high.

The price is now trading above $465 and the 100 simple moving average (4 hours). Immediate resistance is near the $475 level. The next resistance sits near the $488 level. A clear move above the $488 zone could send the price further higher.

BNB Price

Source: BNBUSD on TradingView.com

In the stated case, BNB price could test $500. A close above the $500 resistance might set the pace for a larger increase toward the $520 resistance. Any more gains might call for a test of the $542 level in the coming days.

Dips Supported?

If BNB fails to clear the $475 resistance, it could start a downside correction. Initial support on the downside is near the $4620 level.

The next major support is near the $450 level. The main support sits at $420 or the 50% Fib retracement level of the upward move from the $364 swing low to the $478 high. If there is a downside break below the $420 support, the price could drop toward the $400 support. Any more losses could initiate a larger decline toward the $380 level.

Technical Indicators

4-Hours MACD – The MACD for BNB/USD is gaining pace in the bullish zone.

4-Hours RSI (Relative Strength Index) – The RSI for BNB/USD is currently above the 50 level.

Major Support Levels – $460, $450, and $420.

Major Resistance Levels – $475, $500, and $520.

BNB Price Starts Its Journey Toward $500, Why Dips Turned Attractive

BNB price is gaining bullish momentum above the $350 resistance. The price looks set for more gains above the $400 resistance in the near term.

  • BNB price is showing bullish signs above the $365 resistance level.
  • The price is now trading above $375 and the 100 simple moving average (4 hours).
  • There is a key bullish trend line forming with support at $380 on the 4-hour chart of the BNB/USD pair (data source from Binance).
  • The pair could continue to rise toward the $400 resistance zone or even $422.

BNB Price Extends Increase

In the last BNB price prediction, we discussed the chances of more gains above the $365 resistance zone. The bulls did remain active and were able to push the price above the $375 level.

BNB outperformed Bitcoin and Ethereum with a move above the $380 resistance. A high was formed near $390 and the price is now consolidating gains. It is trading above the 23.6% Fib retracement level of the upward move from the $345 swing low to the $390 high.

The price is now trading above $375 and the 100 simple moving average (4 hours). There is also a key bullish trend line forming with support at $380 on the 4-hour chart of the BNB/USD pair.

BNB Price

Source: BNBUSD on TradingView.com

Immediate resistance is near the $390 level. The next resistance sits near the $392 level. A clear move above the $392 zone could send the price further higher. In the stated case, BNB price could test $400. A close above the $400 resistance might set the pace for a larger increase toward the $422 resistance. Any more gains might call for a test of the $500 level in the coming weeks.

Dips Supported?

If BNB fails to clear the $390 resistance, it could start a downside correction. Initial support on the downside is near the $380 level and the trend line.

The next major support is near the $362 level or the 61.8% Fib retracement level of the upward move from the $345 swing low to the $390 high. The main support sits at $350. If there is a downside break below the $350 support, the price could drop toward the $335 support. Any more losses could initiate a larger decline toward the $315 level.

Technical Indicators

4-Hours MACD – The MACD for BNB/USD is gaining pace in the bullish zone.

4-Hours RSI (Relative Strength Index) – The RSI for BNB/USD is currently above the 50 level.

Major Support Levels – $380, $362, and $350.

Major Resistance Levels – $390, $400, and $422.

BNB Price Surges Over 5%, Why Bulls Could Aim For $400 In Feb 2024

BNB price is gaining bullish momentum from the $315 support zone. The price could extend its rally above $375 and rise toward the $400 level in the near term.

  • BNB price is showing bullish signs above the $350 pivot level.
  • The price is now trading above $355 and the 100 simple moving average (4 hours).
  • There is a key bullish trend line forming with support at $354 on the 4-hour chart of the BNB/USD pair (data source from Binance).
  • The pair could gather bullish momentum if there is a close above the $365 resistance zone.

BNB Price Regains Strength

In the past few days, BNB price started a decent increase and cleared the $335 resistance zone. There was a move above the $350 level to move into a positive zone, like Bitcoin and Ethereum.

The price even spiked above $365. A high was formed near $366 and the price is now consolidating gains above the 23.6% Fib retracement level of the upward move from the $315 swing low to the $366 high. BNB is now trading above $355 and the 100 simple moving average (4 hours).

There is also a key bullish trend line forming with support at $354 on the 4-hour chart of the BNB/USD pair. Immediate resistance is near the $365 level.

BNB Price

Source: BNBUSD on TradingView.com

The next resistance sits near the $375 level. A clear move above the $375 zone could send the price further higher. In the stated case, BNB price could test $388. A close above the $388 resistance might set the pace for a larger increase toward the $400 resistance. Any more gains might call for a test of the $420 level.

Dips Supported?

If BNB fails to clear the $365 resistance, it could start a downside correction. Initial support on the downside is near the $355 level and the trend line.

The next major support is near the $342 level or the 50% Fib retracement level of the upward move from the $315 swing low to the $366 high. The main support sits at $335. If there is a downside break below the $335 support, the price could drop toward the $322 support. Any more losses could initiate a larger decline toward the $315 level.

Technical Indicators

4-Hours MACD – The MACD for BNB/USD is gaining pace in the bullish zone.

4-Hours RSI (Relative Strength Index) – The RSI for BNB/USD is currently above the 50 level.

Major Support Levels – $355, $342, and $335.

Major Resistance Levels – $365, $375, and $388.

BNB Price Increase To Continue? This Resistance Could Trigger Fresh Rally

BNB price is attempting a fresh increase from the $288 zone. The price could start a fresh rally if there is a clear move above the $310 resistance.

  • BNB price is showing bullish signs above the $300 pivot level.
  • The price is now trading below $310 and the 100 simple moving average (4 hours).
  • There is a key bearish trend line forming with resistance near $306 on the 4-hour chart of the BNB/USD pair (data source from Binance).
  • The pair gather bullish momentum if there is a close above the $308-$310 resistance zone.

BNB Price Eyes Fresh Rally

In the past few days, BNB price started a decent increase and cleared the $300 resistance zone, unlike Bitcoin and Ethereum. There was a move above the $305 level before the bears appeared.

A high was formed near $313 and the price recently started a downside correction. There was a move below the $308 level. The price declined below the 50% Fib retracement level of the upward move from the $287 swing low to the $313 high.

BNB is now consolidating near $305 and the 100 simple moving average (4 hours). Immediate resistance is near the $308 level. There is also a key bearish trend line forming with resistance near $306 on the 4-hour chart of the BNB/USD pair.

BNB Price

Source: BNBUSD on TradingView.com

The next resistance sits near the $310 level. A clear move above the $310 zone could send the price further higher. In the stated case, BNB price could test $320. A close above the $320 resistance might set the pace for a larger increase toward the $335 resistance. Any more gains might call for a test of the $350 level.

Another Decline?

If BNB fails to clear the $310 resistance, it could continue to move down. Initial support on the downside is near the $300 level. The next major support is near the $292 level or the 76.4% Fib retracement level of the upward move from the $287 swing low to the $313 high.

The main support sits at $288. If there is a downside break below the $288 support, the price could drop toward the $275 support. Any more losses could initiate a larger decline toward the $262 level.

Technical Indicators

4-Hours MACD – The MACD for BNB/USD is losing pace in the bullish zone.

4-Hours RSI (Relative Strength Index) – The RSI for BNB/USD is currently above the 50 level.

Major Support Levels – $300, $292, and $288.

Major Resistance Levels – $308, $310, and $320.

BNB Price Could See Major Drawdown If It Fails To Stay Above This Support

BNB price started a fresh decline from $320 resistance zone. The price is now retesting the $290 support and is at risk of more downsides.

  • BNB price is gaining bearish momentum from the $320 resistance.
  • The price is now trading below $310 and the 100 simple moving average (4 hours).
  • There was a break below a key bullish trend line with support at $315 on the 4-hour chart of the BNB/USD pair (data source from Binance).
  • The pair might continue to move down if it fails to stay above the $290 support.

BNB Price Takes Hit

In the past few days, BNB price made more than three attempts to clear the $320 resistance zone. However, the bears remained active and protected more gains.

As a result, there was a bearish reaction below the $315 level, like Bitcoin and Ethereum. There was a break below a key bullish trend line with support at $315 on the 4-hour chart of the BNB/USD pair. The pair even declined below the $300 level and tested the key support at $290.

A low is formed near $290.3, and the price is now struggling to correct higher. BNB price is now trading below $310 and the 100 simple moving average (4 hours). Immediate resistance is near the $298 level or the 23.6% Fib retracement level of the recent decline from the $320 swing high to the $290 low.

BNB Price

Source: BNBUSD on TradingView.com

The next resistance sits near the $305 level. It is close to the 50% Fib retracement level of the recent decline from the $320 swing high to the $290 low. A clear move above the $305 zone could send the price further higher. In the stated case, BNB price could test $320. A close above the $320 resistance might set the pace for a larger increase toward the $335 resistance. Any more gains might call for a test of the $350 level.

More Downsides?

If BNB fails to clear the $305 resistance, it could continue to move down. Initial support on the downside is near the $290 level.

The next major support is near the $285 level. The main support sits at $272. If there is a downside break below the $272 support, the price could drop toward the $250 support. Any more losses could initiate a larger decline toward the $220 level.

Technical Indicators

4-Hours MACD – The MACD for BNB/USD is gaining pace in the bearish zone.

4-Hours RSI (Relative Strength Index) – The RSI for BNB/USD is currently below the 50 level.

Major Support Levels – $290, $285, and $272.

Major Resistance Levels – $298, $305, and $320.

BNB Price Signals Bullish Exhaustion, Are Dips Attractive In Short-term?

BNB price is struggling to clear the $320 resistance zone. It might decline toward the $288 support zone before the bulls aim for another increase.

  • BNB price is struggling to gain traction above the $320 resistance.
  • The price is now trading near $310 and the 100 simple moving average (4 hours).
  • There is a major declining channel or a bullish flag pattern forming with resistance near $316 on the 4-hour chart of the BNB/USD pair (data source from Binance).
  • The pair might continue to move up if it stays above the $288 and $282 support levels.

BNB Price Holds Support

After forming a base above the $280 level, BNB price started a decent increase. There was a move above the $305 and $315 resistance levels. However, the bears seem to be active near the $320 zone.

A high was formed near $320 and the price is now correcting gains. However, the downsides are limited compared to Bitcoin and Ethereum. There was a move below the $312 level. The price is now approaching the 50% Fib retracement level of the upward move from the $289.4 swing low to the $320.1 high.

BNB price is now trading near $310 and the 100 simple moving average (4 hours). There is also a major declining channel or a bullish flag pattern forming with resistance near $316 on the 4-hour chart of the BNB/USD pair.

BNB Price

Source: BNBUSD on TradingView.com

Immediate resistance is near the $315 level or the channel region. The next resistance sits near the $320 level. A clear move above the $320 zone could send the price further higher. In the stated case, BNB price could test $340. A close above the $340 resistance might set the pace for a larger increase toward the $350 resistance. Any more gains might call for a test of the $375 level.

More Downsides?

If BNB fails to clear the $315 resistance, it could continue to move down. Initial support on the downside is near the $300 level or the 61.8% Fib retracement level of the upward move from the $289.4 swing low to the $320.1 high.

The next major support is near the $292 level. The main support sits at $288. If there is a downside break below the $288 support, the price could drop toward the $282 support. Any more losses could initiate a larger decline toward the $262 level.

Technical Indicators

4-Hours MACD – The MACD for BNB/USD is losing pace in the bullish zone.

4-Hours RSI (Relative Strength Index) – The RSI for BNB/USD is currently below the 50 level.

Major Support Levels – $300, $292, and $288.

Major Resistance Levels – $315, $320, and $325.

BNB Price Prediction – Why Bulls Could Aim Fresh Rally To $350

BNB price is holding gains above the $300 pivot level. It is showing positive signs and might rally toward the $350 resistance zone.

  • BNB price is moving higher above the $300 resistance.
  • The price is now trading near $310 and the 100 simple moving average (4 hours).
  • There is a key declining channel or a bullish flag pattern forming with resistance near $325 on the 4-hour chart of the BNB/USD pair (data source from Binance).
  • The pair might continue to move up if there is a clear move above $315 and $325

BNB Price Aims Higher

After a major increase, BNB price faced resistance near the $340 zone. The price started a downside correction and recently tested the $290 zone. A low was formed near $289, and the price is now attempting a fresh increase, like Bitcoin and Ethereum.

There was a move above the $295 and $300 levels. The bulls pushed the price above the 50% Fib retracement level of the downward move from the $332 swing high to the $289 low. BNB is now trading near $310 and the 100 simple moving average (4 hours).

The current price action is positive and signals more upsides. Immediate resistance is near the $315 level. It is close to the 61.8% Fib retracement level of the downward move from the $332 swing high to the $289 low.

The next resistance sits near the $322 level. There is also a key declining channel or a bullish flag pattern forming with resistance near $325 on the 4-hour chart of the BNB/USD pair. A clear move above the $225 zone could send the price further higher.

BNB Price

Source: BNBUSD on TradingView.com

In the stated case, BNB price could test $340. A close above the $340 resistance might set the pace for a larger increase toward the $350 resistance. Any more gains might call for a test of the $375 level.

Downside Correction?

If BNB fails to clear the $322 resistance, it could start a downside correction. Initial support on the downside is near the $300 level.

The next major support is near the $292 level. The main support sits at $288. If there is a downside break below the $288 support, the price could drop toward the $262 support. Any more losses could initiate a larger decline toward the $250 level.

Technical Indicators

4-Hours MACD – The MACD for BNB/USD is gaining pace in the bullish zone.

4-Hours RSI (Relative Strength Index) – The RSI for BNB/USD is currently above the 50 level.

Major Support Levels – $300, $292, and $288.

Major Resistance Levels – $315, $322, and $325.

BNB Price Clears $250 and Could Rally 10% To Retest This Key Resistance

BNB price gained momentum and climbed above the $250 resistance. It is showing positive signs and might rally toward the $272 resistance zone.

  • BNB price is moving higher above the $250 resistance.
  • The price is now trading above $250 and the 100 simple moving average (4 hours).
  • There was a break above a key bearish trend line with resistance near $252 on the 4-hour chart of the BNB/USD pair (data source from Binance).
  • The pair might continue to move up if there is a clear move above $258.

BNB Price Regains Traction

These past few days, BNB price formed a base above the $230 level. The price started a decent increase above the $240 and $242 resistance levels. In the past two sessions, it even outperformed Ethereum and Bitcoin.

BNB broke the 76.4% Fib retracement level of the downward move from the $257.1 swing high to the $231.9 low. There was also a break above a key bearish trend line with resistance near $252 on the 4-hour chart of the BNB/USD pair.

It is now trading above $250 and the 100 simple moving average (4 hours). The current price action is positive and signaling more upsides above the $258 resistance zone.

The next resistance sits near the $262 level. A clear move above the $262 zone could send the price further higher. In the stated case, BNB price could test $272. It is close to the 1.618 Fib extension level of the downward move from the $257.1 swing high to the $231.9 low.

BNB Price

Source: BNBUSD on TradingView.com

A close above the $272 resistance might set the pace for a larger increase toward the $285 resistance. Any more gains might call for a test of the $300 level.

Downside Correction?

If BNB fails to clear the $258 resistance, it could start a downside correction. Initial support on the downside is near the $248 level.

The next major support is near the $242 level. The main support sits at $232. If there is a downside break below the $232 support, the price could drop toward the $222 support. Any more losses could initiate a larger decline toward the $205 level.

Technical Indicators

4-Hours MACD – The MACD for BNB/USD is gaining pace in the bullish zone.

4-Hours RSI (Relative Strength Index) – The RSI for BNB/USD is currently above the 50 level.

Major Support Levels – $248, $242, and $232.

Major Resistance Levels – $258, $272, and $285.

BNB Price Momentum Reignites – Why Bulls Could Aim For 15% Rally

BNB price gained momentum and climbed above the $250 resistance. It is up over 5% and the bulls could soon aim for a move toward the $300 level.

  • BNB price is moving higher above the $250 resistance.
  • The price is now trading above $255 and the 100 simple moving average (4 hours).
  • There is a major bullish trend line forming with support at $253.5 on the 4-hour chart of the BNB/USD pair (data source from Binance).
  • The pair might continue to move up if there is a clear move above $268.

BNB Price Jumps 8%

These past few days, BNB price remained stable above the $240 resistance. The bulls stepped in and were able to clear a major hurdle at $250. It opened the doors for more upsides above $255.

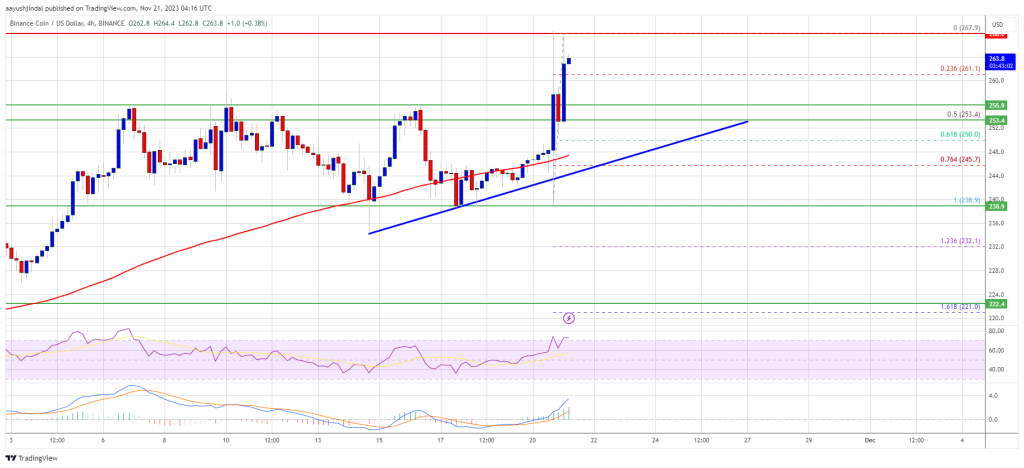
BNB gained traction and climbed above $260. It is up over 5% and outperforming both Bitcoin and Ethereum. A new multi-week high is formed near $267.9 and the price is now consolidating gains. It is above the 23.6% Fib retracement level of the upward move from the $238.9 swing low to the $267.9 high.

BNB is also trading above $255 and the 100 simple moving average (4 hours). Besides, there is a major bullish trend line forming with support at $253.5 on the 4-hour chart of the BNB/USD pair.

BNB Price Jumps 8%

Source: BNBUSD on TradingView.com

If there is a fresh increase, the price could face resistance near the $265 level. The next resistance sits near the $268 level. A clear move above the $268 zone could send the price further higher. In the stated case, BNB price could test $280. A close above the $280 resistance might set the pace for a larger increase toward the $300 resistance.

Downside Correction?

If BNB fails to clear the $265 resistance, it could start a downside correction. Initial support on the downside is near the $260 level. The next major support is near the $255 level.

The main support sits at $253 or the trend line. It is close to the 50% Fib retracement level of the upward move from the $238.9 swing low to the $267.9 high. If there is a downside break below the $253 support, the price could drop toward the $245 support. Any more losses could initiate a larger decline toward the $238 level.

Technical Indicators

4-Hours MACD – The MACD for BNB/USD is gaining pace in the bullish zone.

4-Hours RSI (Relative Strength Index) – The RSI for BNB/USD is currently above the 50 level.

Major Support Levels – $260, $255, and $253.

Major Resistance Levels – $265, $268, and $280.

BNB Price Shows Signs of Life But $250 Is The Key To More Upsides

BNB price avoided a major decline below $200 and recovered against the US Dollar. It climbed above $235 and now faces many hurdles near $245 and $250.

  • BNB price is slowly moving higher toward the $250 resistance.
  • The price is now trading above $235 and the 100 simple moving average (4 hours).
  • There is a key bullish trend line forming with support at $241.5 on the 4-hour chart of the BNB/USD pair (data source from Binance).
  • The pair might gain bullish momentum if there is a clear move above $250.

BNB Price Recovers 10%

These past few days, BNB price managed to start a recovery wave above the $220 resistance. The recent positive moves in Bitcoin, Ethereum, and other altcoins sparked a decent increase in BNB.

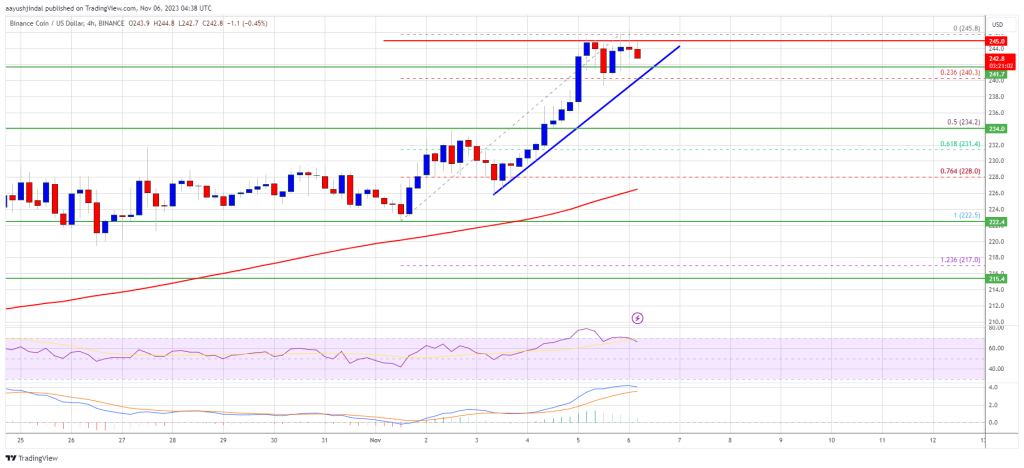
There was a steady move above the $232 and $235 resistance levels. The price even climbed toward the $245 resistance. A high is formed near $245.8 and the price is now consolidating gains. It is trading above the 23.6% Fib retracement level of the upward move from the $222.5 swing low to the $245.8 high.

BNB is also trading above $235 and the 100 simple moving average (4 hours). Besides, there is a key bullish trend line forming with support at $241.5 on the 4-hour chart of the BNB/USD pair.

BNB Price

Source: BNBUSD on TradingView.com

If there is a fresh increase, the price could face resistance near the $245 level. The next resistance sits near the $250 level. A clear move above the $250 zone could send the price further higher. In the stated case, BNB price could test $265. A close above the $265 resistance might set the pace for a larger increase toward the $280 resistance.

Downside Correction?

If BNB fails to clear the $245 resistance, it could start a downside correction. Initial support on the downside is near the $240 level and the trend line.

The next major support is near the $235 level or 50% Fib retracement level of the upward move from the $222.5 swing low to the $245.8 high. If there is a downside break below the $235 support, the price could drop toward the $226 support. Any more losses could initiate a larger decline toward the $220 level.

Technical Indicators

4-Hours MACD – The MACD for BNB/USD is losing pace in the bullish zone.

4-Hours RSI (Relative Strength Index) – The RSI for BNB/USD is currently above the 50 level.

Major Support Levels – $240, $235, and $226.

Major Resistance Levels – $245, $250, and $265.

BNB Price At Make-Or-Break Moment, Key Levels To Watch

BNB price struggled to climb above $240 and corrected gains against the US Dollar. It is now approaching a major support zone at $220 and $215.

  • BNB price is slowly moving lower toward the $220 support against the US Dollar.
  • The price is now trading above $215 and the 100 simple moving average (4 hours).
  • There is a key bullish flag pattern forming with resistance near $225 on the 4-hour chart of the BNB/USD pair (data source from Binance).
  • The pair might gain bullish momentum if there is a clear move above $228.

BNB Price Eyes Fresh Increase

These past few days, BNB price saw a decent recovery wave above the key $220 resistance zone. Bitcoin rallied over 20% to $35,000 and helped BNB avoid a major downside break.

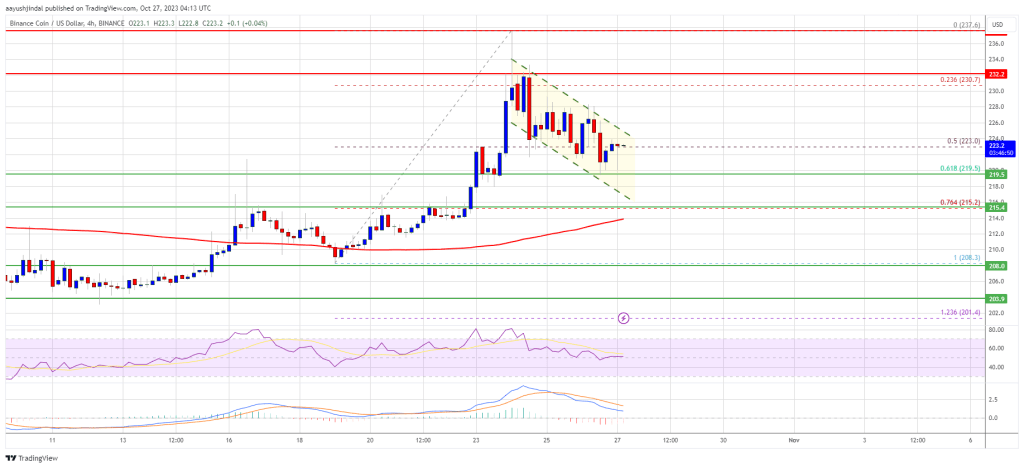
The price climbed above the $225 and $230 resistance levels. However, it struggled near the $238-$240 zone. A high was formed near $237.6 and the price recently started a downside correction. There was a move below the $235 level.

BNB dipped below the 50% Fib retracement level of the upward move from the $208.3 swing low to the $237.6 high. It is now trading above $215 and the 100 simple moving average (4 hours). There is also a key bullish flag pattern forming with resistance near $225 on the 4-hour chart of the BNB/USD pair.

BNB Price

If there is a fresh increase, the price could face resistance near the $225 level. The next resistance sits near the $228 level. A clear move above the $228 zone could send the price further higher. In the stated case, BNB price could test $238. A close above the $238 resistance might set the pace for a larger increase toward the $250 resistance.

More Losses?

If BNB fails to clear the $228 resistance, it could start another decline. Initial support on the downside is near the $220 level and the 61.8% Fib retracement level of the upward move from the $208.3 swing low to the $237.6 high.

The next major support is near the $215 level or the 100 simple moving average (4 hours). If there is a downside break below the $215 support, the price could drop toward the $207 support. Any more losses could initiate a larger decline toward the $202 level.

Technical Indicators

4-Hours MACD – The MACD for BNB/USD is losing pace in the bullish zone.

4-Hours RSI (Relative Strength Index) – The RSI for BNB/USD is currently above the 50 level.

Major Support Levels – $220, $215, and $207.

Major Resistance Levels – $225, $228, and $238.

BNB Price Prediction – Bears Struggle, Will Price Finally Cross $220?

BNB price is still consolidating above the $200 support zone against the US Dollar. It could start a decent increase if there is a close above the $220 resistance.

  • BNB price is slowly moving higher toward the $220 resistance against the US Dollar.
  • The price is now trading above $210 and the 100 simple moving average (4 hours).
  • There is a key bullish trend line forming with support near $211.5 on the 4-hour chart of the BNB/USD pair (data source from Binance).
  • The pair might gain bullish momentum if there is a daily close above $220.

BNB Price Remains In A Range

This past week, BNB price again retested the $200-$202 support zone. The bears made another attempt to clear the key $200 support, but they failed. A low was formed near $203 before the price started a decent increase, like Bitcoin and Ethereum.

There was a move above the $210 and $212 levels. The price tested the main $220 resistance. A high is formed near $219.2 and the price is now consolidating above the 50% Fib retracement level of the upward move from the $203 swing low to the $220 high.

BNB is now trading above $210 and the 100 simple moving average (4 hours). There is also a key bullish trend line forming with support near $211.5 on the 4-hour chart of the BNB/USD pair.

BNB Price Prediction

Source: BNBUSD on TradingView.com

If there is a fresh increase, the price could face resistance near the $215.5 level. The next resistance sits near the $220 level. A clear move above the $220 zone could send the price further higher. In the stated case, BNB price could test $235. A close above the $235 resistance might set the pace for a larger increase toward the $250 resistance.

More Losses?

If BNB fails to clear the $220 resistance, it could start another decline. Initial support on the downside is near the $211 level and the trend line. The next major support is near the $207 level or the 76.4% Fib retracement level of the upward move from the $203 swing low to the $220 high.

If there is a downside break below the $207 support, the price could drop toward the $202 support. Any more losses could initiate a larger decline toward the $185 level.

Technical Indicators

4-Hours MACD – The MACD for BNB/USD is losing pace in the bearish zone.

4-Hours RSI (Relative Strength Index) – The RSI for BNB/USD is currently above the 50 level.

Major Support Levels – $211, $207, and $202.

Major Resistance Levels – $215, $220, and $222.

BNB Price Prediction – Bears Aim Nasty Drop Below $200, Here’s Why

BNB price (Binance coin) is still struggling to clear the $220 resistance against the US Dollar. The price could decline heavily below the $210 and $202 support levels.

  • Binance coin price is slowly moving lower from the $220 resistance against the US Dollar.
  • The price is now trading below $215 and the 100 simple moving average (4 hours).
  • There was a break below a key bullish trend line with support near $214.5 on the 4-hour chart of the BNB/USD pair (data source from Binance).
  • The pair might accelerate lower if it breaks the $210 support level.

Binance Coin Price Remains At Risk

This past week, BNB price attempted a recovery wave above the $210 level. The price was able to clear the $215 resistance zone. However, it failed to clear the $220 resistance.

There was a fresh decline in BNB, like Bitcoin and Ethereum. The price declined below the $215 support level. The bears pushed the price below the 50% Fib retracement level of the upward move from the $207 swing low to the $221 high.

Besides, there was a break below a key bullish trend line with support near $214.5 on the 4-hour chart of the BNB/USD pair. The price is now trading below $215 and the 100 simple moving average (4 hours).

It is consolidating near the 76.4% Fib retracement level of the upward move from the $207 swing low to the $221 high. If there is a recovery wave, the price could face resistance near the $213 level and the 100 simple moving average (4 hours).

BNB Price Prediction

Source: BNBUSD on TradingView.com

The next resistance sits near the $215 level. A clear move above the $215 zone could send the price further higher. In the stated case, BNB price could test the main resistance at $220-$222. A close above the $222 resistance might set the pace for a larger increase toward the $250 resistance.

More Losses in BNB?

If BNB fails to clear the $215 resistance, it could start another decline. Initial support on the downside is near the $210 level. The next major support is near the $207 level.

If there is a downside break below the $207 support, the price could drop toward the $202 support. Any more losses could initiate a larger decline toward the $165 level.

Technical Indicators

4-Hours MACD – The MACD for BNB/USD is gaining pace in the bearish zone.

4-Hours RSI (Relative Strength Index) – The RSI for BNB/USD is currently below the 50 level.

Major Support Levels – $210, $207, and $202.

Major Resistance Levels – $215, $220, and $222.